Patient Satisfaction and Long‐Term Outcomes: A 7‐ to 9‐Year Prospective Cohort Study of Root Canal Treatment in the Swedish Public Dental Service
Emma Wigsten, Anita Afkhami, Hosaina Afewerki, Anna Levinsson, Lars Bjørndal, Lars Bjørndal, Victoria S. Dawson, Helena Fransson, Fredrik Frisk, Peter Jonasson, Thomas Kvist, Merete Markvart, Maria Pigg, Dan Sebring, Emma Wigsten, Thomas Kvist

TL;DR
A study in Sweden found that most patients remained satisfied with root canal treatment even seven to nine years later, despite some teeth being extracted.
Contribution
The study provides long-term patient-reported outcomes on root canal treatment in a public dental service setting.
Findings
Most patients reported high satisfaction with root canal treatment seven to nine years post-treatment.
Over time, current pain intensity decreased and retrospective satisfaction improved.
One-third of treated teeth were extracted, but most patients would still choose root canal treatment again.
Abstract
This prospective follow‐up study aimed to assess patient satisfaction with root canal treatment (RCT) 7–9 years after initiation in a general dental practice setting. A study population of 243 patients initiated RCT at 20 public dental clinics in the Västra Götaland Region, Sweden. One to 3 years later, 159 patients (67.4%) responded to an 8‐item questionnaire assessing patient satisfaction with RCT and treatment results. The questionnaire was sent out again 7–9 years after treatment initiation. Descriptive and analytical statistics were used to compare respondents and non‐respondents, tooth groups and comparison over time. A total of 156 patients (72.2%) responded to the 7–9 years' questionnaire; 82 women (52.6%) and 74 men (47.4%) with a mean age of 59.3 years (SD = ±15.3). Non‐respondents were significantly younger (p < 0.001). The majority of RCTs were reported as completed with a…
Genes, proteins, chemicals, diseases, species, mutations and cell lines named across the full text — each resolved to its canonical identifier and authoritative record.
Click any figure to enlarge with its caption.
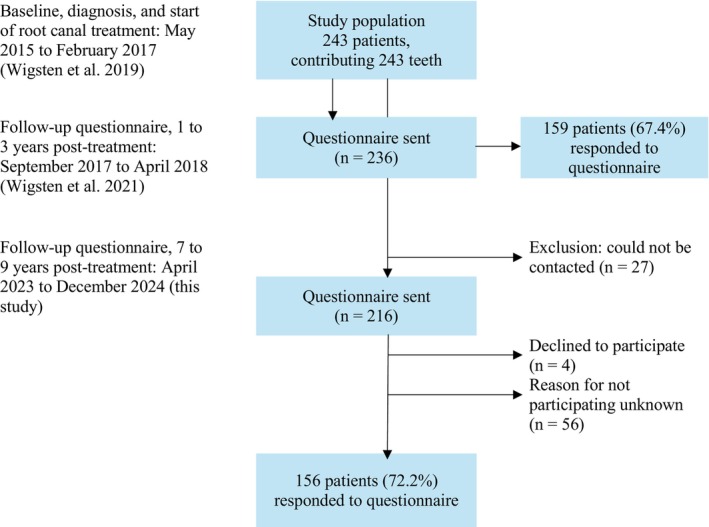 FIGURE 1
| Questions | |||
|---|---|---|---|
| 1 | What has happened to the tooth? | □ | The tooth is root filled |
| □ | The root canal treatment is not yet completed | ||
| □ | The tooth has been extracted and has been, or has not been, replaced | ||
| Variable | Total | Respondents | Non‐respondents |
|
|---|---|---|---|---|
|
|
|
| ||
| Gender | 0.853 | |||
| Male | 104 (48.1%) | 74 (47.4%) | 30 (50%) | |
| Female | 112 (51.9%) | 82 (52.6%) | 30 (50%) | |
| Age at treatment | ||||
| Mean (SD) | 48.9 (15.3) | 51.6 (15.3) | 41.9 (12.7) | < 0.001 |
| Median (min; max) | 50.0 (19.0; 84.0) | 52.5 (19.0; 84.0) | 41.0 (19.0; 72.0) | |
| Age group at treatment | < 0.001 | |||
| Below 30 years old | 28 (13.0%) | 17 (10.9%) | 11 (18.3%) | |
| 30–39 years old | 34 (15.7%) | 18 (11.5%) | 16 (26.7%) | |
| 40–49 years old | 45 (20.8%) | 27 (17.3%) | 18 (30.0%) | |
| 50–59 years old | 53 (24.5%) | 45 (28.8%) | 8 (13.3%) | |
| 60–70 years old | 37 (17.1%) | 31 (19.9%) | 6 (10%) | |
| Over 70 years old | 19 (8.8%) | 18 (11.5%) | 1 (1.7%) | |
| Jaw | 0.281 | |||
| Maxilla | 126 (58.3%) | 95 (60.9%) | 31 (51.7%) | |
| Mandible | 90 (41.7%) | 61 (39.1%) | 29 (48.3%) | |
| Tooth type | 0.957 | |||
| Incisor | 41 (19.0%) | 29 (18.6%) | 12 (20.0%) | |
| Premolar | 71 (32.9%) | 51 (32.7%) | 20 (33.3%) | |
| Molar | 104 (48.1%) | 76 (48.7%) | 28 (46.7%) | |
| Tooth type by jaw | 0.248 | |||
| Incisor (maxillary) | 34 (15.7%) | 23 (14.7%) | 11 (18.3%) | |
| Incisor (mandibular) | 7 (3.2%) | 6 (3.8%) | 1 (1.7%) | |
| Premolar (maxillary) | 50 (23.1%) | 36 (23.1%) | 14 (23.3%) | |
| Premolar (mandibular) | 21 (9.7%) | 15 (9.6%) | 6 (10%) | |
| Molar (maxillary) | 42 (19.4%) | 36 (23.1%) | 6 (10%) | |
| Molar (mandibular) | 62 (28.7%) | 40 (25.6%) | 22 (36.7%) | |
| Presence of pain | 0.883 | |||
| Absence | 70 (32.4%) | 51 (32.7%) | 19 (31.7%) | |
| Presence | 137 (63.4%) | 97 (62.2%) | 40 (66.7%) | |
| Missing responses | 9 (42.0%) | 8 (5.1%) | 1 (1.7%) |
| Variable | Incisor | Premolar | Molar |
|
|---|---|---|---|---|
|
|
|
| ||
| Time between treatment and follow‐up (months) | ||||
| Mean (SD) | 92.0 (5.6) | 93.2 (6.5) | 93.6 (6.3) | 0.491 |
| Median (min; max) | 91.0 (79.0; 108.0) | 94.0 (74.0; 109.0) | 95.0 (83.0; 107.0) | |
| Gender | 0.994 | |||
| Male | 14 (48.3%) | 24 (47.1%) | 36 (47.4%) | |
| Female | 15 (51.7%) | 27 (52.9%) | 40 (52.6%) | |
| Age at treatment (years) | ||||
| Mean (SD) | 49.9 (21.9) | 55.5 (13.5) | 49.6 (13.1) | 0.054 |
| Median (min; max) | 58.0 (20.0; 81.0) | 56.0 (25.0; 84.0) | 51.0 (19.0; 79.0) | |
| Age group at treatment | < 0.002 | |||
| Below 30 years old | 7 (24.1%) | 3 (5.9%) | 7 (9.2%) | |
| 30–39 years old | 5 (17.2%) | 4 (7.8%) | 9 (11.8%) | |
| 40–49 years old | 1 (3.4%) | 8 (15.7%) | 18 (23.7%) | |
| 50–59 years old | 2 (6.9%) | 17 (33.3%) | 26 (34.2%) | |
| 60–70 years old | 7 (24.1%) | 11 (21.6%) | 13 (17.1%) | |
| Over 70 years old | 7 (24.1%) | 8 (15.7%) | 3 (3.9%) | |
| Age at follow‐up (years) | ||||
| Mean (SD) | 57.6 (21.9) | 63.3 (13.4) | 57.3 (13.1) | 0.048 |
| Median (min; max) | 66.0 (28.0; 89.0) | 63.0 (33.0; 92.0) | 59.0 (27.0; 86.0) | |
| Below 30 years old | 4 (13.8%) | 0 (0%) | 2 (2.6%) | < 0.001 |
| 30–39 years old | 6 (20.7%) | 3 (5.9%) | 7 (9.2%) | |
| 40–49 years old | 2 (6.9%) | 5 (9.8%) | 12 (15.8%) | |
| 50–59 years old | 1 (3.4%) | 12 (23.5%) | 20 (26.3%) | |
| 60–70 years old | 3 (10.3%) | 14 (27.5%) | 23 (30.3%) | |
| Over 70 years old | 13 (44.8%) | 17 (33.3%) | 12 (15.8%) | |
| Jaw | 0.003 | |||
| Maxilla | 23 (79.3%) | 36 (70.6%) | 36 (47.4%) | |
| Mandible | 6 (20.7%) | 15 (29.4%) | 40 (52.6%) | |
| Presence of pain | 0.231 | |||
| Absence | 13 (44.8%) | 13 (25.5%) | 25 (32.9%) | |
| Presence | 15 (51.7%) | 35 (68.6%) | 47 (61.8%) | |
| Missing response | 1 (3.4%) | 3 (5.9%) | 4 (5.3%) | |
| Variable | Total ( | Incisor ( | Premolar ( | Molar ( |
|
|---|---|---|---|---|---|
| Treatment completion | < 0.001 | ||||
| Root filled | 102 (65.4%) | 26 (89.7%) | 33 (64.7%) | 43 (56.6%) | |
| Non‐root filled | 0 (0%) | 0 (0%) | 0 (0%) | 0 (0%) | |
| Extracted | 52 (33.4%) | 3 (10.3%) | 17 (33.3%) | 32 (42.1%) | |
| Missing responses | 2 (1.3%) | 0 (0%) | 1 (2%) | 1 (1.3%) | |
| Present pain intensity | |||||
| Mean (SD) | 0.6 (1.3) | 0.8 (0.9) | 0.9 (2.0) | 0.4 (0.6) | 0.207 |
| Median (min; max) | 0.2 (0.0; 8.7) | 0.5 (0.0; 3.8) | 0.2 (0.0; 8.7) | 0.2 (0.0; 3.2) | |
| No pain | 66 (63.5%) | 11 (42.3%) | 22 (64.7%) | 33 (75.0%) | 0.009 |
| Mild pain | 30 (28.8%) | 14 (53.8%) | 7 (20.6%) | 9 (20.5%) | |
| Moderate pain | 1 (1.0%) | 1 (3.8%) | 0 (0%) | 0 (0%) | |
| Severe pain | 2 (1.9%) | 0 (0%) | 2 (5.9%) | 0 (0%) | |
| Missing responses | 5 (4.8%) | 0 (0%) | 3 (8.8%) | 2 (4.5%) | |
| Intra‐operative pain | |||||
| Mean (SD) | 2.7 (2.5) | 2.0 (2.4) | 2.7 (2.3) | 2.9 (2.6) | 0.221 |
| Median (min; max) | 2.0 (0.0; 9.5) | 0.75 (0.0; 7.5) | 2.3 (0.0; 9.5) | 2.45 (0.0; 9.4) | |
| No pain | 35 (22.4%) | 11 (37.9%) | 9 (17.6%) | 15 (19.7%) | 0.363 |
| Mild pain | 61 (39.1%) | 10 (34.5%) | 23 (45.1%) | 28 (36.8%) | |
| Moderate pain | 36 (23.1%) | 4 (13.8%) | 13 (25.5%) | 19 (25%) | |
| Severe pain | 14 (9.0%) | 3 (10.3%) | 3 (5.9%) | 8 (10.5%) | |
| Missing responses | 10 (6.4%) | 1 (3.4%) | 3 (5.9%) | 6 (7.9%) | |
| Post‐operative aesthetics | |||||
| Mean (SD) | 2.0 (2.2) | 2.7 (2.7) | 1.8 (2.2) | 1.7 (1.7) | 0.202 |
| Median (min; max) | 0.90 (0.0; 10.0) | 1.35 (0.0; 8.1) | 0.8 (0.0; 10.0) | 0.9 (0.0; 5.4) | |
| Missing responses | 13 (12.5%) | 2 (6.9%) | 3 (5.9%) | 8 (10.5%) | |
| Chewing ability | |||||
| Mean (SD) | 1.3 (1.8) | 1.4 (2.1) | 1.5 (2.0) | 1.1 (1.4) | 0.615 |
| Median (min; max) | 0.5 (0.0; 8.2) | 0.45 (0.0; 8.2) | 0.55 (0.0; 7.6) | 0.45 (0.0; 5.2) | |
| Missing responses | 10 (9.6%) | 2 (6.9%) | 2 (3.9%) | 6 (7.9%) | |
| Cost | |||||
| Mean (SD) | 1.6 (2.1) | 1.6 (1.8) | 1.8 (2.6) | 1.3 (1.7) | 0.643 |
| Median (min; max) | 0.5 (0.0; 10.0) | 0.7 (0.0; 5.2) | 0.4 (0.0; 10.0) | 0.5 (0.0; 5.7) | |
| Missing responses | 16 (15.4%) | 5 (17.2%) | 4 (7.8%) | 7 (9.2%) | |
| RCT in retrospect | |||||
| Yes | 114 (73.1%) | 26 (89.7%) | 38 (74.5%) | 50 (65.8%) | 0.132 |
| No | 17 (10.9%) | 1 (3.4%) | 7 (13.7%) | 9 (11.8%) | |
| Uncertain | 17 (10.9%) | 1 (3.4%) | 4 (7.8%) | 12 (15.8%) | |
| Missing responses | 8 (5.1%) | 1 (3.4%) | 2 (3.9%) | 5 (6.6%) |
| Variable | 1‐ to 3‐year follow‐up | 7‐ to 9‐year follow‐up | Standardised mean difference |
|
|---|---|---|---|---|
| Treatment completion | ||||
| Root filled | 87 (69.6%) | 81 (64.8%) | < 0.001 | |
| Non‐root filled | 7 (5.6%) | 0 (0%) | ||
| Extracted | 31 (24.8%) | 43 (34.4%) | ||
| Missing responses | 0 (0%) | 1 (0.8%) |
| Variable | Yes | No | Uncertain |
| Yes | No/uncertain |
|
|---|---|---|---|---|---|---|---|
| ( | ( | ( | ( | ( | |||
| Patient‐ and tooth‐specific characteristics | |||||||
| Gender | 0.788 | 1.000 | |||||
| Male | 53 (46.5%) | 9 (52.9%) | 7 (41.2%) | 53 (46.5%) | 16 (47.1%) | ||
| Female | 61 (53.5%) | 8 (47.1%) | 10 (58.8%) | 61 (53.5%) | 18 (52.9%) | ||
| Age at treatment | 0.655 | 0.626 | |||||
| Mean (SD) | 51.8 (15.9) | 52.4 (13.1) | 48.3 (13.0) | 51.8 (15.9) | 50.4 (13.0) | ||
| Age group at treatment | 0.407 | 0.117 | |||||
| Below 30 years old | 14 (12.3%) | 1 (5.9%) | 1 (5.9%) | 14 (12.3%) | 2 (5.9%) | ||
| 30–39 years old | 15 (13.2%) | 1 (5.9%) | 2 (11.8%) | 15 (13.2%) | 3 (8.8%) | ||
| 40–49 years old | 15 (13.2%) | 6 (35.3%) | 4 (23.5%) | 15 (13.2%) | 10 (29.4%) | ||
| 50–59 years old | 32 (28.1%) | 5 (29.4%) | 7 (41.2%) | 32 (28.1%) | 12 (35.3%) | ||
| 60–69 years old | 22 (19.3%) | 3 (17.6%) | 3 (17.6%) | 22 (19.3%) | 6 (17.6%) | ||
| Over 70 years old | 16 (14.0%) | 1 (5.9%) | 0 (0%) | 16 (14.0%) | 1 (2.9%) | ||
| Jaw | 0.964 | 0.944 | |||||
| Maxilla | 70 (61.4%) | 10 (58.8%) | 10 (58.8%) | 70 (61.4%) | 20 (58.8%) | ||
| Mandible | 44 (38.6%) | 7 (41.2%) | 7 (41.2%) | 44 (38.6%) | 14 (41.2%) | ||
| Tooth group | 0.132 | 0.057 | |||||
| Incisor | 26 (22.8%) | 1 (5.9%) | 1 (5.9%) | 26 (22.8%) | 2 (5.9%) | ||
| Premolar | 38 (33.3%) | 7 (41.2%) | 4 (23.5%) | 38 (33.3%) | 11 (32.4%) | ||
| Molar | 50 (43.9%) | 9 (52.9%) | 12 (70.6%) | 50 (43.9%) | 21 (61.8%) | ||
| Tooth type by jaw | 0.596 | 0.265 | |||||
| Incisor (maxillary) | 20 (17.5%) | 1 (5.9%) | 1 (5.9%) | 20 (17.5%) | 2 (5.9%) | ||
| Incisor (mandibular) | 6 (5.3%) | 0 (0%) | 0 (0%) | 6 (5.3%) | 0 (0%) | ||
| Premolar (maxillary) | 27 (23.7%) | 4 (23.5%) | 3 (17.6%) | 27 (23.7%) | 7 (20.6%) | ||
| Premolar (mandibular) | 11 (9.6%) | 3 (17.6%) | 1 (5.9%) | 11 (9.6%) | 4 (11.8%) | ||
| Molar (maxillary) | 23 (20.2%) | 5 (29.4%) | 6 (35.3%) | 23 (20.2%) | 11 (32.4%) | ||
| Molar (mandibular) | 27 (23.7%) | 4 (23.5%) | 6 (35.3%) | 27 (23.7%) | 10 (29.4%) | ||
| Presence of pain | 0.273 | 0.411 | |||||
| Absence | 39 (34.2%) | 6 (35.3%) | 2 (11.8%) | 39 (34.2%) | 8 (23.5%) | ||
| Presence | 70 (61.4%) | 11 (64.7%) | 12 (70.6%) | 70 (61.4%) | 23 (67.6%) | ||
| Missing responses | 5 (4.4%) | 0 (0%) | 3 (17.6%) | 5 (4.4%) | 3 (8.8%) | ||
- —Public Dental Service in Västra Götaland Region, and the Sahlgrenska Academy, Institute of Odontology, University of Gothenburg
Peer Reviews
No public reviews on file for this paper yet. If you reviewed it on a platform where reviews are public (OpenReview, ICLR, NeurIPS, ICML), you can paste yours below so the community can read it here.
Videos
No videos yet. Explain this paper in a talk, walkthrough, or lecture? Add one.
Taxonomy
TopicsEndodontics and Root Canal Treatments · Dental Radiography and Imaging · Dental Anxiety and Anesthesia Techniques
Introduction
1
Outcomes of root canal treatment (RCT) are commonly evaluated through a combination of clinical and radiographic evaluations. These typically focus on objective parameters such as tooth survival, absence of pain or discomfort and the status of the periapical tissues (Strindberg 1956; Ørstavik et al. 1986; Ng et al. 2007; Nixdorf et al. 2010; Ng et al. 2011a; Ng et al. 2011b). These parameters are often used by clinicians and researchers to determine whether the outcome of RCT constitutes a success or a failure (Strindberg 1956; Ørstavik et al. 1986; Ng et al. 2007; Nixdorf et al. 2010; Ng et al. 2011a; Ng et al. 2011b).
However, patients are often unaware of the persistent periapical inflammation due to its generally asymptomatic nature (Bergenholtz and Spångberg 2004; Friedman and Mor 2004). This may lead to discrepancies between the clinician's and the patient's subjective perception of treatment outcome (Reit and Kvist 1998; Atmeh and Hamasha 2020). Incorporating patient‐reported outcome measures alongside clinical and radiological evaluations may therefore provide a more comprehensive and patient‐centred assessment of RCT outcomes (Wigsten et al. 2021; Wigsten et al. 2022).
Patients' experiences are often explored within the concept of quality of life and satisfaction (Newsome and Wright 1999a, 1999b; Leong and Yap 2020). Today, these aspects are recognised as core outcomes across all endodontic treatment modalities, as highlighted by the European Society of Endodontology (ESE; El Karim et al. 2024).
Notably, most studies evaluating patient perspectives on RCT have been conducted in controlled settings such as universities, dental hospitals or specialist clinics (Gõrduysus and Gõrduysus 2000; Dugas et al. 2002; Gatten et al. 2011; Hamasha and Hatiwsh 2013; Torabinejad et al. 2014). However, as RCT is primarily performed in general dental practice (Fransson et al. 2016), there is a significant gap in the literature regarding patients' experiences in this setting (Wigsten et al. 2020; Wigsten et al. 2021). Furthermore, the predominance of cross‐sectional study designs highlights the need for prospective longitudinal studies (Hamasha and Hatiwsh 2013; Torabinejad et al. 2014).
This prospective follow‐up study aimed to assess patient satisfaction with RCT 7–9 years after the treatment initiation in a general dental practice setting.
Materials and Methods
2
The study adhered to the STROBE guidelines for cohort studies. The authors declare no conflict of interests. Written informed consent was obtained from all participants. Ethical approval for the study was provided by the Regional Ethical Committee in Gothenburg, Sweden, in 2015 (dnr: 857‐14). No monetary incentives were offered for participation in the study.
Study Design and Population
2.1
The study included 243 patients who started RCT at 20 general dental care clinics within the public dental service in the Västra Götaland Region, Sweden, between 2015 and 2017 (Figure 1). Detailed patient‐ and tooth‐specific characteristics have been described in Wigsten et al. (2019). In short, the cohort included 128 women (52.7%) and 115 men (47.3%), aged 18–88 years (mean age 48.3 years, SD = ±16.4). The majority of RCTs were initiated on symptomatic teeth (n = 152, 64.9%), with the most common diagnosis being pulpal necrosis (n = 111, 47.0%). Molar teeth were the most frequently treated (n = 116, 47.7%).
Flow chart of the study population. A total of 243 patients started root canal treatment during a designated 8‐week period at 20 public dental clinics in Sweden. Patient‐ and tooth‐specific characteristics were described in a previous study (Wigsten et al. 2019). One hundred fifty‐nine patients responded to the first questionnaire 1–3 years after treatment initiation, yielding a response rate of 67.4% (Wigsten et al. 2021). One hundred fifty‐six patients responded to the follow‐up questionnaire 7–9 years after treatment initiation, with a response rate of 72.2%.
One to 3 years after RCT initiation, 159 patients (67.4%) responded to a questionnaire on patient satisfaction and RCT outcomes (Wigsten et al. 2021; Figure 1). Reliability of the responses was considered good (weighted Kappa = 0.7184–0.9327; intraclass correlation coefficient = 0.540–0.796). In this follow‐up study, 7–9 years after starting RCT, two exclusion criteria were applied: missing contact details or a declination to participate in the study (Figure 1).
Questionnaire Design and Administration
2.2
A cover letter was attached to the questionnaire, providing a brief reminder about the study, instructions regarding the treated tooth and contact details for the research group. A pre‐addressed return envelope was included to facilitate the response. Non‐respondents received a reminder 3 weeks later, followed by a phone call. The distributions of questionnaires took place between April 2023 and December 2024 (Figure 1), with all materials presented in Swedish.
The questionnaire, detailed in Table 1, consisted of eight questions. Three of these questions were multiple‐choice (Questions 1, 3 and 8), while the remaining questions used visual analogue scales (VAS) with predefined endpoints. The VAS scales were 10 cm in length, ranging from ‘0’ (positive) to ‘10’ (negative).
The first question addressed the status of the tooth. Questions 2 and 3 assessed current pain intensity and its characteristics. The subsequent four questions evaluated the patient's perspective, including their recollection of pain during RCT and their perceptions of aesthetics, function and costs. The final question (Question 8) asked whether the patient would, in hindsight, choose the same treatment again. Patients who reported that the tooth was missing were instructed to respond only to Questions 4 and 8.
Analysis of the Study Population
2.3
The questionnaires were labelled with each patient's unique identification number, allocated in the first study (Wigsten et al. 2019) to ensure the anonymity of the responses. All data were manually entered into an Excel datasheet (Microsoft Corp, Redmond, WA, USA). Pre‐operative patient‐ and tooth‐specific characteristics (Wigsten et al. 2019) and responses from the previous questionnaire study (Wigsten et al. 2021) were already registered. When data for a variable were absent, the corresponding cells in the datasheet were left empty and designated in the analysis as missing. The interval between baseline and the completion of the second questionnaire was registered.
Statistical Analysis
2.4
Descriptive statistics were presented as frequency and percentage, or as mean, standard deviation (SD), median, minimum and maximum as appropriate. The distribution of pre‐operative patient‐ and tooth‐specific characteristics was compared between respondents and non‐respondents to the 7–9 years questionnaire using chi‐squared test (categorical variables) and t‐test (continuous variables).
Analogously, chi‐squared test and ANOVA were used to compare the distribution of characteristics among respondents by tooth group as well as test for differences in patient satisfaction and treatment outcomes by tooth group. Finally, the change in patient satisfaction and treatment outcomes between the 1–3 years and the 7–9 years follow‐up among participants having responded to both questionnaires was tested using the chi‐squared test and paired t‐tests, with standardised mean difference presented as Cohen's d, using the sample SD of the mean difference as standardiser. All tests of statistical significance were two‐sided and conducted at a 5% significance level. The analyses were carried out using R (version 4.2.1; R Foundation for Statistical Computing, Vienna, Austria) and IBM SPSS Statistics (version 28.0.1.1; IBM Corp., Armonk, NY, USA).
Results
3
At the 7‐ to 9‐year follow‐up, 156 of 216 eligible patients responded to the questionnaire, representing a 72.2% response rate (Figure 1; Table 2). Twenty‐seven were excluded due to inability to contact. The mean time from RCT initiation to follow‐up was 8 years (92.9 months, SD = ±6.1; Table 3). A majority of respondents (n = 125, 80.1%) had also responded to the initial questionnaire distributed 1–3 years after treatment initiation (Wigsten et al. 2021).
Respondents and Non‐Respondents
3.1
Eighty‐two women (52.6%) and 74 men (47.4%) responded (Table 2). The mean age was 59.3 years (SD = ±15.3). Attrition analysis showed that non‐respondents were significantly younger, with a mean age of 41.9 years (SD = ±12.7) versus 51.6 years (SD = ±15.3; p < 0.001).
Patient and Tooth Characteristics by Tooth Groups
3.2
Molars were the most commonly treated tooth group (n = 76, 48.7%), followed by premolars (n = 51, 32.7%) and incisors/canines (n = 29, 18.6%; Table 3). Most incisors and premolars were in the maxilla, while molars were more evenly distributed between the jaws (p = 0.003). Nearly a quarter of the incisor group patients were aged under 30, compared to 6% and 9% in the premolar and molar groups, respectively (p = 0.002). RCT had commonly been initiated due to pain (n = 97, 62.2%).
Treatment Completion After Initiated Root Canal Treatment
3.3
The majority of respondents reported a completed RCT (n = 102, 65.4%; Table 4), and 52 (33.4%) reported that the tooth had been extracted. A significantly larger proportion of incisors (89.7%) were reported as completed, compared to 64.7% of premolars and 56.6% of molars (p < 0.001).
Present Pain Intensity and Descriptive Pain Characteristics After Root Canal Treatment
3.4
Out of the 102 patients with completed RCT, 66 patients (63.5%) reported no current pain or discomfort (VAS = 0; Table 4). Among patients reporting current pain, the majority indicated mild pain (n = 30, 90.9%, VAS 0.1–3.0). Three patients reported moderate or severe pain (2.9%). The mean pain intensity was 0.6 (SD = ±1.3). Reported current pain differed significantly across tooth types: 57.7% of incisors (n = 15), 29.0% of premolars (n = 9) and 21.4% of molars (n = 9; p < 0.009).
Thirteen patients reported one or more pain characteristics (total 17 characteristics), with the affected teeth being 6 incisors, 1 premolar and 6 molars. The three most common characteristics were tenderness to touch (n = 6, 35.3%), sharp pain (n = 3, 17.6%) and dull/achy pain (n = 3, 17.6%). The majority reported mild pain (n = 9, 69.2%), while two (15.4%) reported moderate and one (7.7%) severe pain. The mean pain intensity was 2.2 (SD = ±2.1, median = 1.7).
Recollection of Intraoperative Pain During Root Canal Treatment
3.5
Thirty‐five patients (24.0%) reported no memory of pain or discomfort during the procedure (VAS = 0; Table 4). The remaining 111 respondents (76.0%) reported pain or discomfort, with the majority indicating mild pain (n = 61, 55.0%, VAS 0.1–3). The mean pain intensity was 2.7 (SD = ±2.5), with no significant differences between the tooth groups.
Patient Satisfaction With Aesthetics, Chewing Ability and Treatment Costs
3.6
Mean values of respondents' perceptions of aesthetics, chewing ability and costs ranged from VAS 1.6 to 2.0, with lower ratings indicating greater satisfaction (Table 4). The majority scored within the ‘0–3’ range for all three items: 68 (74.7%) for aesthetics, 79 (84.0%) for chewing ability and 70 (79.5%) for costs. No significant differences were observed between the tooth groups.
In Retrospect: Patient Perspectives on Undergoing Root Canal Treatment After 7–9 Years
3.7
The majority of patients (n = 114, 77.0%) reported they would choose to undergo RCT again (Table 4). Seventeen patients (11.5%) responded with either ‘No’ or were ‘Uncertain’. No significant differences were observed between the tooth groups (p = 0.132).
There were no statistically significant differences in baseline patient‐ or tooth‐specific characteristics between those retrospectively willing to undergo RCT or not (Table 6). Among patients positive towards repeating RCT, the majority (n = 89, 78.1%) had their tooth preserved and root filled, whereas among those unwilling to repeat RCT, the majority had their tooth extracted (n = 23, 67.7%; p < 0.001). Overall, patients willing to repeat the procedure reported less intra‐operative pain compared to those unwilling to repeat RCT (p = 0.019). Furthermore, present pain experience differed significantly between patients who would repeat RCT and those who would not (p = 0.006); of the 93 patients reporting no or mild pain, 85 (91.4%) registered that they would undergo RCT again. Greater satisfaction with aesthetic outcomes, chewing ability and treatment cost was also associated with a higher likelihood of retrospective willingness to undergo RCT (Table 6).
Comparing Respondents' Ratings at the 1‐ to 3‐Year and 7‐ to 9‐Year Follow‐Ups
3.8
Among patients who responded to both questionnaires, the proportion of extracted teeth increased significantly between follow‐ups, while the number of root filled teeth decreased at follow‐up (p < 0.001; Table 5).
Pain intensity decreased significantly between follow‐ups with a medium effect size (d = 0.5, 95% CI 0.20–0.70). Estimated treatment cost satisfaction showed a slight improvement (small effect size d = 0.3, 95% CI 0.00–0.52; Table 5).
Patients' attitudes towards RCT changed significantly, with more reporting that they would have chosen RCT in retrospect (p < 0.001; Table 5).
Discussion
4
Among the 156 patients available for follow‐up after 7–9 years (72.2%) in this prospective study, 102 teeth (65.4%) were root filled, while 52 teeth (33.4%) were extracted.
Tooth Extraction Following Initiation of Root Canal Treatment
4.1
Follow‐up studies commonly define baseline at the completion of RCT with the permanent root filling (Strindberg 1956; Ng et al. 2007; Nixdorf et al. 2010; Ng et al. 2011a; Ng et al. 2011b). In contrast, our study defined baseline as the appointment at which a tooth was diagnosed with pulp and periradicular disease and RCT was initiated (Wigsten et al. 2019; Wigsten et al. 2021; Wigsten et al. 2022). Although this may result in a less favourable view on RCT as a therapy modality, it provides a more comprehensive perspective. The relatively high number of extracted teeth in our cohort is to a certain extent explained by the fact that among all originally included, 32 patients (13.3%) had their tooth extracted before completion of RCT (Wigsten et al. 2022).
In particular, the high frequency of extracted molars (42.1%) was of concern in this study (Table 4). These findings corroborate with the previous studies presenting 1‐ and 3‐year follow‐ups of the same cohort (Wigsten et al. 2021; Wigsten et al. 2022). The findings also align with other follow‐up studies on root filled teeth, in which molars consistently show lower survival rates compared to other tooth groups (Fransson et al. 2016; Fransson et al. 2021; Göransson et al. 2021; Kebke et al. 2021). The reasons behind these observations are not fully understood, but a combination of occlusal and articulatory forces, combined with an inadequate coronal restoration, is generally considered to be a part of the explanation (Ng et al. 2011b). This view is supported by data clearly demonstrating better survival rates for teeth restored with an indirect restoration (Fransson et al. 2021). Furthermore, molars repeatedly exhibit complexity and technical challenges during RCT (Peters 2016). In cross‐sectional studies, molars present a high prevalence of technically inadequate root fillings and consequently a higher prevalence of apical periodontitis (Eckerbom et al. 2007; Laukkanen et al. 2021; Silnovic et al. 2023). The persistence of apical periodontitis in root filled teeth has also been demonstrated to increase the risk of tooth extraction (Kirkevang et al. 2017; Olsson et al. 2024).
In contrast to the poor survival rate among molars, the number of extracted incisors (10.3%) was low. In addition to their less vulnerable tooth position, easier access for RCT and a lower prevalence of persistent apical periodontitis (Silnovic et al. 2023), their perceived aesthetic and functional value may be involved. As patients often consider them particularly important and prioritise their preservation, a suboptimal outcome in terms of periapical status and comfort may be accepted (Gatten et al. 2011; Olsson et al. 2024).
Although the reasons for extraction over the 7‐ to 9‐year period remain unknown, first‐year data with 240 teeth indicated that most extractions (n = 17, 54.8%) were associated with endodontic complications such as apical periodontitis, perforations, instrument fractures and dentinal cracks (Wigsten et al. 2022). Seven teeth (22.6%) were extracted due to extensive tooth substance loss. In the remaining cases (n = 7, 22.6%), the extractions were performed at the patient's request for various reasons. In one case, the reason for extraction were not documented. This aligns with findings from other studies in general practice, where fractures, endodontic failure and caries have been identified as the primary causes of extraction in root filled teeth (Göransson et al. 2021; Kebke et al. 2021).
Pain Intensity: Present and Recalled Pain
4.2
RCT is often initiated due to pain (Reit et al. 1993; Bjørndal et al. 2006; Wigsten et al. 2019). Over time, the majority of patients reported absence of pain (63.5%) as well as a reduction in pain intensity. Nevertheless, the frequency of pain reported in this study was higher than observed in previous studies. For example, Nixdorf et al. (2010) and Jonsson Sjögren et al. (2019) found that approximately 5% of patients experienced persistent pain or discomfort from their root filled teeth. In contrast, Polycarpou et al. (2005) reported a significantly higher prevalence of 21.1% in a cohort assessed through clinical and radiographic examination.
This discrepancy may partly be attributed to differences in study design, clinical settings and recruitment procedures. Prospective studies involving patients who have undergone RCT in general dental practice, and particularly with baseline at treatment start, are rare. Comparing the results of persistent pain from this study with those from cross‐sectional or retrospective studies is problematic.
In terms of tooth type, incisors were more frequently associated with post‐treatment pain compared to other tooth groups (p = 0.009). Although the underlying reason remains unclear, patient‐related factors such as age and gender may contribute. However, this finding is in line with the above presumption that mild pain may be tolerable in highly valued anterior teeth, which may protect them from extraction. Torabinejad et al. (1988) and Jonsson Sjögren et al. (2019) reported a higher prevalence of postoperative pain among younger individuals, while Polycarpou et al. (2005) identified several risk factors for chronic pain, including female gender, a history of painful treatments, present pain and pain duration, among others. Further research is needed to clarify the correlation between demographic parameters and long‐term pain following RCT.
Regarding the treatment procedure itself, the majority of patients (76.0%) perceived it as painful, which aligns with findings from previous studies (Leclaire et al. 1988; Segura‐Egea et al. 2009; Murillo‐Benítez et al. 2020). Segura‐Egea et al. (2009) reported a lower prevalence of pain (46%), with most cases classified as mild in intensity.
Patient Satisfaction and Willingness to Choose Root Canal Treatment Again
4.3
Despite the high frequency of reported pain, most patients expressed satisfaction with their RCT. While most research has been conducted in controlled settings such as universities or specialist clinics (Gõrduysus and Gõrduysus 2000; Dugas et al. 2002; Gatten et al. 2011; Hamasha and Hatiwsh 2013), the present study supports previous findings that RCT performed in general dental practice can also result in high levels of satisfaction.
Although cost is often reported as a source of dissatisfaction in other studies (Dugas et al. 2002; Gatten et al. 2011; Hamasha and Hatiwsh 2013), it was not identified as a significant concern among patients in this cohort. Furthermore, satisfaction levels were consistent across tooth groups.
Most patients (77.0%) reported they would choose the same procedure again. Similar findings have been reported in previous studies, where patients generally preferred to retain their natural dentition whenever possible. Many also indicated that they would recommend the treatment or choose it again if needed (Lobb et al. 1996; Gõrduysus and Gõrduysus 2000; Gatten et al. 2011).
However, patients who registered moderate to severe pain, either during treatment or at follow‐up, were significantly less likely to choose RCT again. This was particularly evident for teeth registered as extracted compared to those that had been preserved and root filled. Additionally, lower satisfaction with aesthetic outcomes, chewing ability and treatment costs was associated with reduced retrospective acceptance of RCT.
Strengths and Limitations of the Study
4.4
The primary strength of this study lies in its real‐world prospective design, involving patients recruited from general dental clinics. This enhances the relevance and generalisability of the findings to everyday clinical practice. Additionally, the baseline set at the start of treatment and the long follow‐up period (7–9 years) provide insight into both tooth survival and patient‐reported outcomes, such as persistent pain, recollection of pain during treatment and treatment acceptance (Statens Beredning för medicinsk Utvärdering 2010; Duncan et al. 2023).
However, the study was set up within a particular context, involving 20 Public Dental Service clinics in one region in Sweden. The respondents were significantly older, potentially due to the postal distribution method (Table 2). A mixed‐mode approach might have improved participation rates among younger patients (Edwards et al. 2002). Nevertheless, the response rate of 72.2% is considered good for long‐term follow‐up studies in general dental practice (Edwards et al. 2002).
Recall bias is a potential limitation due to the long interval between baseline and follow‐up. However, extended follow‐up provides insights into long‐term satisfaction, which may be unobserved in short‐term evaluations. Although recall bias cannot be entirely excluded, it is less likely to affect persistent symptoms or major treatment events (Stull et al. 2009). Global assessments, such as overall satisfaction, are also less vulnerable to recall bias than symptom‐specific reports (Stull et al. 2009). To improve recall accuracy, the questionnaire included a tooth illustration to aid correct identification. The reliability of the questionnaire was evaluated in a previous study (Wigsten et al. 2021).
Furthermore, neither the patients nor the dentists in this study may be representative of RCTs in other settings, either within Sweden or internationally. Patient satisfaction is formed by expectations influenced by sociocultural and systemic factors, including healthcare structure, access to care and cultural norms (Sitzia and Wood 1997; Newsome and Wright 1999a; Newsome and Wright 1999b). These factors should be considered when interpreting the generalisability of the results to other contexts.
The ESE clinical guidelines emphasise the importance of preserving natural teeth in case of need of RCT, as this prevents or delays the demands of prosthetic replacements (Duncan et al. 2023). Nonetheless, decision‐making about a tooth requiring RCT should be made on an individual basis, weighing both clinical and patient‐related factors.
While most initiated RCTs in this study were completed and patient satisfaction was high, outcome assessment remains incomplete without clinical and radiographic evaluation of the periapical status. The relatively high frequency of extractions is concerning and highlights the need to compare molar RCT outcomes with alternative treatment options (Savolainen et al. 2025).
We recommend that future randomised controlled trials on RCT specifically investigate whether treatment outcomes differ significantly depending on whether the procedure is performed by general practitioners or by dental specialists, within a single cohort and under a standardised study design.
However, studies directly comparing RCT with alternative interventions for severely compromised teeth involving the pulp and periapical tissues are also needed. Ideally, such comparisons should also be conducted as randomised controlled trials, including both clinical and patient‐reported outcomes. Although randomisation may be challenging due to the complexity of the situation and individualised nature of treatment decisions.
Conclusions
5
Seven to nine years after the initiation of RCT in this general practice setting, patient satisfaction remains high, despite one‐third of the treated teeth being reported as extracted. These findings highlight the importance of incorporating patient‐reported outcomes in the evaluation of various dental procedures, including endodontic treatments.
Author Contributions
Emma Wigsten: conceptualization; data curation (lead); formal analysis; funding acquisition (lead); investigation (lead); methodology; project administration (lead); visualization; writing – original draft preparation (lead). Anita Afkhami and Hosaina Afewerki: investigation; visualization; writing – original draft preparation. Anna Levinsson: formal analysis (lead); validation; visualization; writing – review and editing. Thomas Kvist: conceptualization (lead); funding acquisition; methodology; supervision; writing – review and editing. All authors gave final approval and agreed to be accountable for all aspects of the work. The collaborators in EndoReCo have critically revised the manuscript.
Ethics Statement
This study was approved by the Regional Ethical Committee in Gothenburg, Sweden (Dnr: 817‐16). The research has been conducted in full accordance with ethical principles, including the World Medical Association Declaration of Helsinki (version 2008) and the requirements of Swedish law, under which the research has been conducted. All participating patients have received written and oral information about the study and have provided their verbal and written informed consent. The data do not contain any information that could identify the participants.
Conflicts of Interest
The authors declare no conflicts of interest.
The reference list from the paper itself. Each links out to its DOI / PubMed record.
- 1Atmeh, A. , and A. A. Hamasha . 2020. “Outcome Assessment of Non‐Surgical Root Canal Treatment by Patients: What Factors Can Influence Their Evaluation?” British Dental Journal 228, no. 10: 762–766.32444749 10.1038/s 41415-020-1528-4 · doi ↗ · pubmed ↗
- 2Bergenholtz, G. , and L. Spångberg . 2004. “Controversies in Endodontics.” Critical Reviews in Oral Biology & Medicine 15, no. 2: 99–114.15059945 10.1177/154411130401500204 · doi ↗ · pubmed ↗
- 3Bjørndal, L. , M. H. Laustsen , and C. Reit . 2006. “Root Canal Treatment in Denmark Is Most Often Carried out in Carious Vital Molar Teeth and Retreatments Are Rare.” International Endodontic Journal 39, no. 10: 785–790.16948664 10.1111/j.1365-2591.2006.01149.x · doi ↗ · pubmed ↗
- 4Dugas, N. N. , H. P. Lawrence , P. Teplitsky , and S. Friedman . 2002. “Quality of Life and Satisfaction Outcomes of Endodontic Treatment.” Journal of Endodontics 28, no. 12: 819–827.12489651 10.1097/00004770-200212000-00007 · doi ↗ · pubmed ↗
- 5Duncan, H. F. , L.‐L. Kirkevang , O. A. Peters , et al. 2023. “Treatment of Pulpal and Apical Disease: The European Society of Endodontology (ESE) S 3‐Level Clinical Practice Guideline.” International Endodontic Journal 56, no. Suppl 3: 238–295.37772327 10.1111/iej.13974 · doi ↗ · pubmed ↗
- 6Eckerbom, M. , L. Flygare , and T. Magnusson . 2007. “A 20‐Year Follow‐Up Study of Endodontic Variables and Apical Status in a Swedish Population.” International Endodontic Journal 40, no. 12: 940–948.17883402 10.1111/j.1365-2591.2007.01290.x · doi ↗ · pubmed ↗
- 7Edwards, P. , I. Roberts , M. Clarke , et al. 2002. “Increasing Response Rates to Postal Questionnaires: Systematic Review.” British Medical Journal 324, no. 7347: 1183.12016181 10.1136/bmj.324.7347.1183 PMC 111107 · doi ↗ · pubmed ↗
- 8El Karim, I. , H. F. Duncan , S. Cushley , et al. 2024. “An International Consensus Study to Identify “What” Outcomes Should Be Included in a Core Outcome Set for Endodontic Treatments (COSET) for Utilization in Clinical Practice and Research.” International Endodontic Journal 57, no. 3: 270–280.38314586 10.1111/iej.14008 · doi ↗ · pubmed ↗