Spatiotemporal evolution, regional disparity, and driving factors of county-level rice production carbon efficiency: A case study of Jiangxi Province, China
Beihe Wu, Jiangtao Gao, Yan Guo, Zhaojiu Chen

TL;DR
This study analyzes how efficiently rice is produced in terms of carbon emissions in Jiangxi Province, China, and identifies factors influencing regional differences.
Contribution
The study introduces a novel approach combining spatiotemporal analysis and driving factors to assess rice production carbon efficiency at the county level.
Findings
RCE shows a fluctuating upward trend with significant improvement potential.
A 'central-high, peripheral-low' spatial distribution pattern is observed with strong spatial autocorrelation.
Industrial and input-level factors jointly drive spatial differentiation in RCE.
Abstract
Accurately quantifying the carbon efficiency of rice production (RCE) and elucidating its spatiotemporal evolution, regional disparities, and driving factors hold significant theoretical and practical implications for advancing agricultural green transformation and achieving sustainable development. Utilizing panel data from 85 counties in Jiangxi Province, China (2012–2022), this study employs a super-efficiency slack-based measure (Super-SBM) model incorporating undesirable outputs to estimate RCE. Spatial visualization via ArcGIS, kernel density estimation, Theil index decomposition, and geographical detector are applied to explore spatiotemporal patterns, regional heterogeneity, and driving mechanisms. The findings reveal that: (1) RCE exhibits a fluctuating upward trend with dynamic convergence characteristics, yet substantial improvement potential remains relative to the optimal…
Genes, proteins, chemicals, diseases, species, mutations and cell lines named across the full text — each resolved to its canonical identifier and authoritative record.
Click any figure to enlarge with its caption.
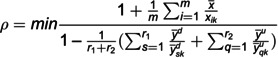 Figure 1
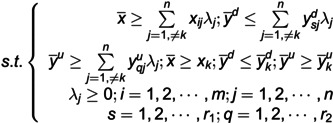 Figure 2
 Figure 3
 Figure 4
 Figure 5
 Figure 6
 Figure 7
 Figure 8
 Figure 9
 Figure 10
 Figure 11
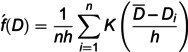 Figure 12
 Figure 13
 Figure 14
 Figure 15
 Figure 16
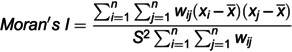 Figure 17
 Figure 18
 Figure 19
 Figure 20
 Figure 21
 Figure 22
 Figure 23
 Figure 24
 Figure 25
 Figure 26
 Figure 27
 Figure 28
 Figure 29
 Figure 30
 Figure 31
 Figure 32
 Figure 33
 Figure 34
 Figure 35
 Figure 36
 Figure 37
 Figure 38
 Figure 39
 Figure 40
 Figure 41
 Figure 42
 Figure 43
 Figure 44
 Figure 45
 Figure 46
 Figure 47
 Figure 48
 Figure 49
 Figure 50
Peer Reviews
No public reviews on file for this paper yet. If you reviewed it on a platform where reviews are public (OpenReview, ICLR, NeurIPS, ICML), you can paste yours below so the community can read it here.
Videos
No videos yet. Explain this paper in a talk, walkthrough, or lecture? Add one.
Taxonomy
TopicsEfficiency Analysis Using DEA · Land Use and Ecosystem Services · Agriculture Sustainability and Environmental Impact