Spatiotemporal prediction of obesity rates and model interpretability analysis from a public health perspective
Weiyan Tan, Bing Geng, XiuGuang Bai

TL;DR
This paper introduces a new Transformer model for predicting obesity rates, combining time and health data with spatial constraints to improve accuracy and provide interpretable insights for public health.
Contribution
The novel integration of temporal embeddings with spatially-constrained feature dependencies in a Transformer model for obesity prediction.
Findings
The proposed model outperforms existing models like LSTM and Mamba in predicting obesity rates across multiple states.
SHAP analysis reveals interpretable feature contributions, aiding in evidence-based public health resource allocation.
Abstract
This study, focusing on the assessment of obesity prevalence trends in public health management, proposes an improved Transformer model that integrates temporal embeddings with spatially-constrained feature dependencies rather than purely geographic adjacency. Using state-level data from the CDC BRFSS, the method first performs joint temporal–health encoding (JTH) of obesity prevalence time series and health indicators. It then incorporates temporal decay and a learnable spatial constraint matrix (STA) into the attention mechanism, while employing dual-branch consistency training to enhance stability and generalization. We conducted comparative and ablation experiments on ten states, including Alaska and Alabama, and carried out independent validation on unseen states such as Guam and Idaho. The results show that the proposed approach outperforms representative models including MLP,…
Genes, proteins, chemicals, diseases, species, mutations and cell lines named across the full text — each resolved to its canonical identifier and authoritative record.
Click any figure to enlarge with its caption.
 Figure 1
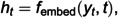 Figure 2
 Figure 3
 Figure 4
 Figure 5
 Figure 6
 Figure 7
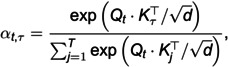 Figure 8
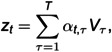 Figure 9
 Figure 10
 Figure 11
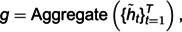 Figure 12
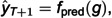 Figure 13
 Figure 14
 Figure 15
 Figure 16
 Figure 17
 Figure 18
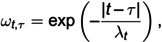 Figure 19
 Figure 20
 Figure 21
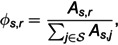 Figure 22
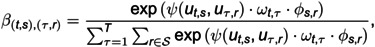 Figure 23
 Figure 24
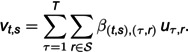 Figure 25
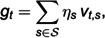 Figure 26
 Figure 27
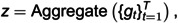 Figure 28
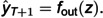 Figure 29
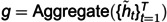 Figure 30
 Figure 31
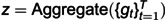 Figure 32
 Figure 33
 Figure 34
 Figure 35
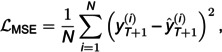 Figure 36
 Figure 37
 Figure 38
 Figure 39
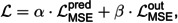 Figure 40
 Figure 41
 Figure 42
 Figure 43
 Figure 44
 Figure 45
 Figure 46
 Figure 47
 Figure 48
 Figure 49
 Figure 50
Peer Reviews
No public reviews on file for this paper yet. If you reviewed it on a platform where reviews are public (OpenReview, ICLR, NeurIPS, ICML), you can paste yours below so the community can read it here.
Videos
No videos yet. Explain this paper in a talk, walkthrough, or lecture? Add one.
Taxonomy
TopicsMachine Learning in Healthcare · Chronic Disease Management Strategies · Time Series Analysis and Forecasting