Unveiling complex patterns: An information-theoretic approach to high-order behaviors in microarray data
Antonio Lacalamita, Alfonso Monaco, Grazia Serino, Daniele Marinazzo, Nicola Amoroso, Loredana Bellantuono, Marianna La Rocca, Tommaso Maggipinto, Ester Pantaleo, Emanuele Piccinno, Viviana Scalavino, Sabina Tangaro, Gianluigi Giannelli, Sebastiano Stramaglia, Roberto Bellotti

TL;DR
This paper uses an information-theoretic method to uncover complex gene interactions in microarray data from HCC and ASD patients.
Contribution
The novel application of partial information decomposition (PID) reveals higher-order gene behaviors not captured by traditional methods.
Findings
PID identifies differential genes and enriched functions linked to disease phenotypes.
Synergy clusters reveal higher-order behaviors not detected by classical correlation methods.
Abstract
The information-theoretic approach can shed light on the role of groups of correlated elements within a network. While there are already established methods for measuring new information, storage and transmission, the definition and application of methods for measuring information change remains an unresolved challenge. The change of information in a network is associated with redundancy and synergy between systems that share information about a target. Redundancy involves shared information about the target that can be retrieved using the individual source systems, while synergy involves information that can only be obtained by sharing the systems. A more refined approach, called partial information decomposition (PID), separates the unique, redundant and synergetic contributions of the shared information. However, these contributions cannot be directly derived from the classical…
Genes, proteins, chemicals, diseases, species, mutations and cell lines named across the full text — each resolved to its canonical identifier and authoritative record.
Click any figure to enlarge with its caption.
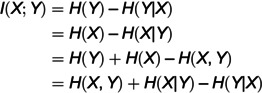 Figure 1
 Figure 2
 Figure 3
 Figure 4
 Figure 5
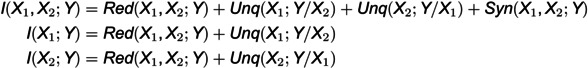 Figure 6
 Figure 7
 Figure 8
 Figure 9
 Figure 10
 Figure 11
 Figure 12
 Figure 13
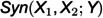 Figure 14
 Figure 15
 Figure 16
 Figure 17
 Figure 18
 Figure 19
 Figure 20
 Figure 21
 Figure 22
 Figure 23
 Figure 24
 Figure 25
 Figure 26
 Figure 27
 Figure 28
 Figure 29
 Figure 30
 Figure 31
 Figure 32
 Figure 33
 Figure 34
 Figure 35
 Figure 36
 Figure 37
 Figure 38
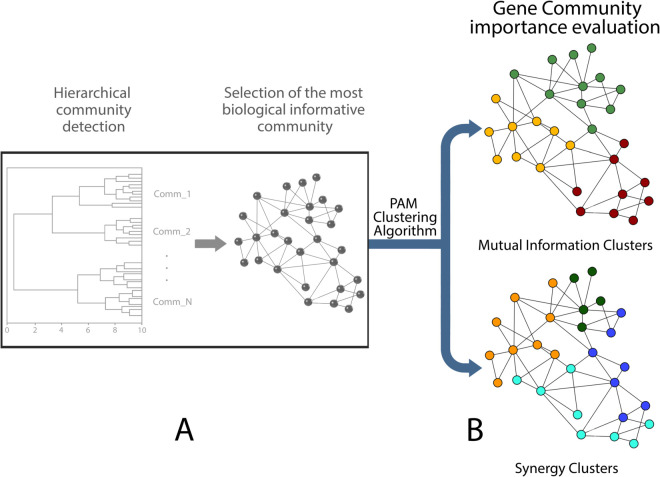 Figure 39
 Figure 40
 Figure 41
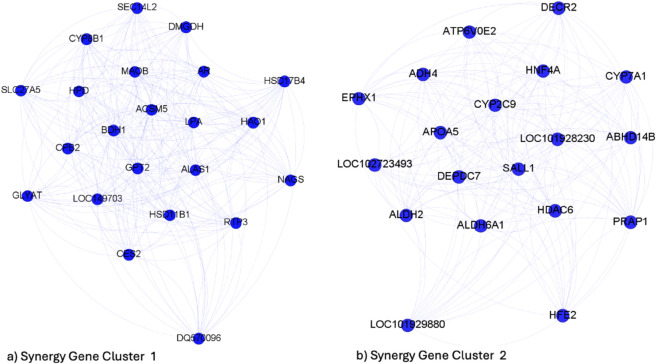 Figure 42
 Figure 43
 Figure 44
 Figure 45
 Figure 46
 Figure 47
 Figure 48
 Figure 49
 Figure 50
Peer Reviews
No public reviews on file for this paper yet. If you reviewed it on a platform where reviews are public (OpenReview, ICLR, NeurIPS, ICML), you can paste yours below so the community can read it here.
Videos
No videos yet. Explain this paper in a talk, walkthrough, or lecture? Add one.
Taxonomy
TopicsGene expression and cancer classification · Bioinformatics and Genomic Networks · Gene Regulatory Network Analysis