16S rRNA amplicon sequencing of seamount sediment microbial communities in South China Sea
Haizhou Li, Huaiyang Zhou

TL;DR
This study explores microbial diversity in deep-sea seamount sediments of the South China Sea using 16S rRNA sequencing.
Contribution
The paper provides new insights into microbial communities in deep-sea seamount sediments through amplicon sequencing.
Findings
Microbial diversity was assessed across 10 sediment stations in the South China Sea.
16S rRNA gene amplicon sequencing revealed distinct microbial community structures in seamount sediments.
Abstract
Information about the microbiota in deep-sea seamount sediments is important because the microbiota and their activities in sediments affect deep-sea ecosystems. To evaluate deep-sea seamount microbial diversity, we performed 16S rRNA gene amplicon sequencing on sediment samples from 10 stations in the South China Sea.
Genes, proteins, chemicals, diseases, species, mutations and cell lines named across the full text — each resolved to its canonical identifier and authoritative record.
Click any figure to enlarge with its caption.
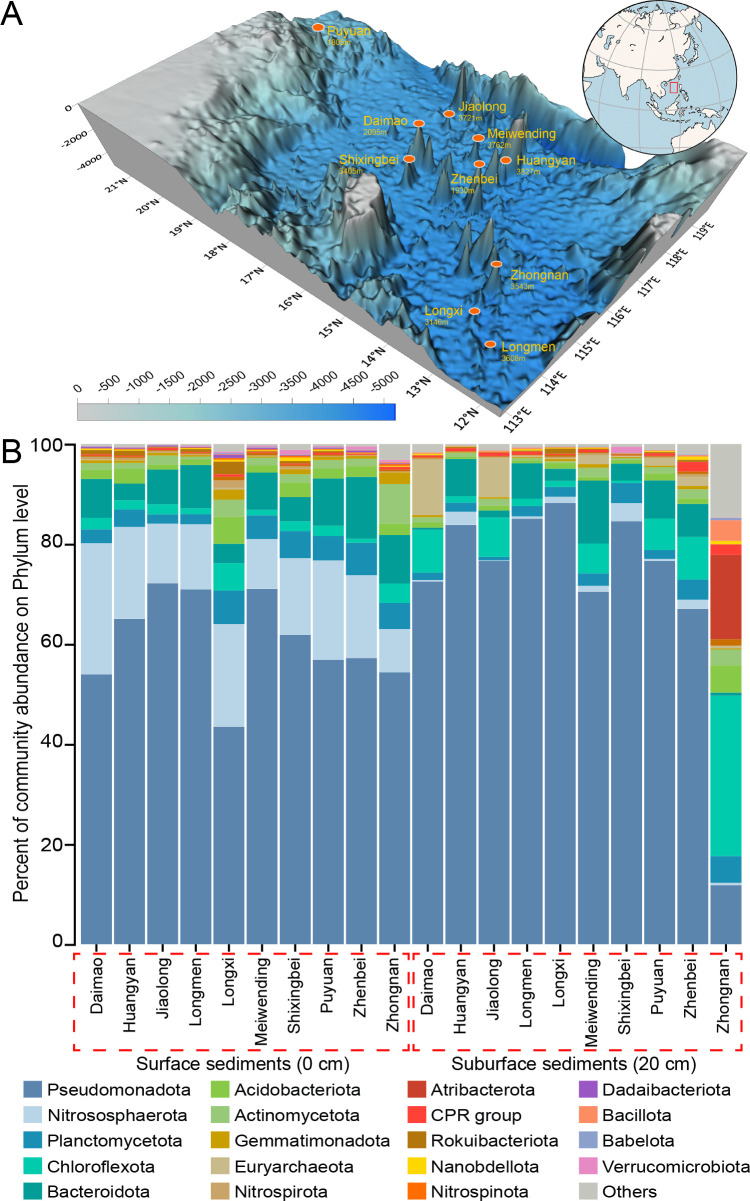 Fig 1
Fig 1| Sample | Latitude | Longitude | Water depth (m) | No. of raw sequencing read | NCBI SRA accession no | |
|---|---|---|---|---|---|---|
| Daimao | 17°38.1296′N | 117°6.4345′E | 2,095 m | Surface | 70,869 |
|
| Subsurface | 56,927 |
| ||||
| Huangyan | 15°17.2723′N | 117°32.9357′E | 3,827 m | Surface | 50,316 |
|
| Subsurface | 72,279 |
| ||||
| Jiaolong | 17°32.181′N | 117°44.3618′E | 3,721 m | Surface | 62,229 |
|
| Subsurface | 69,500 |
| ||||
| Longmen | 12°31.5517′N | 113°41.534′E | 3,608 m | Surface | 63,288 |
|
| Subsurface | 72,272 |
| ||||
| Longxi | 13°7.6202′N | 114°28.7122′E | 3,146 m | Surface | 71,703 |
|
| Subsurface | 44,547 |
| ||||
| Meiwending | 16°53.1704′N | 118°0.4547′E | 3,762 m | Surface | 56,617 |
|
| Subsurface | 50,194 |
| ||||
| Shixingbei | 16°34.9017′N | 116°24.0945′E | 3,405 m | Surface | 69,486 |
|
| Subsurface | 61,067 |
| ||||
| Puyuan | 21°8.0308′N | 119°12.4658′E | 1,805 m | Surface | 56,984 |
|
| Subsurface | 71,331 |
| ||||
| Zhenbei | 14°59.8583′N | 116°30.3167E | 1,930 m | Surface | 73,924 |
|
| Subsurface | 69,319 |
| ||||
| Zhongnan | 13°53.1921′N | 115°19.8736′E | 3,543 m | Surface | 44,458 |
|
| Subsurface | 71,686 |
| ||||
- —National Natural Science Foundation of Chinahttp://dx.doi.org/10.13039/501100001809
- —Central Public-interest Scientific Institution Basal Research Fund, Chinese Academy of Fishery Scienceshttp://dx.doi.org/10.13039/501100012428
- —National Natural Science Foundation of Chinahttp://dx.doi.org/10.13039/501100001809
Peer Reviews
No public reviews on file for this paper yet. If you reviewed it on a platform where reviews are public (OpenReview, ICLR, NeurIPS, ICML), you can paste yours below so the community can read it here.
Videos
No videos yet. Explain this paper in a talk, walkthrough, or lecture? Add one.
Taxonomy
TopicsMicrobial Community Ecology and Physiology · Methane Hydrates and Related Phenomena · Genomics and Phylogenetic Studies
ANNOUNCEMENT
Although there are approximately 25 million seamounts in the ocean, surprisingly little is known about seamount microbial ecology (1, 2). The South China Sea (SCS) is the world’s largest semi-enclosed sea, which has a unique landscape with numerous basaltic seamounts in its basin (3). During the R/V Tan Kah Kee 1083 expedition (April to May 2018) in the SCS, the remotely operated platform for ocean science (ROPOS) was used to collect seamount sediment samples with a manipulated push corer on the summit of 10 seamounts (Fig. 1, Table 1). In this study, 16S rRNA gene amplicon sequencing was used to explore the diversity of microbial communities in SCS seamount sediment samples.
(A) Location of the South China Sea seamounts. The map shows the 10 seamount sampling locations and the bathymetry of the study area. This figure is reproduced from reference 2. (B) Column chart showing the relative abundance of the top 20 microbial phyla at each sampling station.
The inner part of the push corer samples was collected to reduce contamination from the sampling process. The samples were stored at −80°C immediately after sampling. Surface sediments and subsurface (20 cm in depth) were used for amplicon sequencing following the Earth Microbiome Project (EMP) protocol (4). Total DNA was extracted using the E.Z.N.A. Soil DNA kit (Omega Bio-tek, Norcross, GA, USA). The 16S rRNA gene was amplified by PCR using universal bacterial and archaeal primers 515F and 806R (FWD: GTGYCAGCMGCCGCGGTAA; REV: GGACTACNVGGGGTWTCTAAT) (5). Each sample was amplified in triplicate in a 50 µL reaction under the following conditions: 30 cycles of denaturation at 94°C for 30 s, annealing at 55°C for 30 s, and extension at 72°C for 30 s, with a final extension at 72°C for 10 min. PCR products from each sample were pooled and purified using a QIAquick PCR Purification Kit (Qiagen) and quantified using a NanoDrop 1000 spectrophotometer (Thermo Scientific, USA). Purified amplicons were pooled in equimolar amounts and paired-end sequenced (2 × 300 bp) on an Illumina MiSeq platform (Illumina, San Diego, CA, USA) (6). Raw fastq files were demultiplexed, quality filtered by Trimmomatic (v.0.39) (7), and merged by FLASH (v.1.2.11) (8). Operational taxonomic units (OTUs) were clustered with a 97% similarity cutoff using UPARSE (v.7.1) (9). Chimeric sequences were identified and removed using UCHIME (v.4.2) (10). Taxonomic assignments were performed using the SILVA database (v.138) (11). Default parameters were used except where otherwise noted.
A total of 6,391,730 16S rRNA gene amplicon sequences were generated and clustered into 16,051 OTUs. Here, we clustered merged reads into OTUs rather than inferring amplicon sequence variants to maintain compatibility with widely used EMP-style data sets. A range of 372 to 5,106 Chao1 OTUs and a Shannon index of 2.38 to 6.06 were observed in all the seamount systems. Eighty-eight microbial phyla and 1,453 genera were identified in the seamount samples. Pseudomonadota, Chloroflexota, and Actinomycetota were the most commonly identified phyla in all the sediment samples, and their total relative abundance accounted for approximately 63.84% (Fig. 1). The data in this study provide important information about the seamount microbial communities in deep-sea environments.
The reference list from the paper itself. Each links out to its DOI / PubMed record.
- 1Emerson D, Moyer CL. 2010. Microbiology of seamounts: common patterns observed in community structure. Oceanog 23:148–163. doi:10.5670/oceanog.2010.67 · doi ↗
- 2Li H, Zhou H, Yang S, Dai X. 2023. Stochastic and deterministic assembly processes in seamount microbial communities. Appl Environ Microbiol 89:e 0070123. doi:10.1128/aem.00701-2337404136 PMC 10370332 · doi ↗ · pubmed ↗
- 3Yu X, Xue C, Shi H, Zhu W, Liu Y, Yin H. 2017. Expansion of the South China Sea basin: constraints from magnetic anomaly stripes, sea floor topography, satellite gravity and submarine geothermics. Geosci Front 8:151–162. doi:10.1016/j.gsf.2015.12.008 · doi ↗
- 4Hoshino T, Doi H, Uramoto G-I, Wörmer L, Adhikari RR, Xiao N, Morono Y, D’Hondt S, Hinrichs K-U, Inagaki F. 2020. Global diversity of microbial communities in marine sediment. Proc Natl Acad Sci USA 117:27587–27597. doi:10.1073/pnas.191913911733077589 PMC 7959581 · doi ↗ · pubmed ↗
- 5Caporaso JG, Lauber CL, Walters WA, Berg-Lyons D, Lozupone CA, Turnbaugh PJ, Fierer N, Knight R. 2011. Global patterns of 16S r RNA diversity at a depth of millions of sequences per sample. Proc Natl Acad Sci USA 108:4516–4522. doi:10.1073/pnas.100008010720534432 PMC 3063599 · doi ↗ · pubmed ↗
- 6Caporaso JG, Lauber CL, Walters WA, Berg-Lyons D, Huntley J, Fierer N, Owens SM, Betley J, Fraser L, Bauer M, Gormley N, Gilbert JA, Smith G, Knight R. 2012. Ultra-high-throughput microbial community analysis on the Illumina Hi Seq and Mi Seq platforms. ISME J 6:1621–1624. doi:10.1038/ismej.2012.822402401 PMC 3400413 · doi ↗ · pubmed ↗
- 7Bolger AM, Lohse M, Usadel B. 2014. Trimmomatic: a flexible trimmer for Illumina sequence data. Bioinformatics 30:2114–2120. doi:10.1093/bioinformatics/btu 17024695404 PMC 4103590 · doi ↗ · pubmed ↗
- 8Magoč T, Salzberg SL. 2011. FLASH: fast length adjustment of short reads to improve genome assemblies. Bioinformatics 27:2957–2963. doi:10.1093/bioinformatics/btr 50721903629 PMC 3198573 · doi ↗ · pubmed ↗