Radiomics analysis of pericoronary adipose tissue for detecting ischaemia with non-obstructive coronary arteries in NAFLD patients
Lingli Wang, Hongming Luo, Yuanbo Xiong, Kaixiang Su, Siyu Jiang, Guangju Zhou, Rui Li

TL;DR
This study shows that radiomics analysis of pericoronary fat improves detection of heart issues in NAFLD patients with non-blocked arteries.
Contribution
A novel radiomics model combining imaging and clinical data improves INOCA detection in NAFLD patients.
Findings
The radiomics model outperformed PCATa in identifying INOCA in both training and validation cohorts.
The combined imaging-clinical model achieved the highest diagnostic accuracy with AUCs of 0.873 and 0.824.
The model showed improved reclassification and decision-making metrics over clinical-only models.
Abstract
Chronic low-grade inflammation in nonalcoholic fatty liver disease (NAFLD) plays a critical role in the development of cardiovascular complications, particularly ischaemia with non-obstructive coronary arteries (INOCA). This study aimed to develop and evaluate models combining pericoronary adipose tissue (PCAT) radiomics, PCAT attenuation (PCATa), CCTA plaque parameters, and clinical risk factors to identify INOCA in NAFLD patients. This retrospective study included 159 patients with NAFLD who underwent CCTA. The patients were randomly divided into the training (70%) and validation (30%) cohorts. Clinical features, CCTA imaging indicators, and right coronary artery PCAT radiomic features were analyzed. Five models were constructed using logistic regression: Model 1 (PCATa model), Model 2 (radiomics model), Model 3 (clinical factors model), Model 4 (combined imaging model), and Model 5…
Genes, proteins, chemicals, diseases, species, mutations and cell lines named across the full text — each resolved to its canonical identifier and authoritative record.
Click any figure to enlarge with its caption.
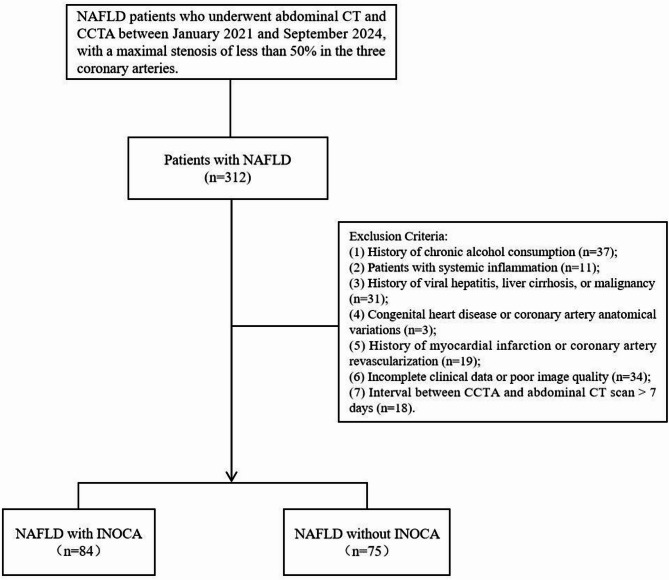 Figure 1
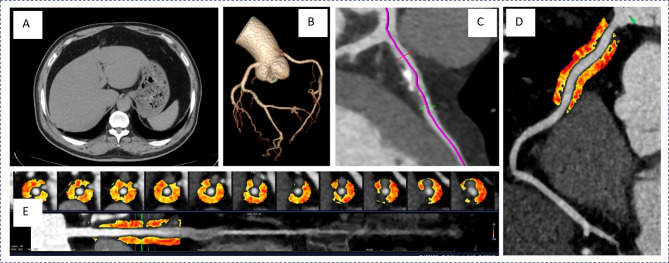 Figure 2
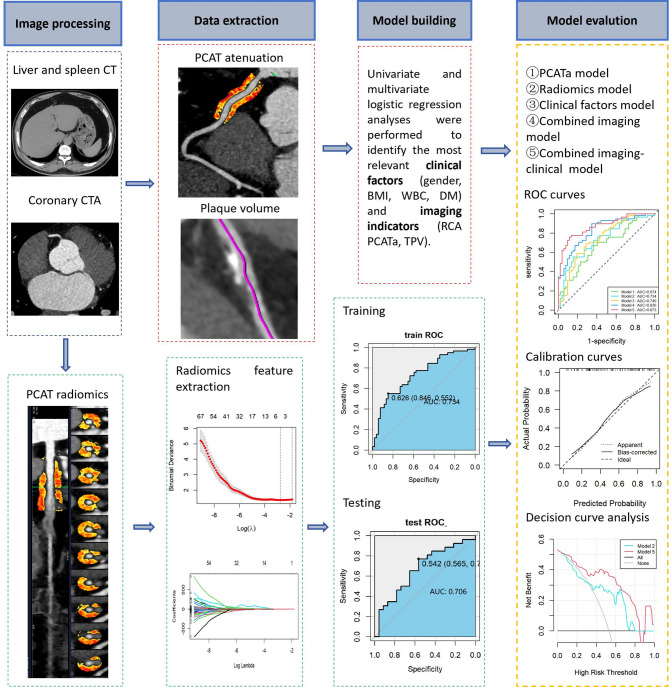 Figure 3
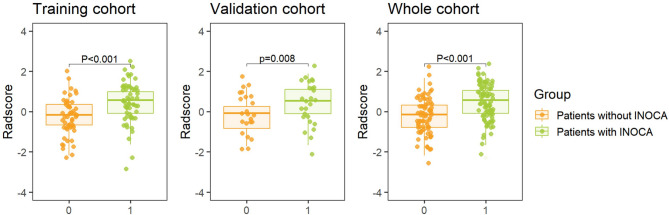 Figure 4
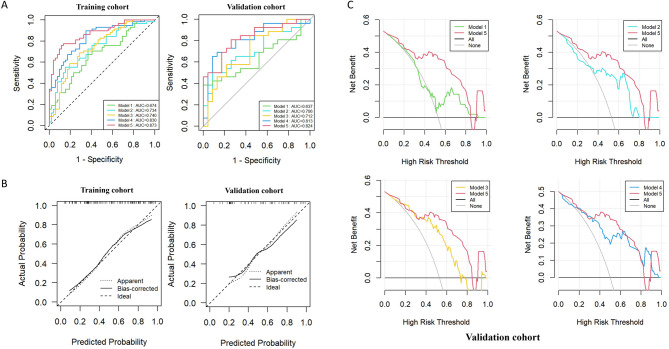 Figure 5
- —the 23rd Batch of Student Scientific Research Project Approval of Jiangsu University
- —the Health Commission of the Sichuan Province Medical Science and Technology Program
- —the Sichuan Province Science and Technology Support Program
Peer Reviews
No public reviews on file for this paper yet. If you reviewed it on a platform where reviews are public (OpenReview, ICLR, NeurIPS, ICML), you can paste yours below so the community can read it here.
Videos
No videos yet. Explain this paper in a talk, walkthrough, or lecture? Add one.
Taxonomy
TopicsCardiovascular Disease and Adiposity · Adipokines, Inflammation, and Metabolic Diseases · Adipose Tissue and Metabolism
Background
Nonalcoholic fatty liver disease (NAFLD), the most prevalent chronic liver disease worldwide, has been reported in a recent systematic review to have an Asian prevalence of approximately 29.62%, with an annual increasing trend over time [1]. In addition to hepatic manifestations, NAFLD is closely associated with various extrahepatic complications, particularly cardiovascular diseases. Studies have shown that cardiovascular diseases have become the leading cause of mortality in patients with NAFLD [2, 3]. Notably, even with effective control of traditional cardiovascular risk factors, the incidence of coronary artery disease (CAD) remains significantly elevated, particularly with non-obstructive CAD being more prominent in this population [4]. Non-obstructive CAD, typically defined as coronary artery stenosis of less than 50%, has complex pathophysiological mechanisms involving inflammation, plaque vulnerability, and microvascular dysfunction [5]. Despite the absence of significant coronary stenosis on coronary computed tomography angiography (CCTA), some patients exhibit symptoms of myocardial ischemia, a condition referred to as ischemia with non-obstructive coronary arteries (INOCA) [6]. This condition has gained increasing recognition in recent years as a substantial contributor to adverse cardiovascular outcomes and mortality [7]. Therefore, developing novel diagnostic models to improve the early detection of INOCA in NAFLD patients is crucial for the proactive prevention and management of CAD progression.
Recent studies have revealed that in NAFLD, because of prolonged exposure to chronic low-grade inflammation [8], inflammatory mediators that can induce coronary artery inflammatory response are released. This inflammation may be closely associated with the onset and progression of adverse cardiovascular outcomes [9]. When coronary arteries become inflamed, inflammatory factors diffuse outward from the intima, altering the adjacent pericoronary adipose tissue (PCAT) [10, 11], leading to changes in PCAT attenuation (PCATa) and volume, reported by several studies that patients with NAFLD usually exhibit higher PCATa [12]. CCTA effectively evaluates the degree of coronary artery stenosis and plaque parameters [13], offering quantitative insights into PCAT changes and aiding in the identification of underlying vascular inflammation and disease activity. However, vascular inflammation can further induce irreversible changes in adipose tissue structure, such as microvascular remodeling and fibrosis [14–16], which cannot be captured by measuring PCAT alone. In contrast, PCAT radiomics analysis based on CCTA can identify microstructural features and persistent changes in the perivascular space caused by inflammation, offering valuable insights beyond PCATa [17]. Therefore, integrating CCTA with radiomics to analyze PCAT characteristics in patients with NAFLD may help identify high-risk individuals for non-obstructive CAD and provide a basis for early intervention.
Although previous studies have established a strong association between PCAT inflammation and the development of CAD, research on the radiomic characteristics of PCAT in patients with NAFLD remains limited. In particular, the use of radiomics to extract quantitative PCAT features from CCTA images and integrate them into the diagnosis of INOCA has not been extensively explored. Therefore, this study developed a comprehensive model integrating clinical data, CCTA imaging parameters, and PCAT radiomic features to identify risk factors associated with INOCA in NAFLD patients. By focusing on coronary inflammation and plaque characteristics, this approach aims to improve the early diagnosis of INOCA in patients with NAFLD and to provide an imaging-based reference for identifying high-risk patients with non-obstructive CAD, thereby enabling timely clinical intervention and management.
Method
Study population
This study was conducted in accordance with the Declaration of Helsinki and was approved by the Ethics Committee of the Affiliated Hospital of North Sichuan Medical College (No. 2024ER39-1). The requirement for informed consent was waived due to the retrospective nature of the study. This retrospective study examined NAFLD patients who underwent CCTA at our institution between January 2021 and September 2024. Inclusion criteria: (1) Patients who underwent CCTA, with maximal stenosis of less than 50% in the three major coronary arteries. (2) Patients with a prior diagnosis of NAFLD and those newly diagnosed during their visit, defined as individuals who underwent non-contrast-enhanced abdominal CT within 3 days before or after CCTA and had a clinically confirmed diagnosis of NAFLD [18]. Exclusion criteria: (1) history of moderate to excessive alcohol consumption; (2) systemic inflammatory diseases; (3) history of viral hepatitis, liver cirrhosis, or malignancies; (4) congenital heart disease or coronary artery anatomical variations; (5) history of myocardial infarction or coronary revascularization; (6) incomplete clinical data or poor image quality; (7) interval between coronary CTA and abdominal CT scan >7 days. Ultimately, 159 patients with NAFLD were recruited in the study, of whom 84 were clinically diagnosed with INOCA, whereas the remaining 75 did not have CAD. A separate group of 166 patients without NAFLD was selected as the control group to ensure comparability with the NAFLD group in terms of age, sex, cardiovascular risk factors, and CCTA acquisition parameters. Figure 1 presents the study design workflow.
Fig. 1. Flow chart showing the selection process for the study population. CCTA, coronary computed tomography angiography; INOCA, ischaemia with non-obstructive coronary arteries; NAFLD, nonalcoholic fatty liver disease
Identification of INOCA in patients
Accurate diagnosis of INOCA has traditionally required both structural coronary angiography to exclude obstructive coronary artery disease and functional coronary angiography to evaluate underlying pathophysiological mechanisms [19, 20]. However, despite the ability of functional coronary angiography to identify the key physiological mechanisms responsible for ischemic chest pain in INOCA patients, only a minority of patients with chest pain and non-obstructive CAD currently undergo such evaluation. Therefore, following previously described methodologies and a review published in the BMJ, it is recommended that once non-cardiac and non-ischemic causes of chest pain have been excluded, the diagnosis of INOCA should be considered in patients with evidence of myocardial ischemia—even if the underlying mechanism is not definitively established [20, 21]. The diagnostic criteria primarily include the following: typical angina symptoms (which may occur during exertion, stress, or at rest); ischemic changes on electrocardiography; stress-induced myocardial perfusion defects or regional wall motion abnormalities; and impaired coronary flow reserve. If any of these indicators of myocardial ischemia are present and the degree of coronary artery stenosis is less than 50%, a diagnosis of INOCA can be considered.
CT assessment of NAFLD
The evaluation of NAFLD was performed by measuring the CT attenuation values of the liver and spleen on non-contrast CT imaging. Circular regions of interest, each covering at least 2 × 2 cm, were selected on three cross-sectional slices of the liver and spleen [22]. The average Hounsfield unit (HU) values were recorded, and the liver-to-spleen attenuation ratio was calculated, with a ratio of < 1.0 serving as the diagnostic threshold for fatty liver [23] (Fig. 2A). The cases were identified as NAFLD after excluding other potential causes of hepatic steatosis. Two radiologists independently performed the measurements, and in instances of significant discrepancies, a third experienced radiologist reviewed the images to provide the final determination.
Fig. 2. Illustration of Abdominal CT and CCTA Measurement Parameters in a Typical Patient. A Abdominal CT scan confirming NAFLD diagnosis through liver and spleen measurements. B Reconstructed coronary artery bundle from CCTA. C Coronary Artery Plaque Measurement Diagram. D Diagram illustrating PCAT parameter measurements for the proximal 40-mm segment of coronary arteries. E Regions of interest for radiomic analysis and the proximal slice of PCAT under direct visualization. CCTA, coronary computed tomography angiography; PCAT, pericoronary adipose tissue; NAFLD, non-alcoholic fatty liver disease
CCTA acquisition
All CCTA scans were performed using a third-generation dual-source CT scanner (Somatom Force; Siemens Healthineers, Germany). The patients underwent pre-scan preparation, including heart rate control and breathing exercises. For those with a heart rate exceeding 80 bpm, metoprolol (25–100 mg) was administered to reduce the heart rate below 80 bpm. After achieving the target heart rate and confirming that there were no contraindications for CCTA, the patients were positioned supine, and electrodes were placed on the left anterior chest for ECG gating. The ECG signal was calibrated to ensure clear R-wave visibility for accurate scan synchronization. The patients were positioned in a supine head-first orientation, and scanning was performed using prospective ECG-triggered acquisition during the end-expiratory breath-hold. The scan parameters were as follows: rotation time = 280 ms, trigger window covering 35%–75% of the R-R interval, collimation = 256 × 0.625 mm, reconstructed slice thickness = 0.625 mm, and reconstruction interval = 0.5 mm. The tube potential (70–120 kV) was adjusted based on the patient’s body size and clinical needs, with automatic exposure control, thereby optimizing the balance between image quality and radiation dose. Images were reconstructed using smooth kernel (STANDARD) and iterative reconstruction techniques (50% strength, ASiR-V, GE Healthcare). Diastolic-phase images were used for CCTA analysis to ensure precision and clarity.
CCTA imaging parameters
The CCTA plasmon parameters were transferred to a Shukun workstation (Shukun Technology Co., Ltd, Beijing, China) for evaluation. The CCTA data were consistently analyzed by two experienced radiologists using the CAD Reporting and Data System. Each coronary segment was assessed, and segments with a diameter < 2 mm, severe motion artifacts, or low contrast resolution were excluded from further analysis. The software automatically generated scan-specific threshold values for plaque composition. An adaptive algorithm was used to quantify plaque components within manually designated regions. The location, volume, total plaque volume(TPV), and diameter stenosis(DS) severity of the three major coronary arteries were recorded. In this study, the most severe diameter stenosis (DS_max_) among the three coronary arteries was selected for analysis. Each plaque component was automatically identified and quantified by the software, with manual adjustments made as necessary (Fig. 2 B and C).
PCAT measurements were performed for all participants using CoronaryDoc (version 6.21; Shukun Technology Co., Ltd, Beijing, China). PCATa was defined as the mean CT attenuation of adipose tissue within a radial distance equivalent to the diameter of the target vessel, measured from the outer vessel wall. The software automatically tracked the proximal 40-mm segments of the three coronary arteries, including the right coronary artery (RCA), left anterior descending artery (LAD), and left circumflex artery (LCX), during the diastolic phase. Only voxels with attenuation values between − 190 and − 30 HU were analyzed [24, 25] (Fig. 2 D). The PCAT volumes of the proximal 40-mm segments of all three coronary arteries were recorded. To account for the effects of tube voltage on PCATa, the HU values were corrected for each tube voltage setting (70 kV, 80 kV, 90 kV, 100 kV, and 110 kV) by dividing them by the corresponding coefficients, as previously reported [26]. The corrected PCATa values were then used in subsequent analyses.
Furthermore, radiomic features were automatically extracted from the PCAT using the CoronaryDoc (version 6.21; Shukun Technology Co., Ltd, Beijing, China), as previously described (Fig. 2 E). The designated cross-sectional area for analysis adhered to the previously established standards for measuring PCATa [24]. All preprocessing procedures, including voxel resampling, intensity normalization, and gray-level discretization, were performed according to the software’s standardized radiomics pipeline. In total, ninety-five radiomic features were subsequently extracted from each PCAT using CoronaryDoc, including morphological, first-order histogram, and higher-order texture features, thereby providing a comprehensive characterization of the PCAT for analysis.
Feature selection and prediction model development
The 95 radiomic features were first standardized using z-score normalization. The dataset was randomly divided into training and validation cohorts at a ratio of 7:3. Feature selection was performed in a stepwise manner: features with significant differences between groups were first identified using univariate testing (t-test or Mann–Whitney U, p < 0.05), and highly correlated features (Spearman |ρ| >0.90) were removed to reduce redundancy. The least absolute shrinkage and selection operator (LASSO) logistic regression with tenfold cross-validation was then applied to the remaining features to determine the optimal λ value and avoid overfitting. This process yielded two radiomic features with nonzero coefficients (Cluster Prominence and Low Gray Level Run Emphasis), which were used for model fitting and Rad-score calculation (Supplementary Table S3). The radiomic features were further incorporated into other models to construct a combined predictive model. In parallel, univariate logistic regression identified four clinical factors and two imaging indices, which were integrated with the radiomics signature to develop the final combined model. Five generalized logistic regression models were developed, and their performance in differentiating patients with NAFLD and INOCA from those without CAD was evaluated: Model 1: PCATa; Model 2: radiomics; Model 3: clinical factors; Model 4: combined imaging indicators; and Model 5: combined imaging-clinical model. Figure 3 presents the study workflow.
Fig. 3. Flowchart illustrating the development of the integrated radiomics-based model. CT, computed tomography; CTA, computed tomography angiography; PCATa, pericardial adipose tissue attenuation; RCA, right coronary artery; AUC, area under curve; BMI, body mass index; WBC, white blood cell count; DM, diabetes mellitus
Statistical analysis
All statistical analyses were performed using Statistical Package for the Social Sciences (version 26.0; Armonk, NY, USA) and R Studio (version 4.3.3). Continuous variables are expressed as means ± standard deviations or medians (interquartile ranges [IQRs], Q25–75), whereas categorical variables are presented as percentages. Continuous variables were compared using independent Student’s t-test or the Mann–Whitney U test. The chi-square test was used to compare categorical variables. P-values < 0.05 were used to denote statistical significance. Univariate and multivariate logistic regression analyses were performed to identify the independent factors influencing CAD in patients with NAFLD. The performance of the five predictive models was assessed for discrimination, calibration, and clinical utility. Receiver operating characteristic (ROC) curve analysis was performed to evaluate the diagnostic efficacy of the models, and area under the ROC curve (AUC) values were compared using the DeLong test. The reclassification performance was analyzed using the integrated discrimination improvement (IDI) and net reclassification improvement (NRI) indices. Calibration curves were used to compare the predicted probabilities with the observed outcomes for the combined clinical-imaging model in the training and validation cohorts. Decision curve analysis (DCA) was performed to quantify the clinical utility of the models by measuring the net benefit across different threshold probabilities.
Result
Baseline characteristics
This study included 159 patients with NAFLD and 166 patients without NAFLD. Table 1 presents the baseline characteristics of the patients. The NAFLD group had a mean age of 63.04 ± 11.44 years, with 66.67% of the patients being male. The NAFLD group exhibited significantly higher TC, TG, LDL, ALT, BMI, and WBC levels and lower HDL levels than the non-NAFLD group (all p < 0.05). The NAFLD group was further divided into two subgroups according to the presence of INOCA. The INOCA group was more likely to be male (p < 0.001), had a higher prevalence of diabetes mellitus (p = 0.007), exhibited higher BMI (p = 0.011) and ALT levels (p < 0.001), and had higher levels of inflammatory markers, such as WBC, NLR, and PLR than the non-INOCA group (all p < 0.05). Interestingly, TC levels were lower in the INOCA group than in the non-INOCA group (p = 0.002).
Table 1. Comparison of baseline characteristics among groupsNon-NAFLDN = 166NAFLDN = 159P valueNAFLD without INOCAN = 75NAFLD with INOCAN = 84P valueClinical characteristics Age(y)63.80 ± 6.9263.04 ± 11.440.47061.89 ± 11.2464.07 ± 11.590.232 Gender (male), n(%)82 (49.40)86 (54.09)0.39830 (40.00)56 (66.67)< 0.001 BMI, kg/m^2^23.05 (21.51, 24.42)26.67 (24.40, 29.11)< 0.00125.88 (23.38, 27.70)26.90 (25.19, 30.10)0.011 Hypertension, n (%)84 (50.60)92 (57.86)0.18938 (50.67)54 (64.29)0.083 Diabetes, n (%)53 (31.93)58 (36.48)0.38719 (25.33)39 (46.43)0.006 History of smoking, n (%)46 (27.71)54 (33.96)0.22221 (28.00)33 (39.29)0.134Lipids AST, U/L22.00 (19.00, 26.75)23.00 (19.00, 33.00)0.11822.00 (18.00, 30.00)23.00 (19.00, 34.25)0.284 ALT, U/L20.50 (15.00, 32.75)24.00 (16.50, 37.00)0.02019.00 (14.00, 30.00)28.50 (19.75, 45.25)< 0.001 AST/ALT1.11 (0.79, 1.44)1.05 (0.77, 1.31)0.1141.05 (0.83, 1.32)1.03 (0.74, 1.28)0.338 TC, mmol/L4.27 (3.88, 4.83)4.81 (4.09, 5.38)< 0.0015.04 (4.48, 5.56)4.57 (3.73, 5.37)0.002 TG, mmol/L1.11 (1.00, 1.56)2.05 (1.42, 3.06)< 0.0012.03 (1.52, 2.82)2.06 (1.41, 3.10)0.786 LDL, mmol/L2.37 (1.85, 2.77)2.70 (2.11, 3.31)0.0022.77 (2.27, 3.41)2.66 (1.87, 3.18)0.129 HDL, mmol/L1.15 (1.01, 1.41)1.04 (0.89, 1.21)< 0.0011.04 (0.92, 1.27)1.02 (0.88, 1.16)0.059Inflammatory markers White Blood Cell Count, *10^9^/L5.53 (4.82, 6.80)6.63 (5.68, 8.25)< 0.0016.16 (5.19, 7.38)7.06 (6.19, 8.92)0.006 C-reactive protein, mg/L1.16 (0.76, 3.23)3.67 (1.27, 7.44)< 0.0013.67 (1.12, 6.57)3.67 (1.38, 7.85)0.296 NLR2.22 (1.61, 3.11)2.47 (1.78, 3.37)0.1242.01 (1.56, 2.94)2.70 (2.14, 3.71)< 0.001 PLR114.68 (85.29, 147.71)111.63 (87.82, 144.99)0.880102.00 (80.03, 124.65)128.80 (98.14, 154.96)0.001Medication situation ACEI/ARB14 (8.43)18 (11.32)0.3839 (12.00)9 (10.71)0.798 β-blocker8 (4.82)11 (6.92)0.4203 (4.00)8 (9.52)0.171 CCBs20 (12.05)28 (17.61)0.1589 (12.00)19 (22.62)0.079 Statins31 (18.67)45 (28.30)0.04019 (25.33)26 (30.95)0.432PCAT attenuation, HU LAD−82.27 ± 8.50−79.90 ± 6.650.005−81.05 ± 6.80−78.88 ± 6.380.039 LCX−75.30 ± 6.71−73.21 ± 7.090.007−74.36 ± 6.42−72.18 ± 7.530.053 RCA−82.38 ± 8.40−78.45 ± 7.58< 0.001−80.28 ± 7.40−76.82 ± 7.410.004PCAT volume, mm^3^ LAD1929.48 ± 486.791974.26 ± 446.190.3882014.20 ± 491.221938.61 ± 401.400.293 LCX1306.96 ± 421.601313.83 ± 450.230.8871337.26 ± 475.151292.91 ± 428.550.537 RCA2150.94 ± 576.722236.83 ± 570.090.1782296.97 ± 598.342183.13 ± 541.570.210DS, n (%) LAD-0.00 (0.00, 28.00)-0.00 (0.00, 17.50)11.00 (0.00, 40.25)< 0.001 LCX-0.00 (0.00, 15.00)-0.00 (0.00, 0.00)0.00 (0.00, 25.00)< 0.001 RCA-16.00 (0.00, 28.00)-0.00 (0.00, 19.50)25.00 (11.75, 34.25)< 0.001 DS_max_-22.00 (4.00, 39.50)-11.00 (0.00, 25.50)33.00 (16.00, 45.00)< 0.001TPV, mm^3^-55.48 (6.50, 96.23)-27.36 (0.00, 59.92)81.92 (42.62, 125.21)< 0.001Notes: *P *values obtained from univariate analysis were used to evaluate the associations among various variables, indicating statistically significant differencesAbbreviations: INOCA ischaemia with non-obstructive coronary arteries, BMI body mass index, AST aspartate aminotransferase, ALT alanine aminotransferase, TC total cholesterol, TG triglycerides, LDL low-density lipoprotein, HDL high-density lipoprotein, NLR neutrophil-to-lymphocyte ratio, PLR platelet-to-lymphocyte ratio, ACEI angiotensin-converting enzyme inhibitors, ARB angiotensin receptor blockers, β-blocker beta-blocker, PCAT pericoronary adipose tissue, DS diameter stenosis, TPV total plaque volume, LAD left anterior descending artery, *LCX * left circumflex artery, RCA right coronary artery
In terms of imaging parameters, the NAFLD group exhibited significantly higher PCATa values in all three major coronary arteries compared to the non-NAFLD group (LAD: −82.27 ± 8.50 HU vs. −79.90 ± 6.65 HU, p = 0.005; LCX: −75.30 ± 6.71 HU vs. −73.21 ± 7.09 HU, p = 0.007; RCA: −82.38 ± 8.40 HU vs. −78.45 ± 7.58 HU, p < 0.001). Among NAFLD patients, those with INOCA exhibited significantly higher LAD and RCA-PCAT attenuation values (LAD: −78.88 ± 6.38 HU vs. −81.05 ± 6.80 HU, p = 0.039; RCA: −76.82 ± 7.41 HU vs. −80.28 ± 7.40 HU, p = 0.004) and lower TPV and DS_max_ (p < 0.001) compared to those without INOCA. However, no statistically significant differences in the proximal PCAT volumes of the three coronary arteries were observed between the groups (p > 0.05). Supplemental Table 1 presents the clinical and imaging characteristics of patients in the training and testing cohorts. No significant correlation was observed between variables and INOCA occurrence in either cohort.
Feature selection and prediction model development
Univariate logistic regression was used to evaluate the clinical and imaging parameters associated with INOCA, with variables showing statistical significance (p < 0.05) included in the multivariate logistic regression analysis. Using a forward stepwise approach, male, diabetes mellitus, WBC count, and BMI were independent predictors of INOCA (all p < 0.05) (Table 2). These four clinical indicators were used to construct a clinical feature model (Model 3) via logistic regression. Similarly, univariate and multivariate analyses confirmed that RCA-PCATa and TPV were significantly associated with INOCA. The PCATa model (Model 1) was constructed using the RCA-derived PCATa, as described above. In our analysis, only RCA-PCAT attenuation was significantly associated with INOCA, whereas LAD- and LCX-PCAT attenuation did not reach statistical significance. Considering that the RCA is less frequently affected by calcification and motion artifacts compared with the LAD and LCX, which allows more consistent segmentation and reproducible measurement, the proximal RCA-PCAT region was therefore used as the primary site for feature extraction in the radiomic analysis. The LASSO regression analysis identified two significant radiomic features with nonzero coefficients (Cluster Prominence and Low Gray Level Run Emphasis) as important predictors. These features were used to construct the radiomics model (Model 2), and the Radscore was calculated based on these features. The Radscore differed significantly between INOCA and non-INOCA groups (p < 0.05; Fig. 4). Furthermore, a combined imaging model (Model 4) was developed by integrating imaging indicators (PCATa, TPV) with radiomic features. A combined clinical-imaging model (Model 5) was constructed by combining clinical factors, imaging indicators, and radiomic features. These models were subsequently used for the diagnostic assessment of INOCA in patients with NAFLD.
Table 2. Univariable and multivariable logistic regression analyses for INOCAUnivariable AnalysisMultivariable AnalysisOR (95% CI)P valueOR (95% CI)P valueAge(y)1.017 (0.989 ~ 1.045)0.231Gender (male)3.000 (1.570 ~ 5.732)< 0.0012.751 (1.330 ~ 5.693)0.007BMI, kg/m^2^1.116 (1.022 ~ 1.218)0.0151.116 (1.008 ~ 1.235)0.034Hypertension1.753 (0.928 ~ 3.310)0.084Diabetes2.554 (1.302 ~ 5.013)0.0062.984 (1.340 ~ 6.645)0.007History of smoking1.664 (0.853 ~ 3.244)0.135AST/ALT0.615 (0.307 ~ 1.233)0.171TG, mmol/L0.851 (0.714 ~ 1.014)0.071TC, mmol/L0.594 (0.432 ~ 0.816)0.0010.573 (0.404 ~ 0.814)0.002LDL, mmol/L0.763 (0.520 ~ 1.119)0.166HDL, mmol/L0.256 (0.072 ~ 0.903)0.0340.641 (0.134 ~ 3.055)0.576White Blood Cell Count, *10^9^/L1.219 (1.051 ~ 1.415)0.0091.218 (1.031 ~ 1.439)0.020C-reactive protein, mg/L1.012 (0.994 ~ 1.031)0.201NLR1.091 (0.938 ~ 1.269)0.260PLR1.005 (0.999 ~ 1.010)0.076ACEI/ARB0.880 (0.330 ~ 2.348)0.798β-blocker2.526 (0.645 ~ 9.879)0.183CCBs2.144 (0.904 ~ 5.085)0.084Statins1.321 (0.659 ~ 2.651)0.433LAD PCAT attenuation, HU1.053 (1.002 ~ 1.106)0.0431.036 (0.983 ~ 1.092)0.187LCX PCAT attenuation, HU1.046 (0.999 ~ 1.095)0.055RCA PCAT attenuation, HU1.069 (1.020 ~ 1.121)0.0061.069 (1.014 ~ 1.127)0.013LAD PCAT volume, mm31.000 (0.999 ~ 1.000)0.286LCX PCAT volume, mm31.000 (0.999 ~ 1.000)0.534RCA PCAT volume, mm31.000 (0.999 ~ 1.000)0.209DS_max_1.042 (1.022 ~ 1.062)< 0.0010.994 (0.961 ~ 1.028)0.721TPV1.019 (1.012 ~ 1.027)< 0.0011.021 (1.008 ~ 1.035)0.002Notes: OR odds ratio, 95% CI 95% confidence interval, BMI body mass index, AST aspartate aminotransferase, ALT alanine aminotransferase, TG triglycerides, NLR neutrophil-to-lymphocyte ratio, PLR platelet-to-lymphocyte ratio, ACEI angiotensin-converting enzyme inhibitors, ARB angiotensin receptor blockers, β-blocker beta-blocker, PCAT pericoronary adipose tissue, LAD left anterior descending artery, LCX left circumflex artery, RCA right coronary artery, DS diameter stenosis, TPV total plaque volume
Fig. 4. Radscore of NAFLD Patients with INOCA or Without INOCA Across Cohorts. INOCA, ischaemia with non-obstructive coronary arteries; NAFLD, nonalcoholic fatty liver disease
Discrimination
Figure 5 A presents the performance of the models in the training and validation cohorts, along with pairwise comparisons of the ROC curves. The discriminatory ability of the models was quantified by assessing the AUC, specificity, sensitivity, accuracy, positive predictive value (PPV), and negative predictive value (NPV), as summarized in Table 3. Model 2 exhibited superior diagnostic performance for INOCA in patients with NAFLD compared with Model 1, with AUCs of 0.734 (95% CI: 0.640–0.828) and 0.674 (95% CI: 0.574–0.779), respectively, in the training cohort and 0.706 (95% CI: 0.558–0.853) and 0.637 (95% CI: 0.478–0.797), respectively, in the validation cohort. Model 4 demonstrated greater discriminatory ability than Model 3, achieving an AUC of 0.830 (95% CI: 0.755–0.906) in the training cohort and 0.813 (95% CI: 0.687–0.939) in the validation cohort. Thus, the incorporation of clinical factors into Model 5 significantly improved its diagnostic performance. Model 5 achieved an AUC of 0.873 (95% CI: 0.808–0.937) in the training cohort and 0.824 (95% CI: 0.708–0.941) in the validation cohort. This model was superior to Models 1, 2, and 3 individually, demonstrating significantly improved incremental reclassification performance. Furthermore, the NRI and IDI metrics confirmed the superior predictive capability of Model 5 in both the training and validation cohorts (all p < 0.05) (Supplemental Table 2).
Fig. 5. To assess the effectiveness of various models in identifying NAFLD patients with INOCA. A ROC Curves of All Models for the Training and Validation Cohorts; B Calibration Curves for the Training and Validation Cohorts of the Conbined Imaging-clinical Models; C DCA for the Validation Group Comparing Models 1–4 with Model 5. Model 1, PCATa model; Model 2, Radiomics model; Model 3, Clinical factors model; Model 4, Combined imaging model; Model 5, Combined imaging-clinical model
Table 3. Recognition ability of all models for patients with INOCATraining groupValidation groupAUC(95%CI)SENSPEACCPPVNPVAUC(95%CI)SENSPEACCPPVNPVModel 10.674(0.574–0.779)0.7070.5000.6090.6120.6050.637(0.478–0.797)0.6150.4780.5510.5710.524Model 20.734(0.640–0.828)0.7240.6150.6730.6770.6670.706(0.558–0.853)0.6540.5220.5920.6070.571Model 30.740(0.647–0.834)0.7410.6350.6910.6940.6880.712(0.565–0.860)0.5770.7390.6530.7140.607Model 40.830(0.755–0.906)0.7240.7310.7270.7500.7040.813(0.687–0.939)0.7310.6960.7140.7310.696Model 50.873(0.808–0.937)0.7760.7310.7550.7630.7450.824(0.708–0.941)0.7690.6520.7140.7140.714Notes: INOCA ischaemia with non-obstructive coronary arteries, AUC area under curve, 95%CI 95% confidence interval, SEN sensitivity, SPE specificity, ACC accuracy, PPV positive predictive value, NPV negative predictive value Model 1 = PCATa model; Model 2 = Radiomics model; Model 3 = Clinical factors model; Model 4 = Combined imaging model; Model 5 = Combined imaging-clinical model
Calibration and clinical application
The calibration curves of the comprehensive model exhibited strong agreement between predicted and observed outcomes in both cohorts, indicating good calibration (Fig. 5 B). DCA further showed that Model 5 provided the greatest net clinical benefit across a wide range of threshold probabilities, suggesting its potential clinical applicability (Fig. 5 C).
Discussion
In this study, we compared PCAT and clinical indicators between patients with NAFLD and INOCA and those without, and further evaluated the feasibility of identifying concurrent INOCA. RCA-PCATa and radiomic features were effective for distinguishing NAFLD with INOCA, with radiomics models outperforming the standalone PCATa model. Furthermore, the combination of imaging indicators (PCATa, radiomics, TPV) surpassed clinical factors, whereas integrating imaging and clinical factors achieved the highest discriminatory ability for INOCA diagnosis.
Although traditional diagnostic approaches focus on evaluating coronary artery stenosis, particularly through the assessment of obstructive disease, increasing evidence suggests that non-obstructive CAD also holds significant clinical relevance. Non-obstructive CAD, typically defined as coronary artery stenosis of less than 50%, can still result in ischemic symptoms and adverse cardiovascular outcomes due to underlying pathological mechanisms such as inflammation, plaque vulnerability, and microvascular dysfunction [5, 27]. Our study emphasizes the crucial role of inflammation in the development of INOCA, where systemic chronic inflammation, common in NAFLD, exacerbates coronary artery inflammation, thus contributing to ischaemia despite non-obstructive stenosis [8, 12]. PCAT, as a biomarker of vascular inflammation, reflects the dynamic pathological changes in atherosclerosis, with higher PCATa often indicating more severe inflammatory activity closely associated with the development and progression of CAD [28]. Our study found that patients with NAFLD exhibited significantly higher PCATa than patients without NAFLD, a finding that is consistent with that of previous studies, suggesting that elevated PCATa is a novel cardiovascular risk predictor in patients with NAFLD [12, 22], a trend that persists even in non-obstructive CAD. We further demonstrated that patients with NAFLD and INOCA have significantly higher LAD-PCATa and RCA-PCATa than those without, showing that patients with INOCA experience more pronounced coronary perivascular inflammation, likely because of lipid metabolism disorders, chronic inflammatory responses, and the critical role of PCAT in coronary artery pathology [8]. However, although increased LAD-PCATa was observed in patients with INOCA, our results revealed that only RCA-PCATa was an indicator for distinguishing patients with NAFLD and INOCA from those without, which was inconsistent with previous studies [22, 29]. This discrepancy may be attributed to the fact that prior research indicated that stenosis was more commonly observed in the LAD in patients with NAFLD, whereas no significant stenosis was found in the LAD in our cohort. In contrast, the RCA, because of its fewer branches and greater amount of pericoronary adipose tissue, can serve as a routine parameter reflecting overall coronary inflammation [24]. Moreover, RCA-PCAT may be more sensitive to systemic inflammatory changes in metabolic diseases such as NAFLD, possibly due to its relatively stable anatomical position and reduced susceptibility to motion artifacts. These factors may account for the greater predictive value of RCA-PCATa observed in our study. In addition, prior studies have suggested that RCA-PCATa values above − 76.3 HU are indicative of increased coronary inflammation and heightened cardiovascular risk [30]. While no universally accepted cutoff currently exists, our observation that NAFLD patients with INOCA exhibited significantly elevated RCA-PCATa supports its potential as a non-invasive biomarker for risk stratification. Rather than focusing on a single threshold, our results based on continuous RCA-PCATa values demonstrate a consistent association with coronary inflammation. These findings suggest that incorporating PCAT attenuation into routine CCTA interpretation could enhance risk stratification of NAFLD patients with non-obstructive stenosis, who might otherwise be underrecognized by traditional stenosis-based assessments.
In distinguishing patients with NAFLD and INOCA from those without INOCA, the radiomics model exhibited superior predictive performance compared with the PCAT model (training: AUC: 0.734 vs. 0.674; validation: AUC: 0.706 vs. 0.637). This may be because vascular inflammation induces irreversible changes in adipose tissue, such as PCAT fibrosis and microvascular remodeling [14, 15], which cannot be adequately captured by PCATa values alone. This advantage of the radiomics model may be because of its ability to extract high-dimensional features through quantitative analysis and pattern recognition of medical imaging data, which significantly enhances the characterization of tissue and lesion properties compared with PCATa, providing deeper diagnostic insights [31, 32]. Furthermore, it enhances capture tissue heterogeneity, inflammatory status, and plaque stability, offering a more comprehensive assessment of vascular pathology [33]. PCAT radiomic features have been used to explore the association between coronary artery inflammation and CAD occurrence in several studies [11, 34]. Zhang et al. [11] constructed a PCAT radiomics scoring model based on seven representative radiomic features and demonstrated that this model significantly outperformed conventional PCAT parameters in diagnosing CAD. Furthermore, a retrospective case–control study reported that PCAT radiomic features derived from CCTA provided higher predictive accuracy for acute coronary syndrome than traditional PCATa parameters [34]. These findings collectively highlight the complementary role of PCAT radiomics alongside conventional PCAT parameters, offering clinicians more precise diagnostic references and facilitating early intervention and timely treatment.
Thus, our study developed and evaluated a comprehensive imaging model that integrates PCAT radiomics and imaging indicators to assist in the diagnosis of INOCA in patients with NAFLD. The improved performance of the combined imaging model may be attributed to its ability to capture subtle tissue heterogeneity and spatial relationships within PCAT [11] while providing anatomical parameters, such as plaque characteristics, thereby enabling a more comprehensive evaluation of coronary artery plaques and inflammation. Furthermore, in our analysis, the combined imaging-clinical model showed the best discriminatory ability among all models. Clinical characteristics, such as sex, BMI, WBC count, and diabetes mellitus, provide the fundamental assessment of patient risk, whereas imaging parameters may improve diagnostic precision by capturing disease-specific features that are not readily detectable through clinical evaluation alone. This integrative approach could be particularly informative in patients with NAFLD, given that the distinct metabolic and pericoronary inflammatory environment associated with the disease might contribute to an underestimation of cardiovascular risk when relying solely on traditional risk scores. The findings of Li et al. [22] further support the use of this approach and demonstrated that the combination of clinical features, CTA parameters, and PCAT radiomics has potential to improve the risk prediction of stable CAD in patients with NAFLD. The development of a combined model may therefore offer a useful exploratory framework rather than a definitive diagnostic tool for assessing the likelihood of NAFLD progressing to CAD, particularly in individuals with non-obstructive CAD, and could help guide early monitoring and further investigation in future studies.
Despite these encouraging results, this study has several limitations that should be acknowledged. First, this was a single-center retrospective study with a relatively small sample size, which may have restricted the generalizability of the findings because no external validation data were available for confirmation. Future research should incorporate data from multiple centers with larger and more diverse populations to enhance the applicability and enable a more comprehensive analysis. Second, all patients in this study underwent imaging using the same CT scanning protocol. The mechanisms underlying the influence of variations in CT equipment settings on the radiomic parameters remain unclear. Further studies are necessary to evaluate the robustness of radiomic features across different imaging protocols and scanners. Third, the model was not compared with traditional risk prediction tools (e.g., Framingham or ASCVD), which may have limited the demonstration of the incremental value of radiomics; future studies will incorporate more comprehensive clinical data to allow validation and direct comparison. Fourth, although this study focused on radiomic feature extraction from RCA-PCAT, future research should expand to include PCAT features from other coronary artery segments. This approach would provide a more comprehensive assessment of inflammation-related changes and improve our understanding of the full spectrum of vascular inflammation.
Conclusion
PCAT radiomics demonstrated potential value in identifying INOCA in patients with NAFLD. Integrating PCAT radiomic features with imaging indicators may provide an effective approach to improve the diagnosis of INOCA in this population, outperforming clinical factors alone in our study. The combined clinical-imaging model achieved the highest discriminatory performance in distinguishing patients with INOCA from those without, supporting its potential clinical utility in patients with NAFLD.
Supplementary Information
Supplementary Material 1.
Supplementary Material 2.