Stage-specific RNA regulomes of Trichophyton mentagrophytes: mRNA-lncRNA-miRNA interplay in spore-hypha transition
Wudian Xiao, Zhaodan Wu, Jia Zhang, Jun Wan, Ruihuan Zhang, Xinyi Xiang, Yang Yu, Lu Fu, Kui Yang, Yang Chen, Ziyao Xiao, Ziyu Wang, Lvqin He, Jingcan You, Chunxiang Zhang

TL;DR
This study explores how RNA molecules interact during the spore-to-hypha transition in the fungus Trichophyton mentagrophytes, revealing key regulatory networks involved in germination.
Contribution
The first comprehensive characterization of mRNA-lncRNA-miRNA regulatory networks during germination in Trichophyton mentagrophytes.
Findings
3,193 mRNAs, 409 lncRNAs, and 119 miRNAs were found to be differentially expressed during germination.
A regulatory network involving 2,672 mRNAs, 107 miRNAs, and 329 lncRNAs was constructed.
The RNA molecules are linked to biosynthesis, cell wall remodeling, and metabolic processes during germination.
Abstract
Background: As a globally distributed dermatophyte, Trichophyton mentagrophytes (T. mentagrophytes) causes diverse dermatophytoses in humans and animals. Long non-coding RNAs (lncRNAs) and microRNAs (miRNAs), which serve as critical regulators of diverse biological processes, have been extensively characterized in numerous fungal species. However, the role of mRNAs, lncRNAs, and miRNAs during T. mentagrophytes germination remains unexplored. Objectives: In this study, the molecular mechanisms involved in the germination of T. mentagrophytes were systematically investigated. Methods: RNA-sequencing technology, small RNA-sequencing technology, related bioinformatics methods, and qRT-PCR were used to systematically characterize the expression profiles of mRNAs, miRNAs, and lncRNAs in T. mentagrophytes spores and hyphae, and analyze the regulatory mechanisms of mRNAs, miRNAs, and lncRNAs…
Genes, proteins, chemicals, diseases, species, mutations and cell lines named across the full text — each resolved to its canonical identifier and authoritative record.
Click any figure to enlarge with its caption.
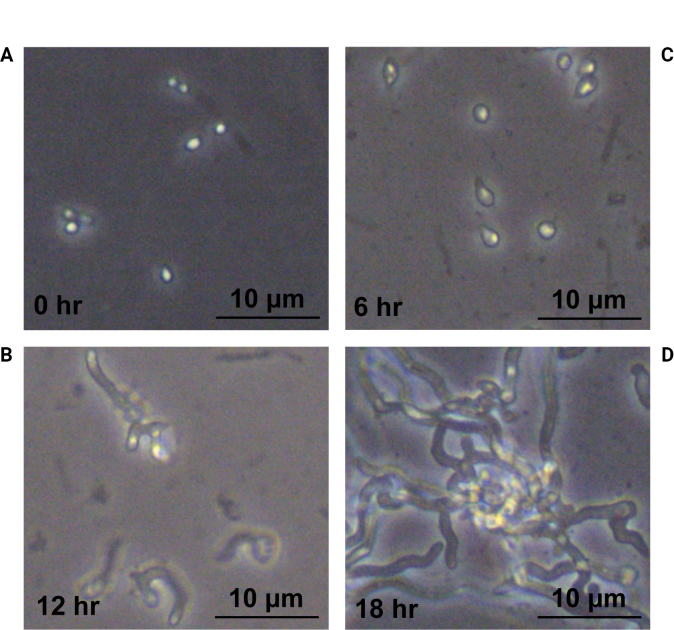 Figure 1
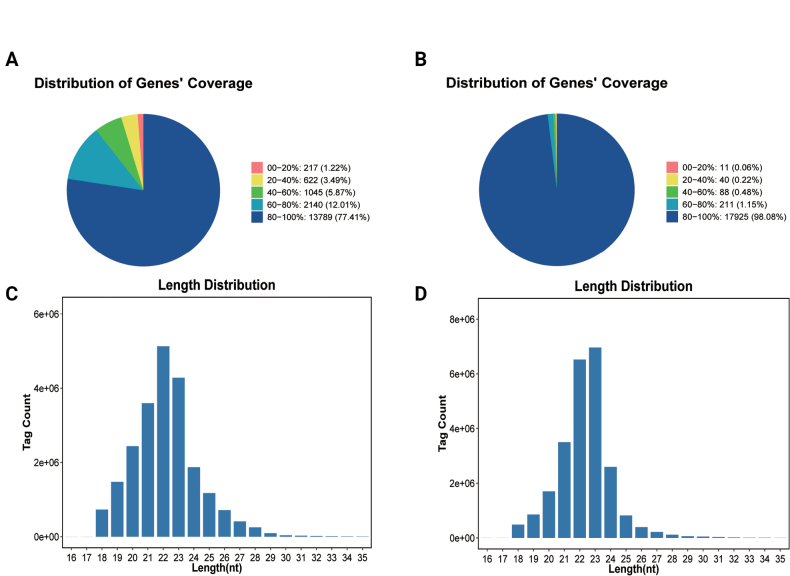 Figure 2
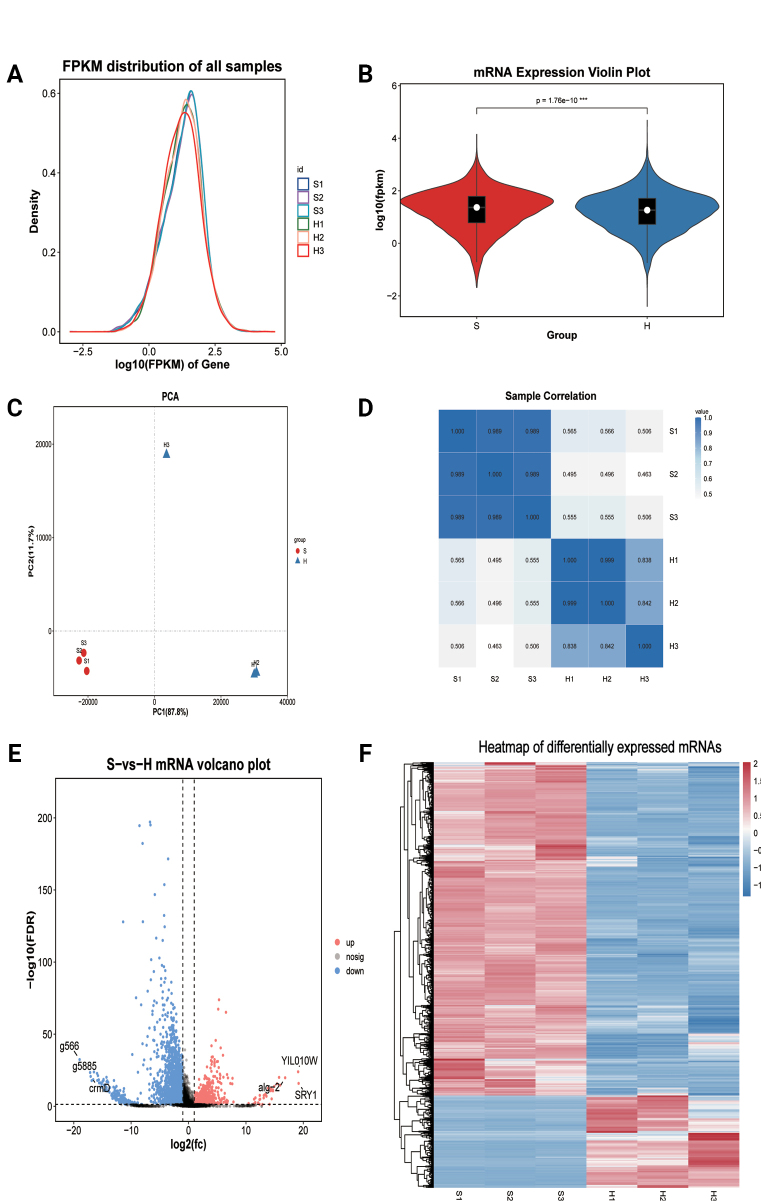 Figure 3
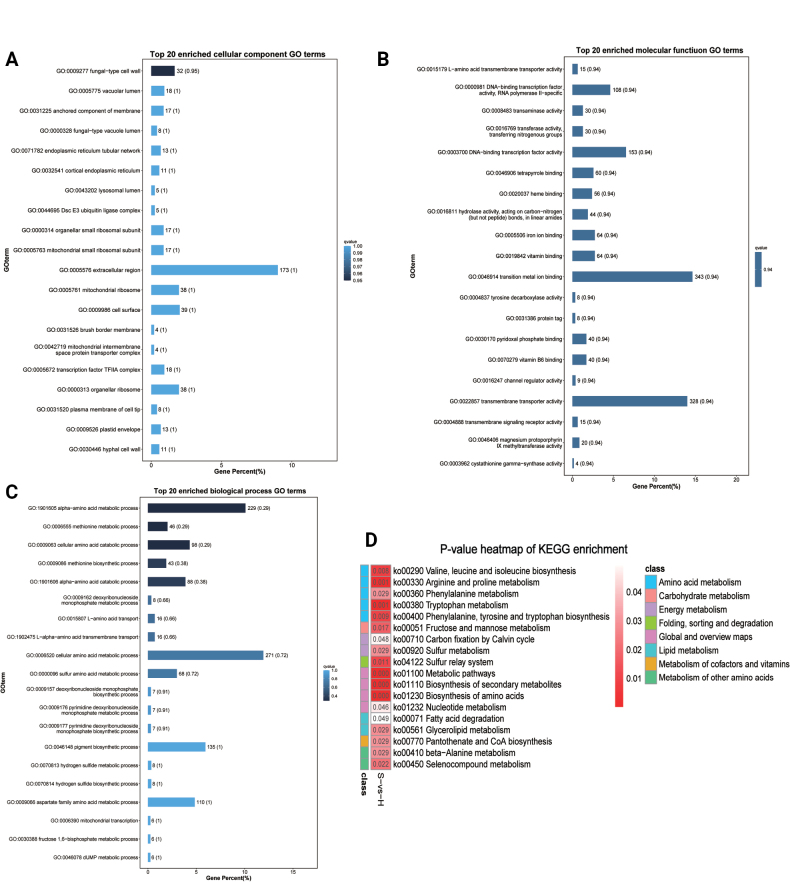 Figure 4
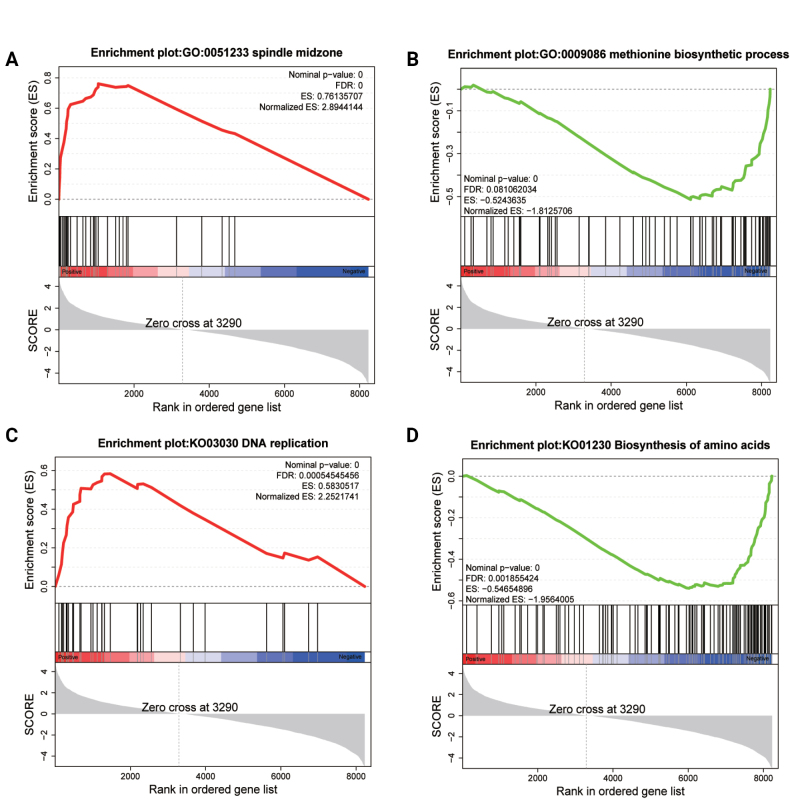 Figure 5
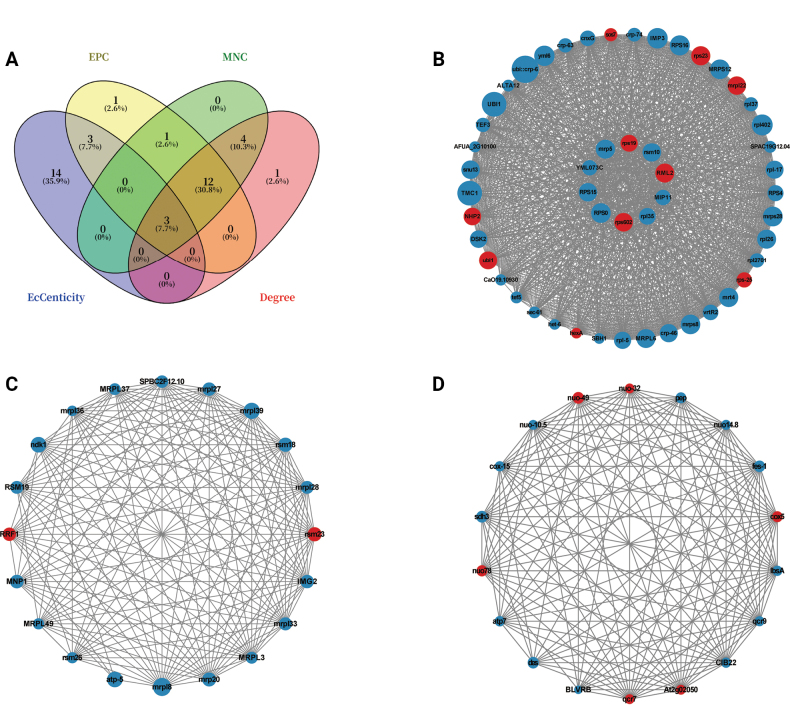 Figure 6
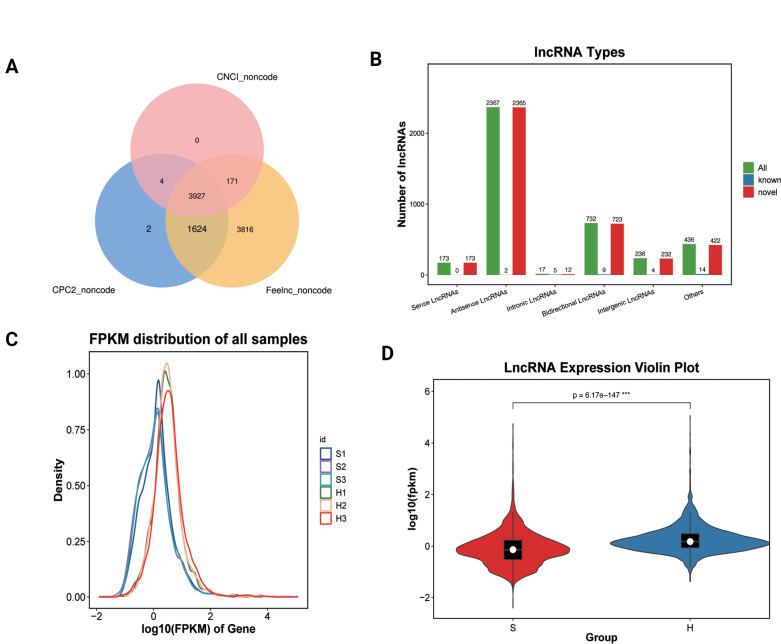 Figure 7
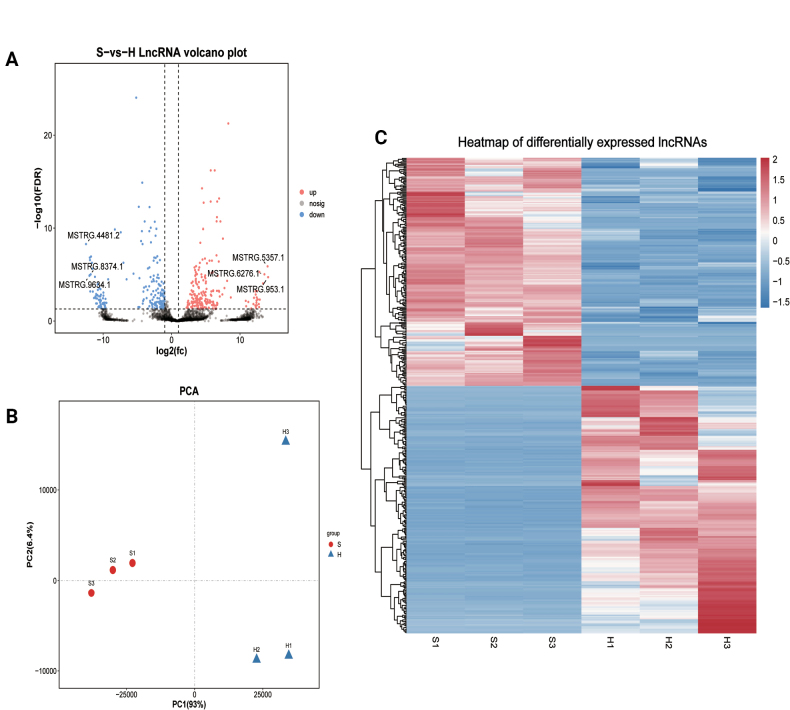 Figure 8
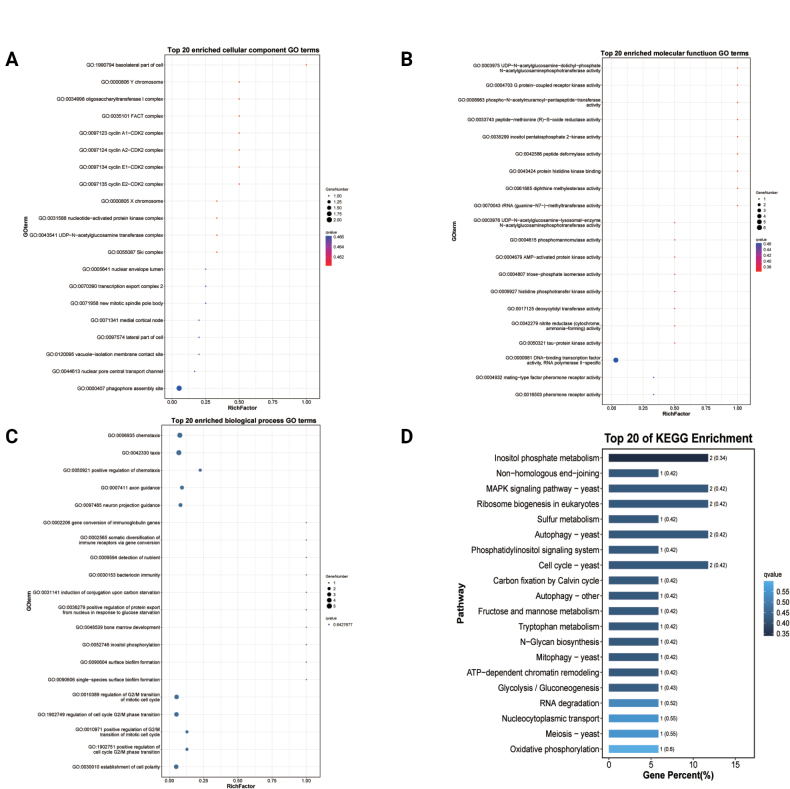 Figure 9
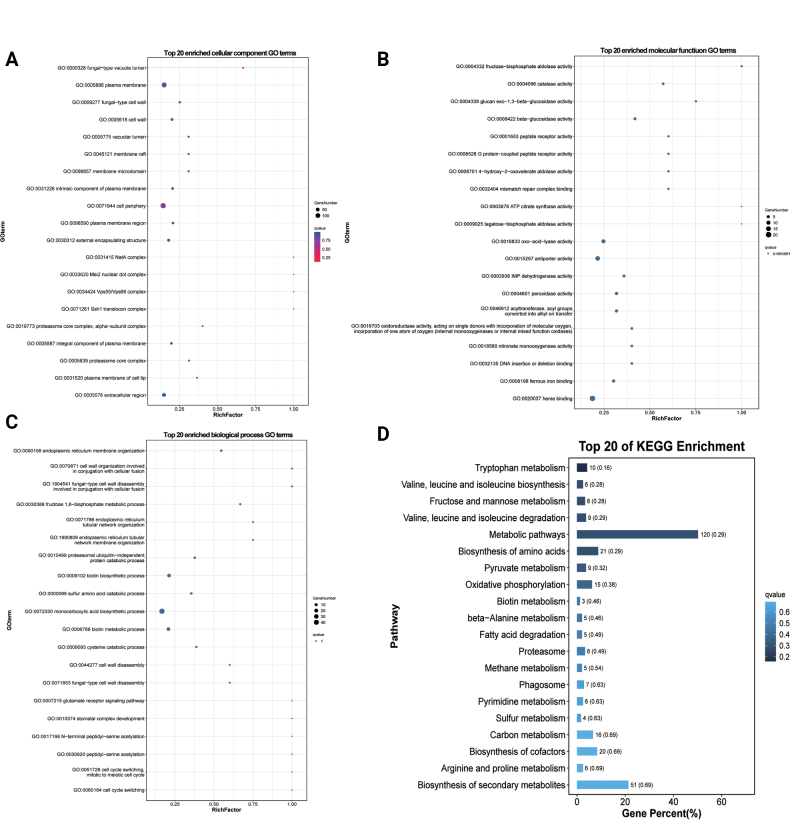 Figure 10
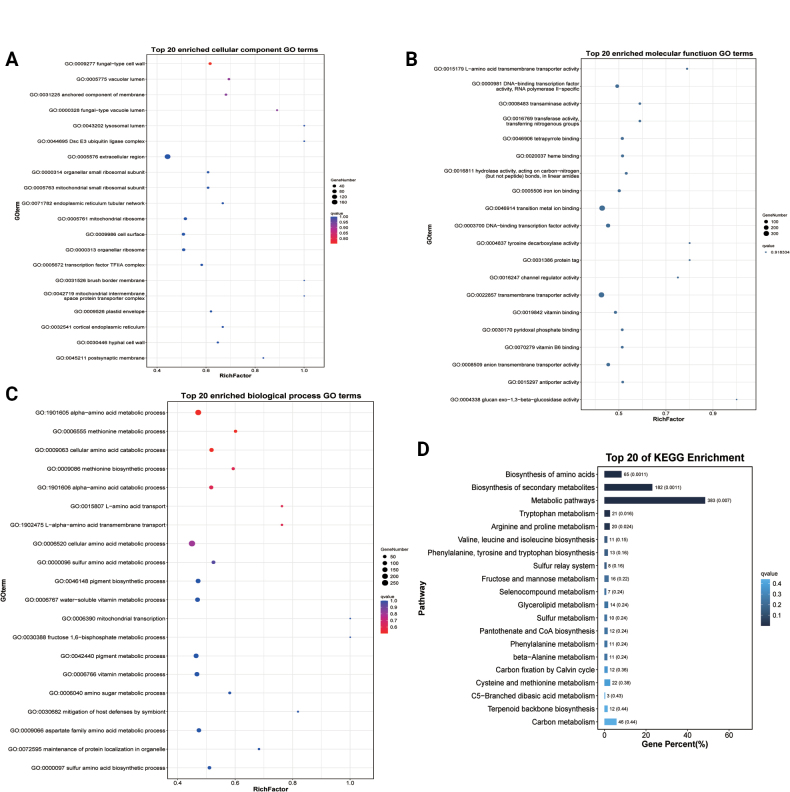 Figure 11
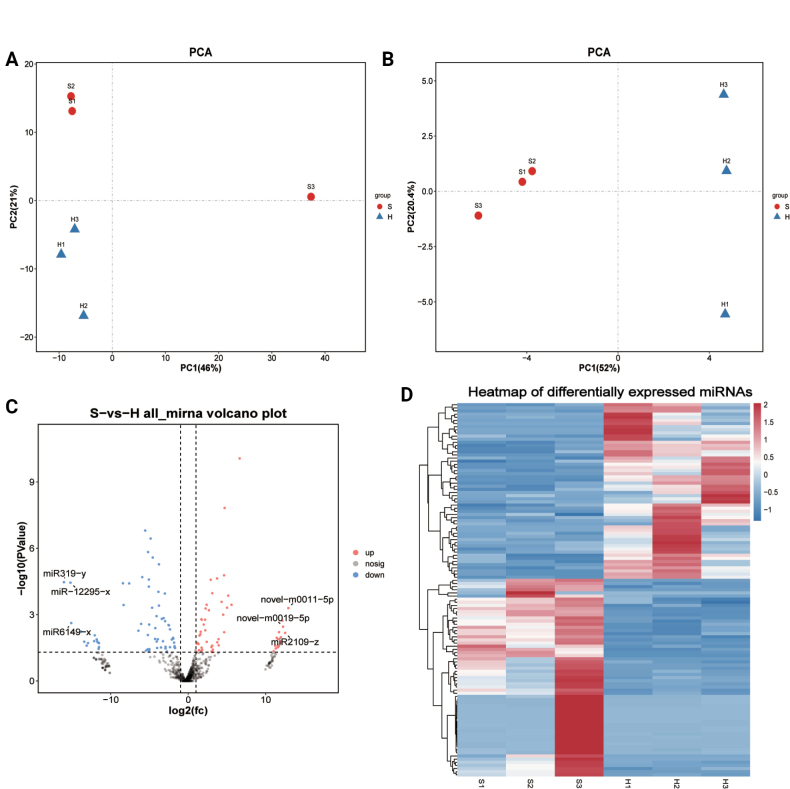 Figure 12
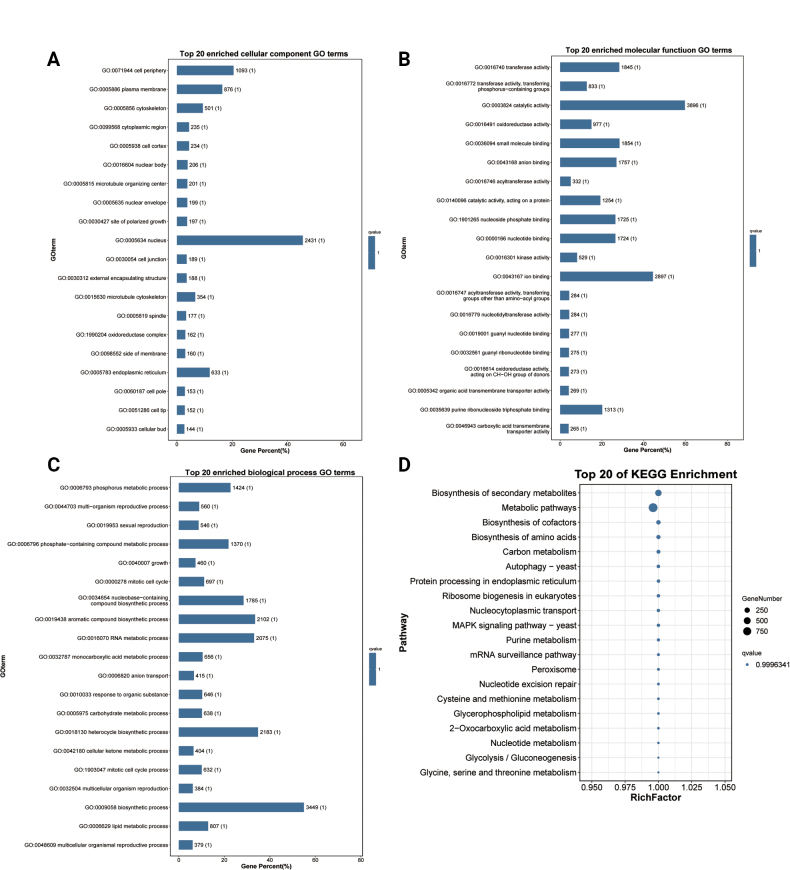 Figure 13
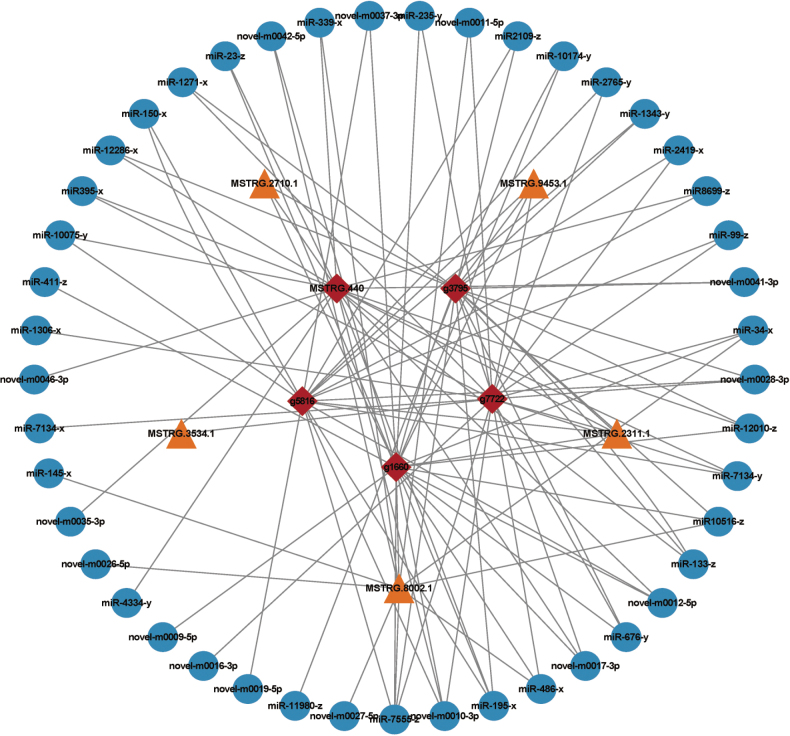 Figure 14
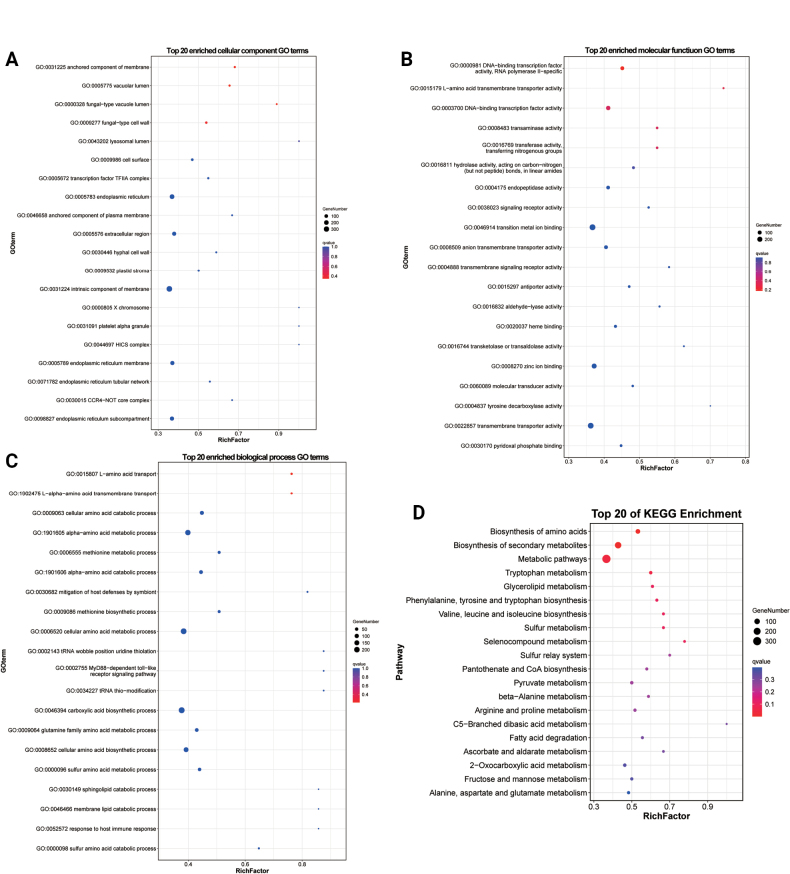 Figure 15
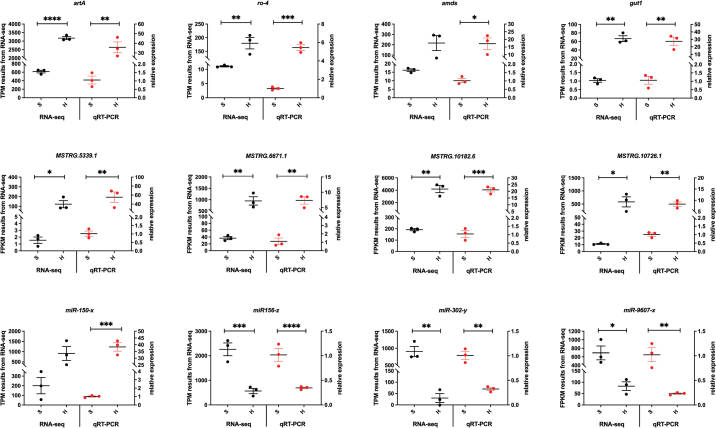 Figure 16
Peer Reviews
No public reviews on file for this paper yet. If you reviewed it on a platform where reviews are public (OpenReview, ICLR, NeurIPS, ICML), you can paste yours below so the community can read it here.
Videos
No videos yet. Explain this paper in a talk, walkthrough, or lecture? Add one.
Taxonomy
TopicsNail Diseases and Treatments · Dermatology and Skin Diseases · Genital Health and Disease
Introduction
Trichophyton mentagrophytes (T. mentagrophytes) is a globally distributed zoonotic dermatophyte that infects keratinized tissues (skin, nails, hair follicles), causing persistent dermatophytoses in humans and diverse mammalian hosts. Clinical manifestations include tinea manuum, onychomycosis, tinea capitis, and tinea pedis (Weitzman and Summerbell 1995; Chermette et al. 2008). The recalcitrance of these infections characterized by high recurrence rates and escalating antifungal resistance due to therapeutic overuse, establishes T. mentagrophytes as a critical public health threat (Ebert et al. 2020).
The spore-to-hypha transition constitutes a pivotal virulence determinant. During germination, spores adhere to the stratum corneum via extracellular ligands, develop germ tubes, and secrete keratinolytic enzymes (keratinases, lipases, phospholipases) that facilitate tissue invasion (Duek et al. 2004; Elavarashi et al. 2017). Notably, while scanning electron microscopy has delineated morphological events, the transcriptomic regulatory architecture—particularly dynamic interactions among mRNAs, lncRNAs, and miRNAs, remains unexplored in T. mentagrophytes (Duek et al. 2004).
Advancements in RNA sequencing (RNA-seq) enable genome-scale profiling of transcriptional networks (Hrdlickova et al. 2017), as demonstrated by antifungal target identification in Trichophyton rubrum (Galvão-Rocha et al. 2023). Non-coding RNAs that are transcribed from non-coding regions of the genome, orchestrate key fungal adaptations. Long non-coding RNAs (lncRNAs; >200 nt) modulate cell wall biogenesis, transcriptional regulation (e.g., GAL-mediated R-loop formation in yeast), and stress responses (Cloutier et al. 2016; Hombach and Kretz 2016; Novačić et al. 2020; Shuman 2020). MicroRNAs (miRNAs; 19–25 nt) guide RNA-induced silencing complexes (RISCs) to target mRNAs via 3’/5’ UTR binding, post-transcriptionally regulating developmental transitions (Iwakawa and Tomari 2022), as evidenced by stage-specific miRNAs in Trichophyton rubrum and iron adaptation in Paracoccidioides brasiliensis (Wang et al. 2018; de Curcio et al. 2021). Despite documented roles of lncRNAs and miRNAs in fungal morphogenesis, no integrated analysis of the tripartite RNA regulome (mRNA-lncRNA-miRNA) exists for T. mentagrophytes germination (Lau et al. 2020; Lai et al. 2023).
Recently, we reported a transcriptome analysis of circRNAs in T. mentagrophytes during spore germination (Zhang et al. 2023). That work provided the first insights into RNA-based regulation of fungal morphogenesis in dermatophytes, but was inherently restricted to a single class of non-coding RNAs. To achieve a more comprehensive understanding, the present study integrates expression profiles of mRNAs, lncRNAs, and miRNAs into a unified regulatory framework. This integrated approach allows us to not only catalogue diverse RNA species but also to construct candidate competing endogenous RNA (ceRNA) networks, thereby exploring the multilayered control underlying the critical spore-to-hypha transition.
Materials and methods
Fungal culture and sample collection
The T. mentagrophytes wild-type strain ATCC MYA-4439 was provided by BeNa Culture Collection (BNCC, Beijing, China). T. mentagrophytes strain was cultured and maintained on potato dextrose agar medium (BD, Sparks, MD, USA) for 14 days at 28 °C to harvest spores (Wang et al. 2022; Zang et al. 2024). Spores on the mycelium surface were rinsed using 5 mL of sterile distilled water and passed sequentially through three cell filters with pore sizes of 0.05 mm, 0.026 mm, and 0.01 mm (Zhang et al. 2023). In order to collect hyphae, spores were cultured and maintained in yeast extract peptone dextrose medium solution shaken on a THZ-300 shaker (Yiheng Scientific Instrument Co., Shanghai, China) at 200 rpm for 5 days at 28 °C. The hyphae were then filtered through gauze, followed by washing with sterile distilled water to collect pure hyphae.
Germination analysis of T.
mentagrophytes spores
For germination analysis, 20 mL of 1 × 10^5^ spores/mL T. mentagrophytes spore suspension was inoculated into each of a series of 250 mL erlenmeyer flasks containing 80–100 mL of yeast extract peptone dextrose medium, and immediately incubated at 28 °C with constant shaking (200 rpm) (Yiheng Scientific Instrument Co., Shanghai, China). Samples at the time-points 0, 6, 12, and 18 hr post-inoculation were taken directly from the medium and subjected to morphological observation using a motic AE2000 microscope (Motic, Fujian, China).
mRNA-lncRNA isolation, ribosomal RNA-depleted strand-specific library construction, and sequencing
After total RNA was extracted from the three spore (S, n = 3) and hyphae (H, n = 3) samples using TRIzol^®^ reagent (Invitrogen, Carlsbad, CA, USA) according to the manufacturer’s instructions, ribosomal RNA was removed to retain both coding and non-coding RNAs. The remaining RNA was enriched using SPRI beads, fragmented at high temperature, and reverse-transcribed into double-stranded cDNA. The cDNA was then end-repaired, A-tailed, and ligated to adapters, followed by PCR amplification. Amplified products were purified with VAHTS DNA Clean Beads and sequenced on an Illumina NovaSeq X Plus by Gene Denovo Biotechnology Co. (Guangzhou, China).
miRNA isolation, library construction, and sequencing
Total RNA of spores (S, n = 3) and hyphae (H, n = 3) was extracted with the TRIzol^®^ reagent, followed by enrichment of RNA molecules in the 18–30nt size range by polyacrylamide gel electrophoresis (PAGE). The library construction involved sequential ligation of adapters. After the 3’ adapters were ligated, a size-selection step was performed to enrich RNAs between 36–44 nucleotides. The 5’ adapters were then ligated to these size-selected molecules. The ligation products were then reverse transcribed by PCR amplification, and the 140–160 bp size PCR products were enriched to generate a cDNA library and sequenced using Illumina NovaSeq X Plus by Gene Denovo Biotechnology Co. (Guangzhou, China).
Analysis of differentially expressed mRNA
Initially, low-quality reads were filtered from the raw data using fastp (version 0.18.0) to obtain high-quality clean reads (Chen et al. 2018). Reads mapped to the ribosome database were then removed using Bowtie2 (version 2.2.8) (Langmead and Salzberg 2012). Paired-end clean reads were mapped to the T. mentagrophytes genome (GSA: CRA028745) using HISAT2 (version 2.2.1), and transcripts were reconstructed using Stringtie (version 2.2.3) (Trapnell et al. 2010; Kim et al. 2015; Pertea et al. 2015). All of the reconstructed transcripts were aligned to reference genome and were divided into twelve categories by using gffcompare. We defined transcripts with one of the class codes ‘u, i, j, x, c, e or o’ as novel transcripts. We used the following parameters to identify reliable novel genes: transcripts longer than 200 bp, and had to have more than two exons. A FPKM (fragment per kilobase of transcript per million mapped reads) value was calculated using the RSEM software primarily for assessing gene expression levels and facilitating sample comparisons (Li and Dewey 2011). Correlation analysis was conducted using R to assess the reliability and operational stability of the experimental replicates. The correlation coefficient between two samples was calculated, with values closer to 1 indicating stronger reproducibility. Principal component analysis (PCA) was performed using the R package gmodels (http://www.rproject.org/) to reveal relationships between samples. To ensure analytical rigor, differential expression analysis was performed using DESeq2, which utilizes raw read counts and employs a negative binomial model to identify significantly differentially expressed genes (Love et al. 2014). Genes with a false discovery rate (FDR) < 0.05 and a fold change > 2 were considered differentially expressed.
Identification and analysis of lncRNAs
All reconstructed transcripts were mapped to the T. mentagrophytes genome and classified into twelve categories using Cuffcompare before selecting transcripts longer than 200 bp and with an exon number greater than two. By requiring more than one exon, our pipeline systematically excludes single-exon lncRNAs. The protein coding potential of the new transcripts was assessed with CNCI (version 2), CPC (version 0.9-r2) and FEELNC (version v0.2) using the default parameters (Kong et al. 2007; Sun et al. 2013; Wucher et al. 2017). Transcripts consistently predicted as non-protein-coding by all three tools were classified as lncRNAs. Potential lncRNAs were classified into five categories based on their position with respect to protein coding genes: intergenic lncRNAs, bidirectional lncRNAs, intronic lncRNAs, antisenselncRNAs, and sense-overlapping lncRNAs. The lncRNA target mRNAs were identified by performing antisense, trans- and cis-regulation lncRNA analyses with RNAplex (version 0.2) (Tafer and Hofacker 2008). The FPKM values, correlation coefficients, PCA, and differentially expressed lncRNAs were assessed as for mRNA (see section 2.5 above).
miRNA identification and analysis
Reads containing more than one low quality (Q-value ≤ 20) base or unknown nucleotides (N), reads without 3’ adapters, reads containing 5’ adapters, reads containing 3’ and 5’ adapters but no small RNA fragment between them, reads containing poly (A) in the small RNA fragment, and reads shorter than 18 nt (not including adapters) were removed from the raw data. The resulting clean tags were aligned to the GenBank database (Release 209.0) and Rfam database (Release 14.10) to remove rRNA, scRNA, snoRNA, snRNA and tRNA. All clean tags were also aligned to the reference genome (GSA: CRA028745) to remove fragments and repetitive sequences that mapped to exons or introns. Clean tags were aligned to the fungal miRBase database (Release 22) to identify known miRNAs using Bowtie (version 1.1.2). Subsequently, the remaining unaligned tags were compared against miRNA sequences from other species within miRBase, applying a filter that required alignment to precursor sequences while excluding matches beyond the 2 bp extensions of the mature miRNA. The novel miRNA candidates were identified by mirDeep2 based on their genome positions and predicted hairpin structures, after excluding all tags matching known miRNAs, miRNA editing variants, mRNA degradation fragments, repetitive regions, and other non-coding RNAs (including rRNA, scRNA, snoRNA, snRNA, and tRNA) (Mackowiak 2011). miRNA target mRNAs were identified by patmatch (Version 1.2). The transcripts per million (TPM) value was calculated with the following formula: TPM = Actual miRNA counts/Total counts of clean tags × 10^6^. Correlation coefficients and PCA were assessed as for mRNA (see section 2.5 above). We identified miRNAs with a fold change > 2 and P < 0.05 in a comparison as significant differentially expressed miRNAs.
Enrichment analysis
Gene ontology (GO) enrichment analysis and Kyoto Encyclopedia of Genes and Genomes (KEGG) pathway analysis were performed on differentially expressed mRNAs, lncRNAs target mRNAs, miRNAs target mRNAs and ceRNA target mRNAs. For GO enrichment analysis, all differentially expressed genes (DEGs) were mapped to GO terms (http://www.geneontology.org/). The number of genes associated with each term was calculated. GO terms that were significantly enriched in the DEGs compared to the expressed gene universe were identified using a hypergeometric test. Pathway enrichment analysis identified significantly enriched metabolic pathways or signal transduction pathways in DEGs comparing with the expressed gene universe as background gene sets. GO terms and KEGG pathways with FDR ≤ 0.05 were considered significantly enriched. Subsequently, GO enrichment analysis and KEGG pathway analysis were performed on a set of genes by using the Gene Set Enrichment Analysis (GSEA) (Subramanian et al. 2005). Gene sets with |NES| > 1, NOM p-val < 0.05, and FDR q-val < 0.25 were considered differentially expressed.
Orthology-inferred Protein-Protein interaction (PPI)
PPI analysis was performed using the STRING v10 database and visualized in Cytoscape (v3.7.1) (Szklarczyk et al. 2015). Since STRING does not contain specific PPI data for T. mentagrophytes, an orthology-based approach was employed. Protein sequences of T. mentagrophytes were mapped to the Saccharomyces cerevisiae reference proteome using reciprocal best BLAST hit orthology inference. The resulting orthology-inferred PPI network was analyzed to identify putative functional modules and hub proteins. Putative hub genes were identified by intersecting the top-ranked candidates from the cytoHubba plugin (evaluated by Degree, Edge Percolated Component (EPC), Eccentricity, and Maximum Neighborhood Component algorithms (MNC)) with key modules derived from Molecular Complex Detection (MCODE) analysis in Cytoscape. The resulting protein-protein interaction network was constructed based on these high-confidence hub genes (Shannon et al. 2003).
Construction and analysis of candidate lncRNA – miRNA – mRNA network (ceRNA)
CeRNA refers to the pool of transcripts (such as mRNA and lncRNA) that can competitively sequester miRNA activity. Based on the same miRNA response elements (MREs), candidate ceRNA networks between lncRNAs, mRNAs, and miRNA were constructed by assembling differentially expressed mRNAs, lncRNAs and miRNAs. Depending on differentially expressed mRNAs, lncRNAs, and miRNAs, expression correlation between mRNA-miRNA or lncRNA-miRNA with a Spearman Rank correlation coefficient (SCC) ≤ -0.7 were identified as negatively co-expressed lncRNA-miRNA pairs or mRNA-miRNA pairs. Expression correlation between lncRNA-mRNA with a Pearson correlation coefficient (PCC) > 0.9 were selected as co-expressed lncRNA-mRNA pairs. The potential lncRNA-mRNA-miRNA pairs with p-values less than 0.05 (without multiple-testing correction) in the above analysis were screened by the hypergeometric distribution test to obtain the final ceRNA pairs. All co-expressed competing triplets were then assembled to construct ceRNA and visualized with Cytoscape software (v3.6.0). The number of co-expressed targeted miRNAs was defined as the RNA connectivity to identify hub genes.
qRT-PCR validation
To validate the RNA-seq results, quantitative real-time polymerase chain reaction (qRT-PCR) was conducted for four randomly selected differentially expressed mRNAs, four differentially expressed lncRNAs, and six differentially expressed miRNAs. Total RNA was extracted from spores and hyphae, followed by reverse transcription to cDNA with ReverRra Ace qPCR RT Master Mix (Toyobo, Osaka, Japan). Next, qRT-PCR was conducted with PowerUpTM SYBRTM Green Master Mix (Applied Biosystems, Thermo Fisher Scientific, Waltham, MA, USA). Briefly, the reaction volume contained 5 μL of SYBR Green Master Mix, 1 μL of 10 μM forward and reverse primers, 1 μL of template cDNA, and 3 μL of dH_2_O in a final volume of 10 μL. The reactions were performed on a QuantStudio 5 PCR System (Applied Biosystems, Thermo Fisher Scientific) as follows: 50 °C for 2 min and 95 °C for 2 min, followed by 40 cycles of 95 °C for 1 s and 60 °C for 30 s. A melt curve analysis was performed at 95 °C for 1 s, 60 °C for 20 s, and 95 °C for 1 s. No-template controls and no-reverse transcription controls were included in every qPCR run to monitor contamination. None of these controls showed specific amplification, confirming the specificity and reliability of the experimental results. The amplification efficiency of all qPCR primers was validated via standard curves constructed from serially diluted cDNA templates (typically 2-fold or 10-fold dilutions). Amplification efficiency (E) was calculated using the formula E = (10^(-1/slope) - 1)*100%. The efficiency for all primers used fell within the range of 90%–110%, with R² values for the standard curves greater than 0.98, meeting the recommended criteria of the MIQE guidelines. All reactions produced a single sharp peak in the melt curve analysis, confirming amplification specificity without nonspecific amplification or primer-dimer formation. Three technical replicates were performed for each biological replicate. The Ct values of the three technical replicates for each biological replicate were first averaged to obtain a representative Ct value for that biological replicate. Subsequently, all group-based statistical analyses and data presentations were performed using these consolidated Ct values, each representing one biological replicate. The relative quantification of mRNAs, lncRNAs, and miRNAs was calculated by the 2^-ΔΔCt^ method using chs and U6 as the internal reference (Livak and Schmittgen 2001). The stability of the reference genes chs and U6 was evaluated using the geNorm and NormFinder software. Their expression remained stable across all experimental conditions, with an M value less than 0.5, confirming their suitability as references for data normalization.
Statistical analyses
Statistical analyses were performed using SPSS Statistics 20.0 (SPSS Inc., Chicago, IL, USA). Unless otherwise specified, values are expressed as the mean ± standard error of the mean (SEM). P < 0.05 was considered statistically significant.
Abbreviations
lncRNAs Long non-coding RNAs
miRNAs Micro RNAs
ceRNA Competing endogenous RNA
cDNA Complementary DNA
scRNA Small cytoplasmic RNA
rRNA Ribosomal RNA
snoRNA Small nucleolar RNA
snRNA Small nuclear RNA
tRNA Transfer RNA
mRNA Messenger RNA
** * T. mentagrophytes * ** * Trichophyton mentagrophytes *
qRT-PCR Quantitative real-time polymerase chain reaction
RNA-seq RNA sequencing
RISC RNA-induced Silencing Complex
UTR Untranslated region
PAGE Polyacrylamide gel electrophoresis
FPKM Fragment per kilobase of transcript per million mapped reads
PCA Principal component analysis
FDR False discovery rate
TPM Transcripts per million
GO Gene ontology
KEGG Kyoto Encyclopedia of Genes and Genomes
GSEA Gene Set Enrichment Analysis
PPI Protein-Protein interactio
EPC Edge Percolated Component
MNC Maximum Neighborhood Component
MCODE Molecular Complex Detection
MREs MiRNA response elements
SCC Spearman Rank correlation coefficient
PCC Pearson correlation coefficient
SEM Standard error of the mea
MAPK Mitogen-activated protein kinase
Results
Germination of T.
mentagrophytes spores
Germination of T. mentagrophytes spores progressed through two distinct phases: swelling and germ tube formation. Dormant spores displayed a rounded or oval morphology (Fig. 1A). Within 6 hours of incubation, spore swelling commenced, resulting in an approximate doubling of cellular diameter. Concurrently, polarized growth was initiated at one site on the spore surface (Fig. 1B). By 12 hours, the germ tube emergence phase was evident, characterized by the protrusion of a single germ tube (Fig. 1C). Extensive growth of multiple germ tubes, culminating in hyphal formation, was observed by 18 hours (Fig. 1D; Suppl. material 1: fig. S1).
T. mentagrophytes observed by optical microscopy during germination. A. 0 h, B. 6 h, C. 12 h, D. 18 h. Scale bar: 10 μm.
Overview of RNA-sequencing
To characterize the expression profiles and co-expression networks of mRNAs, lncRNAs, and miRNAs during T. mentagrophytes germination, cDNA and small RNA libraries were constructed and subjected to high-throughput sequencing.
For the lncRNA-mRNA transcriptome, 1,567,771,788 high-quality clean reads (Q30 > 93%) were retained after filtering raw data (1,570,717,414 reads; Suppl. material 2: table S1). Base composition and coverage analyses indicated uniform genomic distribution without 3′/5′ bias, with > 77% of reads exhibiting ≥ 80% gene coverage (Fig. 2A, B). Sequencing saturation analysis confirmed adequate depth for capturing expressed genes (Suppl. material 1: fig. S2).
Assessment of sequencing data quality and genome coverage for spore and hyphal samples. A. Distribution of Genes’ Coverage of spore sample represented the percentage of each gene covered by reads. B. Distribution of Genes’ Coverage of hyphal sample represented the percentage of each gene covered by reads. The different colors in the figure represent the proportion of genes that have a certain coverage range. C. Tags length distribution of spore sample. D. Tags length distribution of hyphal sample.
Small RNA sequencing yielded 136,978,282 clean reads (Suppl. material 2: table S1), with distinct size distributions: 22-nt RNAs dominated in spores, whereas 23-nt RNAs were predominant in hyphae (Fig. 2C, D). After removing known non-coding RNAs in GeneBank (rRNA, scRNA, snoRNA, snRNA, and tRNA), 80,548,874 unmapped tags were retained (Suppl. material 1: fig. S3A). Subsequent genome alignment identified 102,779,029 mapped tags, including 7,548,666 exon-matching tags (Suppl. material 1: fig. S3B, C), with no repeat sequence matches detected (Suppl. material 1: fig. S3D). Collectively, these results demonstrate high-quality, reproducible sequencing data suitable for downstream bioinformatic analyses.
Analysis of mRNAs
Identification and characterization of mRNAs
To identify unannotated transcripts, we performed de novo transcriptome assembly using StringTie. Alignment of reconstructed transcripts to the T. mentagrophytes genome revealed 8,059 mRNAs, comprising 7,554 known and 505 novel transcripts (Suppl. material 2: table S2). Expression levels were quantified using FPKM (Fig. 3A), and violin plots demonstrated distinct mRNA expression patterns between spores and hyphae (Fig. 3B). Principal component analysis (PCA) and correlation analysis further confirmed clear separation between spore and hyphal groups (Fig. 3C, D).
Quality assessment and differential expression analysis of the mRNA sequencing data. A. FPKM distribution. B. Gene expression violin plot. p = 1.76E-10**. C. Sample principal component analysis (PCA). PC 1 and PC 2 coordinates represented the first and second principal components, respectively, and the percentages in parentheses represented their respective contributions to the sample difference. D. Sample correlation heat map. The horizontal and vertical coordinates in the graph were for each sample, and the shade of the color indicated the magnitude of the correlation coefficient between the two samples (blue, high correlation. white, low correlation. E. Volcano plot of mRNAs. The horizontal coordinate denoted the log value of the multiplicative difference between the two groups, and the vertical coordinate represented the FDR negative log10 value of the difference between the two groups (red, up-regulated expression. blue, down-regulated expression). F. Differential comparison cluster heatmap. Each column represented one sample, each row represented one mRNA, and mRNAs in different samples were denoted by red (higher expression) and blue (lower expression).*
Differential expression analysis (FDR < 0.05, |log2FC| > 1) identified 3,193 significantly differentially expressed mRNAs, including 692 up-regulated and 2,501 down-regulated transcripts in hyphae compared to spores (Suppl. material 2: table S2). Notably, the most highly up-regulated mRNAs included SRY1 (g3940), YIL010W (g3025), and alg2 (g3846), while the most strongly down-regulated transcripts included g566, g5885, and crmD (g3749) (Fig. 3E). Hierarchical clustering of differentially expressed mRNAs clearly distinguished spore and hyphal samples, with high reproducibility among biological replicates (Fig. 3F).
Functional enrichment analysis of mRNAs
Functional enrichment analysis of differentially expressed mRNAs revealed significant enrichment in 292 functional categories (P < 0.05), comprising 31 cellular component terms (Fig. 4A; Suppl. material 2: table S3), 57 molecular function terms (Fig. 4B; Suppl. material 2: table S3), and 204 biological process terms (Fig. 4C; Suppl. material 2: table S3). Notably enriched terms included fungal-type cell wall organization, vacuolar lumen, membrane anchoring components, DNA-binding transcription factor activity (RNA polymerase II-specific), glucan exo-1,3-beta-glucosidase activity, cellular amino acid metabolism, pigment biosynthesis, mitochondrial transcription, and fructose 1,6-bisphosphate metabolism, suggesting these mRNAs play crucial roles in sporulation and biosynthetic processes.
GO and KEGG classification of mRNAs. A. The top 20 enriched GO terms of the cellular component. B. The top 20 enriched GO terms of the molecular function. C. The top 20 enriched GO terms of the biological process. D. P-value heatmap of KEGG enrichment. S refers to the spore group and H refers to the hyphal group. The colour scale indicates p - values. Darker colours indicate more significant enrichment.
KEGG pathway analysis further identified 18 significantly enriched metabolic pathways (P < 0.05; Fig. 4D; Suppl. material 2: table S3). The predominant pathways included: Amino acid metabolism, Carbohydrate metabolism, Energy metabolism, Lipid metabolism, and Metabolism of cofactors and vitamins. These findings strongly implicate the differentially expressed mRNAs in fundamental biosynthetic and metabolic processes critical for fungal development.
Gene set enrichment analysis of mRNAs
To elucidate the functional relevance of non-significant differentially expressed mRNAs, Gene Set Enrichment Analysis (GSEA) was performed. This revealed significant enrichment of 755 GO terms (Suppl. material 2: table S4) and 23 KEGG pathways (Suppl. material 2: table S4) (|NES| > 1, NOM p < 0.05). Upregulated GO terms predominantly implicated mitotic processes, including spindle midzone, microtubule polymerization, mitotic spindle midzone, microtubule polymerization or depolymerization, nucleus localization, and mitotic sister chromatid segregation (Fig. 5A). Conversely, downregulated GO terms were enriched for amino acid biosynthesis (e.g., methionine biosynthetic process, cysteine biosynthetic process, sulfur amino acid biosynthetic process, proline biosynthetic process, arginine biosynthetic process, and leucine biosynthetic process) and mitochondrial ribosome assembly (e.g., mitochondrial small ribosomal subunit) (Fig. 5B). KEGG analysis further demonstrated that upregulated pathways were linked to spore germination/early outgrowth and cell division (DNA replication, Cell cycle – yeast, and Meiosis – yeast; Fig. 5C), while downregulated pathways centered on amino acid metabolism (Biosynthesis of amino acids, Arginine biosynthesis, Valine, leucine and isoleucine biosynthesis, Phenylalanine, tyrosine and tryptophan biosynthesis) and central carbon metabolism (Terpenoid backbone biosynthesis, Alanine, aspartate and glutamate metabolism, 2-Oxocarboxylic acid metabolism, and Citrate cycle (TCA cycle); Fig. 5D). Collectively, during T. mentagrophytes germination, upregulated genes drive cell division and cytoskeletal reorganization, whereas downregulated genes suppress anabolic processes including amino acid and terpenoid biosynthesis.
GSEA of differentially expressed mRNAs. In GO - based list, spindle midzone was enriched in hyphal groups (A) and methionine biosynthetic process was enriched in spore groups (B). In KEGG - based list, DNA replication was enriched in hyphal groups (C) and Biosynthesis of amino acids was enriched in spore groups (D).
Protein-protein interaction network analysis of mRNAs
To identify functionally significant protein-protein interactions (PPI) among differentially expressed mRNAs, a PPI network was constructed using the STRING database and visualized in Cytoscape. The network comprised 1,278 nodes and 9,124 edges (Suppl. material 2: table S5). Hub genes were prioritized through intersection analysis of four topological algorithms (Degree, EPC, Eccentricity, and MNC), identifying g2724 (mrps28), g4817 (rps23), and g590 (yml6) as the top three candidates (Fig. 6A). Subsequent MCODE clustering revealed 16 significant modules (Suppl. material 2: table S5), with the three highest-scoring clusters being Cluster 1 (51 nodes, 1,204 edges; MCODE score = 48.16), Cluster 2 (20 nodes, 160 edges; score = 16.842), and Cluster 3 (18 nodes, 141 edges; score = 16.588) (Fig. 6B–D).
Protein-protein interaction network analysis of mRNAs. A. Identification of hub genes by four algorithms (Degree, EPC, Eccentricity, and MNC). B–D. Three representative clusters. Red indicated up-regulated genes, blue indicated down-regulated genes.
Analysis of lncRNAs
Identification and characterization of lncRNAs
Transcriptome assembly was performed using StringTie, followed by comprehensive protein-coding potential assessment through the intersection of FEELnc, CNCI, and CPC2 analyses. This approach identified 3,961 high-confidence lncRNAs, comprising 34 known and 3,927 novel transcripts (Fig. 7A; Suppl. material 2: table S6). Based on their genomic positions relative to protein-coding genes, the lncRNAs were categorized as: 173 sense, 2,367 antisense, 17 intronic, 732 bidirectional, 236 intergenic, and 436 other lncRNAs were identified (Fig. 7B). Transcript abundance, quantified by FPKM, revealed distinct lncRNA expression profiles (Fig. 7C). Violin plot analysis further demonstrated significantly higher lncRNA expression in hyphae compared to spores (Fig. 7D), suggesting potential regulatory roles during fungal growth and development.
Identification and characterization of lncRNAs. A. Identification of novel lncRNAs. B. lncRNA type. C. FPKM distribution. D. lncRNA expression violin plot. p = 6.17E-147**.*
Identification and analysis of differentially expressed lncRNAs
Comparative analysis between spore and hyphal groups identified 409 differentially expressed lncRNAs (FDR < 0.05, |log2FC| > 1), with 213 upregulated and 196 downregulated transcripts (Suppl. material 2: table S6). Notably, the most significantly upregulated lncRNAs included MSTRG.953.1, MSTRG.5357.1, and MSTRG.6276.1, while the most downregulated were MSTRG.4481.2, MSTRG.9634.1, and MSTRG.8374.1 (Fig. 8A).
Analysis of differentially expressed lncRNAs. A. Volcano plot of lncRNAs. B. Principal component analysis. C. Heatmap of differentially expressed lncRNAs.
PCA revealed clear separation between spore and hyphal groups (Fig. 8B), confirming distinct lncRNA expression patterns. This differential expression profile was further supported by hierarchical clustering analysis, where the six samples consistently grouped according to their developmental stages (Fig. 8C). The robust segregation observed in both PCA and heatmap analyses underscores the stage-specific regulation of lncRNAs during fungal morphogenesis.
Functional enrichment analysis of antisense lncRNAs
Emerging evidence suggests lncRNAs may regulate DNA demethylation, transcription, and mRNA stability through antisense mechanisms (Liu et al. 2021). Our RNAplex analysis identified 99 high-confidence antisense binding pairs between 97 differentially expressed antisenselncRNAs and their corresponding target mRNAs (Suppl. material 2: table S7). Functional annotation of these target mRNAs revealed significant enrichment in 138 GO terms (P < 0.05), including: 18 cellular component terms (e.g., novel mitotic spindle pole body, structural constituent of cell wall) (Fig. 9A; Suppl. material 2: table S7), 24 molecular function terms (including G protein-coupled receptor kinase activity, AMP-activated protein kinase activity, and glutaminase activity) (Fig. 9B; Suppl. material 2: table S7), and 105 biological process terms (particularly positive regulation of G2/M transition, establishment of cell polarity, and differentiation-related morphogenesis) (Fig. 9C; Suppl. material 2: table S7). These findings strongly suggest antisense lncRNAs play crucial roles in mitotic regulation and spore activation. KEGG pathway analysis further supported these observations, with enrichment in: Yeast MAPK signaling pathway, Eukaryotic ribosome biogenesis, Yeast cell cycle regulation, Oxidative phosphorylation, Amino acid biosynthesis, and Secondary metabolite biosynthesis (Fig. 9D; Suppl. material 2: table S7). The coordinated enrichment of these pathways highlights the potential involvement of antisense lncRNAs in fundamental cellular processes during fungal development and morphogenesis.
GO and KEGG classification of antisenselncRNAs – target mRNAs. A. Top 20 GO terms enriched by cellular components. B. Top 20 GO terms enriched by molecular function. C. Top 20 GO terms enriched by biological process. D. Top 20 pathways of KEGG enrichment analysis.
Functional enrichment analysis of cis-lncRNAs
Previous studies have established that lncRNAs can cis-regulate adjacent genes on the same allele (Yan et al. 2017). Applying a 10 kb genomic window (upstream or downstream) to identify potential cis-regulatory lncRNAs, we identified 1,158 significant cis-interactions involving 389 differentially expressed lncRNAs and 950 target mRNAs (Suppl. material 2: table S8).
Functional enrichment analysis of these cis-regulated target mRNAs revealed significant enrichment in 160 functional categories (P < 0.05), comprising: 28 cellular component terms (e.g., fungal-type vacuole lumen, cell wall components), 50 molecular function terms (including fructose-bisphosphate aldolase activity, G protein-coupled peptide receptor activity, and ATP citrate synthase activity), and 82 biological process terms (notably fungal-type cell wall disassembly during cellular fusion, fructose 1,6-bisphosphate metabolism, and cell cycle regulation) (Fig. 10A–C; Suppl. material 2: table S8). These enriched terms strongly implicate cis-acting lncRNAs in critical developmental processes, particularly hyphal formation and spore activation. KEGG pathway analysis further demonstrated enrichment in key metabolic pathways (P < 0.05), including: Amino acid metabolism (tryptophan, valine/leucine/isoleucine biosynthesis), Carbohydrate metabolism (fructose and mannose), Energy metabolism (oxidative phosphorylation) (Fig. 10D; Suppl. material 2: table S8). Collectively, these findings demonstrate that cis-acting lncRNAs participate in fungal development by locally regulating genes involved in cell wall remodeling, metabolic reprogramming, and cellular differentiation during hyphae formation and spore activation.
GO and KEGG classification of cis-lncRNAs target mRNAs. A. The top 20 enriched GO terms of the cellular component. B. The top 20 enriched GO terms of the molecular function. C. The top 20 enriched GO terms of the biological process. D. Top 20 of KEGG enrichment analysis.
Functional enrichment analysis of trans-lncRNAs
In addition to cis-regulation, lncRNAs can modulate gene expression through trans-acting mechanisms (Yan et al. 2017). Our analysis identified 247,586 significant co-expression relationships between 409 differentially expressed lncRNAs and 3,138 target mRNAs (Suppl. material 2: table S9). Functional enrichment of these trans-regulated targets revealed significant associations (P < 0.05) with key biological processes, including: 30 cellular component terms (e.g., fungal-type cell wall, vacuolar lumen, hyphal cell wall), 53 molecular function terms (such as L-amino acid transmembrane transporter activity and DNA-binding transcription factor activity), and 192 biological process terms (including alpha-amino acid metabolic process, pigment biosynthetic process, and adhesion of symbiont to host) (Fig. 11A–C; Suppl. material 2: table S9). KEGG pathway analysis further identified 17 significantly enriched metabolic pathways (P < 0.05), notably encompassing amino acid biosynthesis (tryptophan, arginine/proline, and branched-chain amino acids), carbohydrate metabolism (fructose and mannose), lipid metabolism (glycerolipids metabolism), and cofactor synthesis (pantothenate and CoA biosynthesis) (Fig. 11D; Suppl. material 2: table S9). These comprehensive findings demonstrate that trans-acting lncRNAs likely orchestrate fungal development by globally regulating genes involved in cell wall organization, metabolic reprogramming, and host-microbe interactions.
GO and KEGG classification of trans-lncRNAs target mRNAs. A. The top 20 enriched GO terms of the cellular component. B. The top 20 enriched GO terms of the molecular function. C. The top 20 enriched GO terms of the biological process. D. Top 20 of KEGG enrichment analysis.
Analysis of miRNAs
Identification and characterization of miRNAs
Our small RNA sequencing analysis identified 733 known miRNAs (miRBase-matching sequences) through alignment with the miRBase database (Suppl. material 2: table S10) and predicted 52 novel miRNAs based on genomic positioning and hairpin structure analysis (Suppl. material 2: table S10). Both known and novel miRNAs exhibited a characteristic 5’ uracil bias in the 18–25 nt size range across spore and hyphal stages (Suppl. material 1: fig. S4A–D), with position-specific nucleotide preferences consistent with canonical miRNA features (Suppl. material 1: fig. S4E–H). Comprehensive annotation of 129,717,858 small RNA tags revealed diverse RNA species, including 44.5 million rRNAs, 7.5 million exon-mapping sequences, 574,139 known miRNAs, and 38,066 novel miRNAs (Suppl. material 1: fig. S5A). Notably, TPM-based expression analysis revealed significant differences in miRNA abundance between spores and hyphae (Suppl. material 1: fig. S5B), suggesting stage-specific regulatory roles during fungal development.
Identification and analysis of differentially expressed miRNAs
PCA revealed distinct clustering patterns between spore and hyphal groups for both known and novel miRNAs (Fig. 12A, B). Differential expression analysis identified 119 significantly differentially expressed miRNAs (P < 0.05, |log2FC| > 1), comprising 56 upregulated and 63 downregulated species (Suppl. material 2: table S10). Notably, novel-m0011-5p, miR2109-z, and novel-m0019-5p emerged as the most strongly upregulated miRNAs, while miR319-y, miR-12295-x, and miR6149-x showed the most pronounced downregulation (Fig. 12C). Hierarchical clustering of these differentially expressed miRNAs clearly distinguished hyphal from spore samples (Fig. 12D), demonstrating robust stage-specific miRNA expression profiles during fungal development.
Identification and characterization of miRNAs. A. PCA of known miRNAs. B. PCA of novel miRNAs. C. Volcano plot of miRNAs. D. Heatmap of differentially expressed miRNAs.
Functional enrichment analysis of miRNAs
Through comprehensive target prediction, we identified 8,662 mRNAs potentially regulated by 785 miRNAs, encompassing 626,128 target sites (Suppl. material 2: table S11). Functional enrichment analysis of these miRNA-targeted mRNAs revealed significant associations (P < 0.05) with 19 functional categories, including plasma membrane (cellular component), transferase/oxidoreductase activity (molecular function), and key biological processes such as multi-organism reproduction, growth, and mitotic cell cycle regulation (Fig. 13A–C; Suppl. material 2: table S11). KEGG pathway analysis further demonstrated enrichment in 140 metabolic and signaling pathways, most notably biosynthesis-related processes, including secondary metabolites, amino acids, and cofactors, as well as ribosome biogenesis and yeast MAPK signaling (Fig. 13D; Suppl. material 2: table S11). These findings strongly suggest that miRNAs play a pivotal role in coordinating fungal growth, development, and metabolic adaptation through widespread post-transcriptional regulation.
GO and KEGG classification of miRNAs target mRNAs. A. Top 20 GO terms enriched by cellular components. B. Top 20 GO terms enriched by molecular function. C. Top 20 GO terms enriched by biological process. D. Top 20 pathways of KEGG enrichment analysis.
Analysis of ceRNAs
Construction of a candidate ceRNA network
Through comprehensive target prediction, we identified 34,680 miRNA-mRNA and 3,227 miRNA-lncRNA interaction pairs involving 119 differentially expressed miRNAs, 3,177 mRNAs, and 403 lncRNAs. Using stringent correlation thresholds (SCC ≤ -0.7 for negative co-expression and PCC > 0.9 for ceRNA pairs), we derived 229,789 potential ceRNA interactions between 2,911 mRNAs and 338 lncRNAs. For statistical screening of high-confidence pairs, we performed hypergeometric testing and retained interactions with an uncorrected P-value < 0.05 (note: multiple-testing correction such as FDR adjustment was not applied in this step), ultimately yielding a candidate network comprising 14,360 significant ceRNA pairs, integrating 2,627 mRNAs, 107 miRNAs, and 329 lncRNAs (Suppl. material 2: table S12). Topological analysis revealed 636 hub nodes in the primary network tier, with the highest connectivity observed for five mRNAs (glt1, dtxS1, g3795, SPBC20F10.07, and MSTRG.440) and five lncRNAs (MSTRG.9453.1, MSTRG.2311.1, MSTRG.2710.1, MSTRG.3534.1 and MSTRG.8002.1), along with their miRNA partners (Fig. 14), highlighting central regulators in the fungal ceRNA network.
The highest connectivity for 5 mRNAs and 5 lncRNAs. Red represented mRNAs, yellow represented lncRNAs, and blue represented miRNAs.
Exploratory enrichment analysis of ceRNAs
Functional annotation of ceRNA-related mRNAs revealed significant enrichment (uncorrected P-values < 0.05) in 286 categories (32 cellular components, 68 molecular functions, and 186 biological processes), including fungal-type vacuole lumen, fungal-type cell wall, hyphal cell wall, L-amino acid transmembrane transporter activity, DNA-binding transcription factor activity, L-amino acid transport, methionine metabolic process, and cellular amino acid biosynthetic process (Fig. 15A–C; Suppl. material 2: table S12). KEGG pathway analysis further identified 18 significantly enriched metabolic pathways (uncorrected P-values < 0.05), with predominant representation in amino acid biosynthesis (tryptophan), secondary metabolite production, and central carbon metabolism (glycerolipid and pyruvate metabolism) (Fig. 15D; Suppl. material 2: table S12). These findings provide preliminary clues that lncRNAs modulate fungal development and metabolism through miRNA-mediated ceRNA networks, competitively regulating mRNAs involved in cell wall dynamics and metabolic reprogramming.
GO and KEGG classification of ceRNA-related mRNAs. A. Top 20 GO terms enriched by cellular components. B. Top 20 GO terms enriched by molecular function. C. Top 20 GO terms enriched by biological process. D. Top 20 pathways of KEGG enrichment analysis.
qRT-PCR verification of the RNA-Seq results
To validate the RNA sequencing data, qRT-PCR was performed on a randomly selected panel of differentially expressed mRNAs, lncRNAs, and miRNAs using primers designed via Primer-BLAST (Suppl. material 2: table S13). Expression trends of mRNAs and lncRNAs exhibited significant concordance with RNA-seq profiles (Fig. 16; Suppl. material 2: table S13). Among miRNAs, miR-150-x showed significant upregulation during germination, whereas three others were down-regulated (Fig. 16). Critically, the positive correlation between up-regulated lncRNA-MSTRG.10182.6 and up-regulated target gene ro-4 aligned with the predicted ceRNA network interaction. These results collectively confirm the reliability of our transcriptomic data and the accuracy of identified expression dynamics.
*qRT-PCR verification of the RNA-Seq Results. Upper panel, mRNAs. Middle panel, lncRNAs. Lower panel, miRNAs. Data are shown as mean ± SEM. *p < .05, **p < .01, ***p < .001 and ***p < .0001.
Discussion
The transition from dormant spores to invasive hyphae in dermatophytes (e.g., Trichophyton rubrum, T. mentagrophytes) is orchestrated by multilayered molecular controls, including transcriptional, post-transcriptional, and epigenetic regulation. This process involves dynamic interactions between mRNAs, miRNAs, and lncRNAs, which collectively fine-tune fungal development and pathogenicity (Liu et al. 2007; Wang et al. 2018; Zhang et al. 2023). In the present study, we present a comprehensive transcriptomic landscape of the spore-to-hypha transition in T. mentagrophytes by deploying multi-stage RNA-seq. We systematically profiled the dynamic expression of stage-specific mRNAs, lncRNAs, and miRNAs throughout this critical morphogenetic process. Furthermore, we constructed putative competing endogenous RNA (ceRNA) networks to elucidate the post-transcriptional crosstalk mediated by lncRNAs.
This study represents a significant expansion beyond our earlier circRNA-focused investigation (Zhang et al. 2023). While that work laid the groundwork by identifying circRNAs as potential regulatory elements, the present multi-transcriptome analysis substantially broadens the regulatory landscape by integrating mRNA, lncRNA, and miRNA expression dynamics. This more holistic perspective has been crucial, as it enabled us to move beyond the role of individual RNA species and uncover their complex interactions within putative ceRNA networks. Consequently, our current work provides a first systems-level view of the transcriptional circuitry governing dermatophyte morphogenesis.
Germination dynamics and transcriptional reprogramming
The germination of T. mentagrophytes spores progresses through distinct morphological phases: initial spore swelling (0–6 h), germ tube emergence (12 h), and hyphal maturation (18 h), consistent with previous reports in Aspergillus nidulans and Candida species (Osherov and May 2000; Rampitsch et al. 2012). During the spore swelling phase, dormant spores undergo rapid water uptake and expansion, doubling their cell diameter (approximately 2–3 μm in diameter), while establishing cellular polarity to prepare for subsequent polarized growth. This stage is accompanied by rapid activation of energy metabolism and cell wall reorganization. Our transcriptomic data reveal that spore swelling is associated with significant upregulation of genes related to glycolysis and oxidative phosphorylation (e.g., pfkA and cox5) (Cumsky et al. 1983; Li et al. 2021), providing the necessary ATP supply for germination. Concurrently, changes in the expression of chitin synthase (e.g., CHS2 and chsG) and β-glucanase genes (e.g., ARB_04467) indicate dynamic cell wall remodeling to accommodate volumetric expansion (Mellado et al. 2003; Wu et al. 2024).
Upon entering the germ tube formation phase, the spore breaches its cell wall at a specific site to form a single germ tube, which ultimately develops into a mature hyphal network. This process heavily relies on cytoskeletal rearrangement and vesicular trafficking systems. Our study found that genes significantly upregulated during germ tube formation primarily involve microtubule polymerization (e.g., tubB), actin cytoskeleton regulation (e.g., myo2), and vesicle transport (e.g., sec11 and sec27) (Govindan et al. 1995; Oakley 2004; Karnik et al. 2015; Friend et al. 2018). The gene expression patterns observed during this morphological transition share similarities with yeast filamentation, yet T. mentagrophytes exhibits stronger expression of environmental adaptation and virulence-related genes.
The observed doubling in spore diameter prior to germ tube emergence suggests substantial metabolic activation, likely involving cell wall remodeling and nutrient uptake, as seen in Neurospora crassa (Bowman et al. 2006; Maddi et al. 2009). RNA-seq analysis revealed 3,193 differentially expressed mRNAs (692 upregulated, 2,501 downregulated), with functional enrichment highlighting fungal-type cell wall organization, amino acid metabolism, and mitochondrial transcription. These findings align with studies in Aspergillus fumigatus, where germination involves rapid activation of cell wall synthases and metabolic enzymes (Bleichrodt et al. 2020). The strong downregulation of amino acid biosynthetic pathways (e.g., methionine, cysteine, and leucine biosynthesis) suggests a shift from anabolic processes to catabolic utilization of stored nutrients, a strategy also observed in Magnaporthe oryzae (Fernandez et al. 2014; Fernandez and Wilson 2014). Conversely, upregulated genes were enriched in mitotic processes (e.g., spindle midzone assembly, microtubule polymerization), consistent with the transition from dormancy to active growth (Harris 2005).
LncRNAs orchestrate developmental transitions through multilayered regulation
Cis-regulatory mechanisms and their functions
We identified 389 differentially expressed lncRNAs in T. mentagrophytes that may regulate neighboring genes in cis (within a 10 kb window). These lncRNAs formed 1,158 significant regulatory pairs with 950 target mRNAs. Functional enrichment analysis revealed that cis-regulated target genes were significantly associated with pathways such as: cell wall remodeling (e.g., exgD), fructose metabolism (e.g., fructose-1,6-bisphosphate aldolase FBA1), and cell cycle regulation (e.g., G2/M phase regulators CDC2 and cdcA) (Cieśla et al. 2014; Liu et al. 2015). For example, MSTRG.7978.1, located upstream of the cell wall remodeling related gene-exgD, was highly upregulated during hyphal growth, and its expression strongly correlated with exgD, suggesting it may activate exgD via chromatin remodeling to regulate cell wall synthesis at hyphal tips.
Cis-acting lncRNAs may function through multiple mechanisms: some directly bind to promoter regions of nearby genes by forming RNA-DNA triplex structures, and others act as protein scaffolds, recruiting transcription factors or chromatin-modifying complexes (Nahkuri and Paro 2012; Li et al. 2016). For instance, MSTRG.2464.1, adjacent to the fructose-1,6-bisphosphate aldolase FBA1, may enhance histone H3K27 acetylation at the target promoter by interacting with a histone acetyltransferase complex, thereby activating sugar metabolism-related genes (Cieśla et al. 2014). This mechanism resembles lncRNA SABC1 in plants, which recruits the PRC2 complex to regulate the neighboring gene NAC3 (Liu et al. 2022b). In Fusarium graminearum, lncRNA RNA5P also cis-regulates the trichothecene toxin gene TRI5 via Tri6 transcription factor binding (Huang et al. 2024).
Trans-regulatory networks and their functions
Through genome-wide co-expression analysis, we constructed a trans-regulatory network comprising 247,586 interactions, involving 409 differentially expressed lncRNAs and 3,138 target mRNAs. These trans-acting lncRNAs primarily regulate pathways related to Amino acid transmembrane transport (e.g., gamma-aminobutyric acid and delta-aminolaevulinic acid permease gene UGA4), Pigment synthesis (e.g., cellular division, branching, and conidiation gene aspB), and adhesion of symbiont to host (e.g., cell-cell adhesion gene stuA) (Westfall and Momany 2002; Luzzani et al. 2007; Bitencourt et al. 2021). This global regulation resembles Blakeslea trispora, where the pheromone trisporic acid trans-activates terpenoid genes (ipi, carG, carRA, and carB) to boost β-carotene production during mating (Sun et al. 2012). Notably, multiple trans-acting lncRNAs were found to target key enzyme genes in the branched-chain amino acid biosynthesis pathway (Valine, leucine and isoleucine biosynthesis), with most genes showing downregulated expression (e.g., LEUA, ILV1, ILV6, ILV2, ilv-2, ilvC, leu2A, LEU4, and SDL1) (Orasch et al. 2019; Steyer et al. 2021; Steyer and Todd 2023). This phenomenon may reflect an adaptive metabolic shift in which hyphae preferentially uptake branched-chain amino acid directly via amino acid transporters in nitrogen-rich environments (e.g., liquid culture media), rather than relying on de novo synthesis.
The mechanisms of trans-regulation by lncRNAs are more complex: Some lncRNAs directly bind to target mRNAs via base-pairing, influencing their stability or translation efficiency. Others function as signaling hubs, integrating multiple regulatory pathways (Yoon et al. 2013; Chen and Kim 2024). For example, MSTRG.12869.1, which is highly expressed during hyphal growth, leads to downregulation of genes involved in L-amino acid transport (e.g., UGA4, ACG1, MUP1, uba2, fnx2, ilvC, leu2A, LEU4, and rhb1) (Chardwiriyapreecha et al. 2008; Kim et al. 2017; Karuppiah et al. 2023), suggesting a central role in nutrient acquisition. This global regulatory mechanism resembles lncLSTR in the liver, which modulates whole-body lipid metabolism via a TDP-43-mediated transcriptional network (Li et al. 2015).
miRNA-guided post-transcriptional control
Our discovery of 119 differentially expressed miRNAs species reveals an unappreciated layer of post-transcriptional regulation in T. mentagrophytes. The upregulation of miR-339-x in hyphae, along with their predicted targeting of cell cycle inhibitors (e.g., swi10), suggests miRNAs facilitate germ tube emergence by releasing cell cycle brakes (Rödel et al. 1997). Conversely, hyphal-downregulated miRNAs (e.g., miR 159-y) may permit expression of adhesion factors (e.g., stuA) critical for host colonization, akin to Histoplasma capsulatum (Saçar Demirci 2020; Bitencourt et al. 2021). The enrichment of miRNA targets in oxidoreductase activity and secondary metabolism further indicates roles in stress adaptation during host invasion.
Integrated ceRNA networks coordinate development
The ceRNA mechanism represents one of the pivotal regulatory modes of lncRNAs (Salmena et al. 2011). We constructed a candidate ceRNA network comprising 14,360 interaction pairs, involving 329 lncRNAs, 107 miRNAs, and 2,627 mRNAs. The network’s core hubs included 5 mRNAs (e.g., glt1, dtxS1) and 5 lncRNAs (e.g., MSTRG.9453.1, MSTRG.2311.1), all exhibiting exceptionally high connectivity (degree > 100). Functional enrichment analysis revealed that the candidate ceRNA networks were significantly associated with: fungal-type cell wall, L-amino acid transport, and Amino acid biosynthesis (e.g., methionine metabolism).
To validate the biological function of the ceRNA networks, we performed verification on the key putative ceRNA network (MSTRG.10182.6/miR-1388-y/ro-4) using qRT-PCR. The results demonstrated concurrent upregulation of both MSTRG.10182.6 and its target gene ro-4 (related to fungal growth) in hyphae, supporting the model wherein MSTRG.10182.6 sequesters miR-1388-y to relieve suppression of ro-4, thereby promoting fungal growth (Hirozumi et al. 1999). This regulatory pattern, reminiscent of linc-MD1's action, sequesters miR-133 and miR-135 to modulate the expression of transcription factors MAML1 and MEF2C, which activate muscle-specific genes (Cesana et al. 2011).
In the candidate ceRNA network, we identified a critical regulatory axis: MSTRG.5264.1/miR-302-y/CHS2, which plays a key role during the transition from spores to hyphae. In the spore stage, miR-302-y is highly expressed and suppresses the expression of CHS2, a gene involved in cell wall synthesis. In the hyphal stage, MSTRG.5264.1 is upregulated and acts as a “molecular sponge” to sequester miR-302-y, thereby relieving its repression on CHS2 and promoting cell wall synthesis (Wu et al. 2024). This regulatory mechanism resembles that of Fusobacterium nucleatum in colorectal cancer, where the upregulated lncRNA EVADR facilitates tumor metastasis (Lu et al. 2022). The similarity suggests that microbes may employ analogous RNA regulatory networks to adapt to different environments.
The putative ceRNA network is closely linked to epigenetic regulation. Our study revealed multiple putative ceRNA regulatory axes involved in modulating the expression of epigenetic-modifying enzymes (e.g., jhd1, DIM1 and jmj22) (Fang et al. 2007). For example, the MSTRG.12472.1/miR-7555-z/jhd1 axis regulates the expression of the histone demethylase gene jhd1. In the spore stage, high expression of jhd1 may remove specific histone modification marks (targeting H3K36me2), regulating the transcription of developmental genes. In the hyphal stage, the lncRNA MSTRG.11900.2 is downregulated, releasing its sequestration of miR-6149-x, thereby inhibiting jhd1 expression (Fang et al. 2007). This alters chromatin states and regulates genes essential for hyphal growth. This crosstalk between RNA-based regulation and epigenetic modulation parallels the lncRNA SABC1/PRC2/NAC3 pathway discovered in plant immunity (Liu et al. 2022b), suggesting that conserved regulatory logic operates across diverse biological systems.
Biological significance of key pathways and molecular targets
Dynamic reprogramming of amino acid metabolism
Amino acid metabolism undergoes significant dynamic reprogramming during spore germination. Our data reveal that amino acid biosynthesis-related genes are markedly downregulated in the hyphal stage, including key enzymes in the tryptophan (e.g., trpC, trp2 and trp4), cysteine (e.g., cys3, cysD and cysK), and phenylalanine (e.g., ARO4, PHA2 and aro2) synthesis pathways (Horng et al. 1989; Sousa et al. 2002; Hiraishi et al. 2008). This downregulation likely reflects two biological imperatives: (1) the rapid growth of hyphal tips requires carbon skeleton redistribution, shifting resources from amino acid synthesis to energy production; and (2) direct utilization of environmental amino acids is more energy-efficient than de novo synthesis, a strategy analogous to the metabolic adaptation observed in pathogenic fungi during host infection.
Notably, while amino acid biosynthesis genes are generally downregulated, certain critical nodes are subject to specific lncRNA-mediated regulation. For instance, the methionine synthase gene (MET6) is positively regulated by MSTRG.5357.1 within the ceRNA network, ensuring adequate supply of methyl donors to support both epigenetic modifications and protein translation during hyphal growth (Pascon et al. 2004; Chen et al. 2016). This precise regulatory mechanism parallels the lncLSTR-mediated modulation of systemic lipid homeostasis through the TDP-43/Cyp8b1/FXR/apoC2 cascade in the liver, demonstrating the conserved precision of lncRNA in metabolic regulation across biological systems (Li et al. 2015).
Coordination of cell cycle and morphogenesis
Spore germination requires precise coordination between cell cycle progression and morphogenesis. Our study revealed that cell cycle regulatory genes (e.g., CDC2, CDCA, wee1) are significantly upregulated during germ tube formation, co-expressed with genes involved in mitotic spindle assembly (e.g., AUR1) and sister chromatid separation (e.g., Bub1) (Hashida-Okado et al. 1996; Elowe 2011; Masuda et al. 2011; Liu et al. 2015). This synergy may be mediated by lncRNA cis-regulation. For instance, MSTRG.8251.1, located upstream of the cyclin gene CDC2, exhibits expression highly correlated with CDC2 (both upregulated in the hyphal stage). This suggests that MSTRG.8251.1 may facilitate promoter-enhancer interactions via chromatin looping, thereby promoting CDC2 expression and regulating cell cycle progression (Liu et al. 2015).
Cytoskeletal reorganization is a critical process in morphogenesis. Multiple genes participate in this process, including: Microtubule-associated proteins: (Tea2, StuA, Alp4, ro-4) and Vesicle SNARE proteins (Sec11, Sec27) (Hirozumi et al. 1999; Browning and Hackney 2005; Masuda et al. 2006; Bitencourt et al. 2021). These genes are upregulated in hyphae and regulated by trans-acting lncRNAs, forming a complex post-transcriptional network. For example, MSTRG.10634.1 may enhance the stability of its target mRNA (Alp4) by interacting with heterogeneous nuclear ribonucleoproteins, ensuring sufficient microtubule protein expression during critical germ tube formation stages (Masuda et al. 2006). This RNA-binding protein-mediated regulatory mechanism resembles the MIR100HG/hnRNPA2B1/TCF7L2 axis in colorectal cancer, highlighting evolutionarily conserved regulatory logic across diverse biological processes (Liu et al. 2022a).
Limitations and future perspectives
This study has several technical limitations. First, only two time points were examined, leaving the dynamic changes during intermediate stages uncharacterized. Future studies should incorporate critical transitional phases (e.g., 6 h and 12 h) to elucidate the heterogeneity and developmental trajectory of spore germination. Second, the functional mechanisms of lncRNAs remain unclear. For instance, how do cis-acting lncRNAs precisely recognize the promoters of neighboring genes? How do trans-acting lncRNAs achieve target specificity? These questions warrant further investigation using protein interactome analyses (e.g., ChIRP-MS to identify binding partners). Third, although stringent criteria (SCC ≤ -0.7, PCC > 0.9) were applied to minimize false positives in ceRNA prediction, multiple-testing correction (e.g., FDR) and experimental validation of RNA-RNA interactions is essential. For example, dual-luciferase reporter assays could verify lncRNA-miRNA-mRNA targeting relationships. Finally, from a translational perspective, the identified key lncRNAs and hub genes may serve as novel targets for antifungal drug development. For instance, antisense oligonucleotides (ASOs) targeting MSTRG.9453.1 or small-molecule inhibitors disrupting lncRNA-protein interactions could selectively inhibit spore germination without affecting host cells.
In summary, this study systematically deciphered the lncRNA-mRNA-miRNA regulatory network during T. mentagrophytes germination by integrating multi-omics data, revealing how lncRNAs coordinate developmental transitions through cis-, trans-, and ceRNA mechanisms. These findings provide novel insights into the regulatory framework of filamentous fungal morphogenesis and lay a theoretical foundation for RNA interference-based antifungal strategies.
Conclusion
This study establishes a comprehensive regulatory atlas of T. mentagrophytes germination, revealing that: (1) Transcriptional reprogramming suppresses anabolism while activating cell division machinery. (2) lncRNAs operate through spatially distinct mechanisms (antisense, cis, and trans) to control morphogenesis. (3) miRNAs fine-tune developmental transitions by targeting cell cycle and metabolic regulators. (4) ceRNA networks integrate lncRNA-miRNA-mRNA interactions to coordinate hyphal growth. These findings provide novel insights into the regulatory framework of filamentous fungal morphogenesis and lay a theoretical foundation for RNA interference-based antifungal strategies.
The reference list from the paper itself. Each links out to its DOI / PubMed record.
- 1Bitencourt TA Neves-da-Rocha J Martins MP (2021) Stu A-Regulated Processes in the Dermatophyte Trichophyton rubrum: Transcription Profile, Cell-Cell Adhesion, and Immunomodulation. Frontiers in Cellular and Infection Microbiology 11: 643659. 10.3389/fcimb.2021.643659 PMC 821899334169004 · doi ↗ · pubmed ↗
- 2Bleichrodt RJ Foster P Howell G (2020) Cell wall composition heterogeneity between single cells in Aspergillus fumigatus leads to heterogeneous behavior during antifungal treatment and phagocytosis. m Bio 11(3): e 03015-19. 10.1128/m Bio.03015-19PMC 721828732398317 · doi ↗ · pubmed ↗
- 3Bowman SM Piwowar A Al Dabbous M (2006) Mutational analysis of the glycosylphosphatidylinositol (GPI) anchor pathway demonstrates that GPI-anchored proteins are required for cell wall biogenesis and normal hyphal growth in Neurospora crassa.Eukaryotic Cell 5(3): 587–600. 10.1128/EC.5.3.587-600.200616524913 PMC 1398062 · doi ↗ · pubmed ↗
- 4Browning H Hackney DD (2005) The EB 1 homolog Mal 3 stimulates the AT Pase of the kinesin Tea 2 by recruiting it to the microtubule.The Journal of Biological Chemistry 280(13): 12299–12304. 10.1074/jbc.M 41362020015665379 · doi ↗ · pubmed ↗
- 5Cesana M Cacchiarelli D Legnini I (2011) A long noncoding RNA controls muscle differentiation by functioning as a competing endogenous RNA.Cell 147(2): 358–369. 10.1016/j.cell.2011.09.02822000014 PMC 3234495 · doi ↗ · pubmed ↗
- 6Chardwiriyapreecha S Shimazu M Morita T (2008) Identification of the fnx 1+ and fnx 2+ genes for vacuolar amino acid transporters in Schizosaccharomyces pombe.FEBS Letters 582(15): 2225–2230. 10.1016/j.febslet.2008.05.01718503766 · doi ↗ · pubmed ↗
- 7Chen LL Kim VN (2024) Small and long non-coding RN As: Past, present, and future.Cell 187(23): 6451–6485. 10.1016/j.cell.2024.10.02439547208 · doi ↗ · pubmed ↗
- 8Chen H Wang Z Wang Z (2016) Improving methionine and ATP availability by MET 6 and SAM 2 co-expression combined with sodium citrate feeding enhanced SAM accumulation in Saccharomyces cerevisiae.World Journal of Microbiology & Biotechnology 32(4): 56. 10.1007/s 11274-016-2010-y 26925618 · doi ↗ · pubmed ↗