Association between Paleolithic diet fraction and systemic low-grade chronic inflammation in the Malmö diet and cancer study cohort
Pedro Carrera-Bastos, Björn Rydhög, Yvonne Granfeldt, Kristina Sundquist, Emily Sonestedt, Peter M. Nilsson, Tommy Jönsson

TL;DR
A higher Paleolithic Diet Fraction is linked to lower signs of chronic inflammation, which may explain its benefits for heart and metabolic health.
Contribution
This study shows a strong inverse link between Paleolithic Diet Fraction and inflammation biomarkers in a large cohort.
Findings
Higher PDF was significantly associated with lower total leukocyte count, NLR, and CRP levels.
The associations remained significant after adjusting for multiple lifestyle and demographic factors.
Inflammatory biomarkers showed weak but significant correlations with each other.
Abstract
The Paleolithic Diet Fraction (PDF) estimates the proportion of absolute dietary intake derived from food groups included in the Paleolithic diet. In the Malmö Diet and Cancer Study (MDCS), higher PDF and lower systemic low-grade chronic inflammation (SLGCI) have been associated with lower cardiometabolic morbidity and mortality. We examined associations between PDF and SLGCI in the MDCS. The study population (n = 23,250; 63% women; ages 44–74 years) excluded participants with prior coronary events, diabetes, stroke, high-grade inflammation, or missing baseline covariate data. PDF was calculated from baseline dietary data collected via food frequency questionnaires, seven-day food records, and interviews. Biomarkers of SLGCI included total leukocyte count (TLC) and neutrophil-to-lymphocyte ratio (NLR) measured at baseline, and C-reactive protein (CRP) measured ~ 4 months later in a…
Genes, proteins, chemicals, diseases, species, mutations and cell lines named across the full text — each resolved to its canonical identifier and authoritative record.
Click any figure to enlarge with its caption.
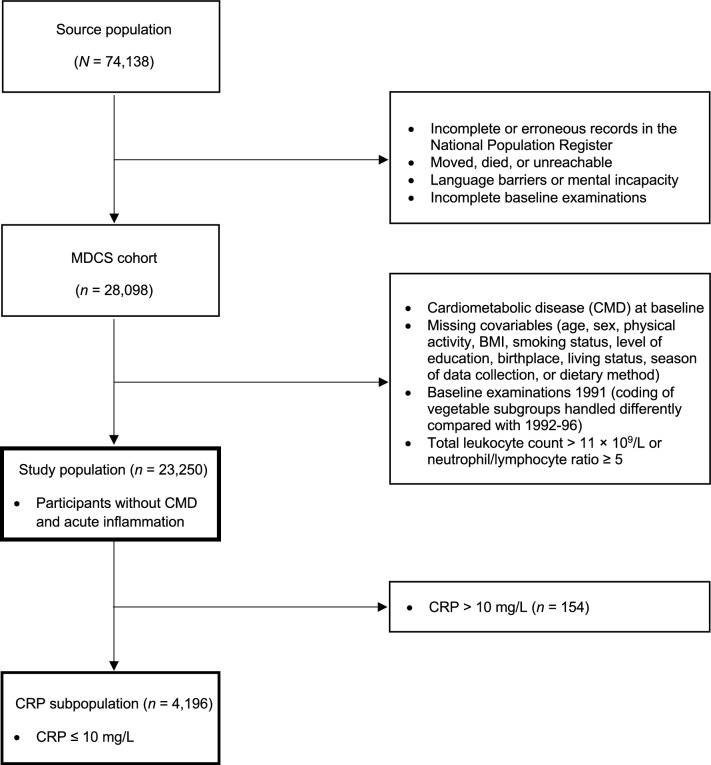 Figure 1
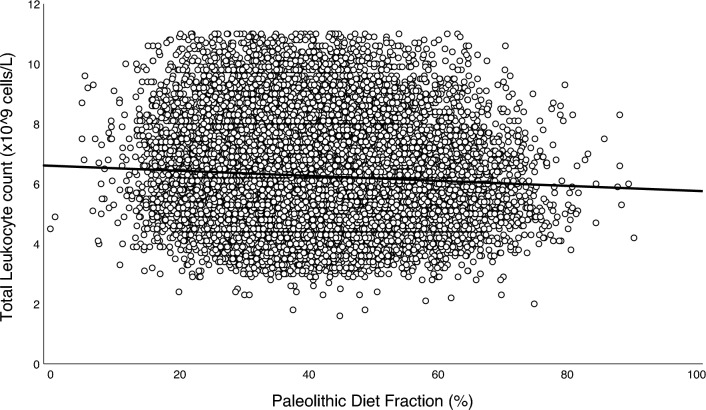 Figure 2
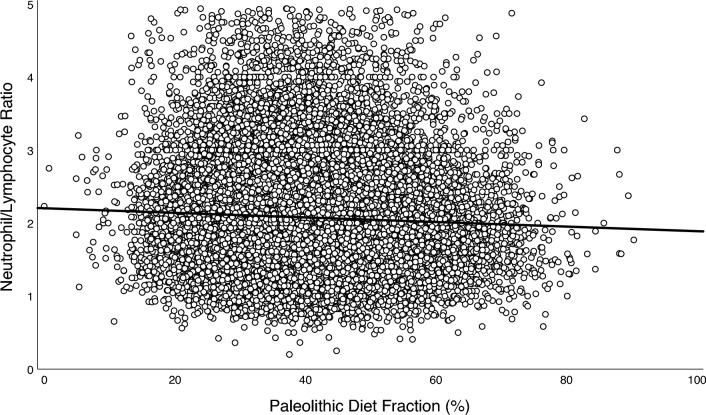 Figure 3
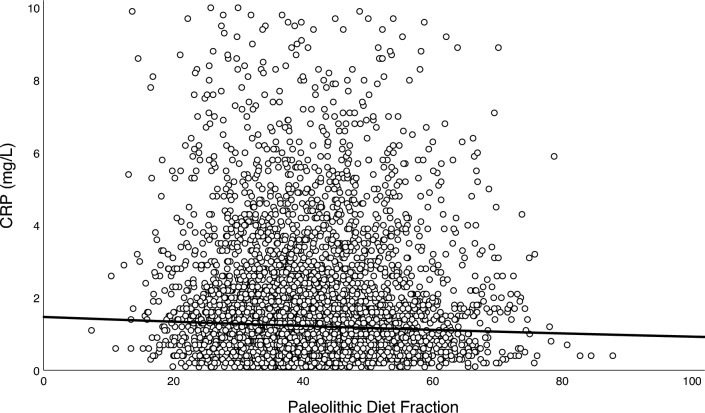 Figure 4
- —Lund University
Peer Reviews
No public reviews on file for this paper yet. If you reviewed it on a platform where reviews are public (OpenReview, ICLR, NeurIPS, ICML), you can paste yours below so the community can read it here.
Videos
No videos yet. Explain this paper in a talk, walkthrough, or lecture? Add one.
Taxonomy
TopicsNutritional Studies and Diet · Diet and metabolism studies · Gut microbiota and health
Introduction
Systemic low-grade chronic inflammation (SLGCI) is characterized by a subtle yet persistent activation of various immune cells [1]. SLGCI may contribute to the onset and progression of chronic non-communicable conditions, including metabolic syndrome, type 2 diabetes, and cardiovascular disease [1–3], which are leading causes of morbidity and mortality worldwide [4, 5].
The assessment of SLGCI commonly relies on blood-based biomarkers [1, 6, 7], with each providing distinct insights into inflammatory status. Total leukocyte count is a widely used biomarker that reflects overall immune activation and has been positively associated with the risk of cardiovascular and metabolic diseases [2, 8–11]. The neutrophil-to-lymphocyte ratio (NLR) represents the balance between innate (neutrophils) and adaptive immunity (lymphocytes) [12]. NLR has been positively associated with the risk of metabolic syndrome [13], type 2 diabetes [14], and cardiovascular disease [15], in addition to all-cause and cardiovascular mortality [16, 17]. C-reactive protein (CRP), an acute-phase protein indicative of systemic inflammation [7, 18], has also been positively associated with the risk of type 2 diabetes [19], cardiovascular disease [7], and both cardiovascular and all-cause mortality [20, 21].
SLGCI can be modulated by diet, as demonstrated by multiple lines of evidence, including animal experiments, observational studies, and randomized controlled trials (RCTs) [22–30]. For example, cross-sectional studies have shown that diets rich in fruits, vegetables, nuts, seeds, and fish are associated with lower circulating levels of SLGCI biomarkers [26–30]. Concordantly, RCTs have found that several healthy dietary patterns, some of which specifically emphasize these foods, can significantly decrease biomarkers of SLGCI [24–26, 31]. Among these dietary patterns, the Paleolithic diet has, in a few RCTs, resulted in lower CRP levels compared to control diets [31].
The Paleolithic diet is modeled after the presumed dietary habits of pre-agricultural humans and emphasizes the intake of fruits, vegetables, roots, tubers, lean meats, fish, eggs, nuts, and seeds, while excluding grains, dairy, legumes, ultra-processed foods, as well as added sugars and fats [32, 33]. Observational studies using dietary scoring methods have found that dietary patterns resembling the Paleolithic diet are inversely associated with cardiometabolic disease incidence and both cardiovascular and all-cause mortality [34, 35]. In interventional studies, the Paleolithic diet has also resulted in beneficial effects on cardiometabolic health biomarkers, including lipid profiles, glucose regulation, and blood pressure [31, 36, 37].
To estimate how large a portion of the absolute dietary intake is derived from food groups included in the Paleolithic diet, the Paleolithic Diet Fraction (PDF) was developed [38]. PDF has in RCTs been found to be associated with better cardiometabolic health biomarkers [38, 39]. A higher PDF has also been associated with a reduced incidence of cardiometabolic disease and lower rates of cardiovascular and all-cause mortality in the Malmö Diet and Cancer Study (MDCS), Sweden [34]. MDCS was a large, population-based prospective cohort study that included 24,104 participants aged 44–74 years, 63% of whom were women [34]. Interestingly, in the MDCS, biomarkers of SLGCI were measured and found to also be associated with the incidence of cardiometabolic disease [2, 8]. Both PDF and SLGCI biomarkers have thus been separately associated with cardiometabolic morbidity in the MDCS. Our aim was to build upon these findings by examining associations between PDF and SLGCI biomarkers in the MDCS.
Methods
Study population
The MDCS is a population-based cohort study conducted in Malmö, southern Sweden. Baseline examinations occurred between 1991 and 1996, targeting all women born between 1923 and 1950 and all men born between 1923 and 1945 residing in Malmö (N = 74,138) [40]. Of these, a total of 28,098 participants completed all baseline examinations, which included dietary assessments, physical evaluations, and questionnaires addressing socioeconomic and lifestyle factors, as described in previous publications [34, 40]. For the present analysis, participants with type 2 diabetes, cardiovascular disease, or stroke at baseline were excluded, along with individuals missing covariate data necessary for regression analysis (age, sex, physical activity level, body mass index [BMI], smoking status, education level, living alone, born in Sweden, season of data collection, or dietary method). Participants who underwent baseline examinations in 1991 were also excluded because dietary data from that year did not support an accurate PDF calculation. Additionally, participants with a total leukocyte count above 11 × 10^9^/L or NLR above or equal to 5, indicative of acute high-grade inflammation [41, 42], were also excluded, resulting in a study population of 23,250 participants (see flowchart in Fig. 1). A sub-cohort of MDCS was randomly selected between 1991 and 1994 to study the epidemiology of carotid artery disease [43]. Among this sub-cohort, fasting plasma samples were collected approximately four months after the MDCS baseline examinations and analyzed for CRP, fasting blood glucose, hemoglobin A1c (HbA1c), serum insulin, and blood lipids. For the present study, a subpopulation of 4,196 participants was formed from participants of this sub-cohort with CRP values below 10 mg/L (values above 10 mg/L indicative of acute high-grade inflammation [7]) (Fig. 1).Fig. 1. Study population flowchart. Note. Flowchart depicting participant selection from the Malmö Diet and Cancer Study (MDCS). The study population and CRP subpopulation were comprised of participants from the Malmö Diet and Cancer Study (MDCS) without previous coronary events, diabetes, stroke, or high-grade inflammation, and with no missing covariate data at baseline (1992–96). BMI, Body mass index; CMD, cardiometabolic disease; CRP, C-reactive protein. MDCS, Malmö Diet and Cancer Study
All participants provided written informed consent, and the study was approved by the Regional Ethics Review Board in Lund, Sweden (Dnr. LU51-90).
Dietary data and PDF
The dietary intake of participants in the MDCS was assessed at baseline using a modified diet history method designed to capture habitual dietary patterns. This method integrated three components: (1) a seven-day food record where participants logged meals with varying content, typically lunches and dinners, alongside records of cold beverages and supplements; (2) a 168-item food frequency questionnaire, estimating portion sizes and frequencies for commonly consumed foods with low day-to-day variation; and (3) a 45-min interview conducted by trained dieticians to validate records, clarify portion sizes using visual aids, and collect additional details on food preparation methods. This approach has been described in detail in prior MDCS publications [34, 44, 45].
Dietary data were processed using a specialized database and software incorporating standard recipes, food codes, and nutrient information. Nutrient values were sourced from the PC-KOST2-93 database of the Swedish National Food Administration and supplemented with cohort-specific recipes. The dietary data were grouped into aggregated categories to facilitate analysis, accounting for both nutrient content and dietary behavior relevance [45]. The reliability and validity of the dietary data were previously evaluated through comparisons with weighed food records, showing strong correlation coefficients for various food and nutrient intakes, thus supporting the robustness of the MDCS dietary assessment method [34].
To account for methodological differences, adjustments were made based on the time of dietary data collection. Specifically, data collected after September 1994 underwent revised coding routines that were introduced to streamline the dietary interview process. The adjustments included standardized coding for mixed dishes and modifications in portion-size estimation, changes which prior validation studies have shown to have minimal impact on ranking participants by dietary intake [45].
PDF was calculated as the fraction of total daily intake (by weight) from food groups consistent with the Paleolithic dietary model, excluding non-caloric beverages (e.g., water, coffee, and tea). Based on previously established criteria [34, 38, 39] and the MDCS food grouping system, food groups classified as Paleolithic were vegetables, fruits, potatoes, eggs, meat, fish, olive and rapeseed oil, nuts, and wine. Food groups classified as non-Paleolithic included legumes, juice, meat products (e.g., offal as mixed products or spreads, sausage), milk and milk products, sweet beverages, cereals (including rice), fats/oils and margarine, bakery sweets, jam, sauces and soups, beer, spirits, and miscellaneous items. In previous studies using detailed weighed food records, PDF could be calculated using the energy contribution of each food group [38, 39]. In the MDCS, however, the integrated dietary assessment method was not designed to yield precise, disaggregated energy estimates for individual food groups after merging all components (food record, questionnaire, and interview) [44, 45]. This limitation arises from the coding structure and aggregation procedures in the MDCS nutrient database, which link portion sizes and nutrient values to mixed dishes and aggregated food codes rather than to individual ingredients. Consequently, although total daily energy intake is available, it is not possible to obtain accurate energy values separately for Paleolithic and non-Paleolithic food groups. Therefore, PDF in the MDCS could only be computed on the basis of food weight, consistent with prior work in this cohort [34].
Assessment of inflammatory biomarkers
Total leukocyte count and its subtypes (neutrophils and lymphocytes) were measured in heparinized blood samples at baseline using the SYSMEX K1000 automated hematology analyzer. NLR was calculated as the ratio of neutrophil count to lymphocyte count. CRP was measured in fasting plasma samples stored at −80 °C using the Tina-quant® CRP latex high-sensitivity assay (Roche Diagnostics).
Other variables
Data on age and sex were obtained from national population registers using participants’ personal identification numbers. BMI was calculated from measured weight (kg) and height (m) and categorized into four groups: underweight (< 18.5 kg/m^2^), normal weight (18.5–24.99 kg/m^2^), overweight (25–29.99), and obesity (≥ 30 kg/m^2^) [46]. Leisure-time physical activity was assessed through self-reported weekly duration (minutes) of engagement in 17 different activities. Each activity was weighted by an intensity coefficient, and the resulting score was divided into sex-specific quintiles to account for differences in physical activity patterns [47]. Smoking status was classified into four groups: regular smokers (daily), occasional smokers (less than daily), former smokers, and never smokers. Education level was divided into four categories: ≤ 8 years of schooling, 9–10 years, 11–13 years, or university degree. Season of dietary data collection was categorized as winter, spring, summer, or fall (autumn) to account for seasonal variations. A binary variable labeled “dietary method version” was introduced to address methodological differences arising from slightly altered coding routines implemented in September 1994, as described above. Additional covariates included living alone (yes/no) and born in Sweden (yes/no).
Statistical analysis
Associations between PDF and inflammatory biomarkers (total leukocyte count, NLR, and lnCRP) were assessed using simple and two multiple linear regression models. The first model was adjusted for age and sex. The second model was additionally adjusted for physical activity level, BMI, smoking status, education level, living alone, born in Sweden, season of dietary data collection, and dietary method version. Covariates were selected based on face validity and prior evidence of their potential to act as confounders, as documented in the literature and previous analyses of the MDCS cohort. In sensitivity analyses, associations between PDF and inflammatory biomarkers in fully adjusted multiple linear regression were also analyzed stratified by sex, age (tertiles), and PDF (tertiles), and the interaction between PDF and the stratified covariates was formally tested by adding corresponding interaction terms. Exploratory analyses of associations between food groups and inflammatory biomarkers were also performed using fully adjusted multiple linear regression. Correlations between variables were assessed using Pearson or Spearman coefficients, as appropriate. Statistical significance was set at p < 0.05. Analyses were performed in SPSS statistical software package (IBM, version 29.0.2.0).
Results
Baseline clinical characteristics are summarized in Table 1.Table 1. Clinical characteristicsStudy populationCRP subpopulationMSDMdnMinMaxn%MSDMdnMinMaxn%Age, years57.97.757.344.573.623,25010057.46.057.746.068.04,196100SexMale8,669371,65239Female14,581632,54461Height, cm168.58.8168.0127.0203.023,250100168.98.8168.0144.0201.04,196100Weight, kg72.913.472.031.0170.023,25010072.913.172.039.0150.04,196100Body mass index, kg/m^2^25.63.925.213.950.923,25010025.53.825.015.650.74,196100Waist circumference, cm83.212.682.050.0152.023,25010082.712.482.054.0152.04,196100Systolic blood pressure, mm Hg140.819.9140.061.0230.023,250100140.718.7140.094.0210.04,196100Diastolic blood pressure, mm Hg85.310.085.040.0136.023,25010086.79.386.058.0130.04,196100Physical activity score8,2216,7746,8880316,12023,2501008,3145,9137,124048,9004,196100Smoking StatusRegular smoker5,4602390622Occasional smoker1,05051945Former smoker7,763331,37233Never smoker8,977391,72441Education level < 9 years9,440411,879459–10 years6,173271,0962611–13 years4,1881869617University degree3,4491552513Living aloneNo17,598763,25778Yes5,6522493922Born in SwedenYes20,478883,75589No2,7721244111Paleolithic Diet Fraction, %41114009023,2501004211417884,196100Leukocyte count, × 10^9^/L6.31.56.01.611.023,2501005.91.55.72.311.04,196100Neutrophil count, × 10^9^/L3.81.23.60.28.723,2501003.61.13.50.68.64,196100Lymphocyte count, × 10^9^/L1.90.61.90.56.023,2501001.80.51.80.55.64,196100Neutrophil/lymphocyte ratio2.10.72.00.24.923,2501002.10.71.90.34.94,196100C-reactive protein, mg/L1.91.81.20.110.04,196100Total cholesterol, mmol/L6.21.16.13.011.84,196100LDL, mmol/L4.21.04.11.09.84,196100HDL, mmol/L1.40.41.40.53.14,196100Triglycerides, mmol/L1.30.81.10.316.34,196100Total cholesterol/HDL ratio4.71.44.51.913.04,196100LDL/HDL ratio3.21.23.10.69.64,196100Triglyceride/HDL ratio1.10.80.80.26.84,196100HbA1c, %4.80.54.83.38.94,196100Fasting glucose, mmol/L5.00.64.93.313.54,196100Fasting insulin, mIU7.68.06.02.9224.04,196100HOMA-IR1.82.61.40.488.34,196100Clinical characteristics of the study population and the CRP subpopulation, both comprised of participants from the Malmö Diet and Cancer Study (MDCS) without previous coronary events, diabetes, stroke, or high-grade inflammation, and with no missing covariate data at baseline (1992–96)BMI, Body mass index; CRP, C-reactive protein; HbA1c, Hemoglobin A1c; HDL, High-density lipoprotein cholesterol; LDL, Low-density lipoprotein cholesterol; HOMA-IR, Homeostatic model assessment of insulin resistance
Mean PDF was 41% in the study population and 42% in the subpopulation. Mean total leukocyte count was 6.3 × 10^9^/L and 5.9 × 10^9^/L in the study population and subpopulation, respectively. Mean NLR was 2.1 in both populations and mean CRP was 1.9 mg/L in the subpopulation. Daily food intake at baseline is summarized in Table 2.Table 2. Daily Food IntakeStudy population (n = 23,250)CRP subpopulation (n = 4,196)MdnMinMaxIQRMdnMinMaxIQRPaleolithic diet fraction, %40090154178815Total food group weight, g/day1,6893305,2426201,7354884,371629Total food group energy, kcal2,1805168,3967982,2246275,879825Total food group energy per gram, kcal10.530.310.620.3Paleolithic food groups, g66804,0892907001382,060294 Vegetables, g14601,1771101621933119 Fruits, g16802,78215218201,312153 Potatoes, g10901,44784110086291 Eggs, g1902452219017322 Meat^a^, g9405936096047062 Fish, g3905274140050541 Rapeseed and olive oil, g0074000260 Nuts, g00147200752 Wine, g2101,1277121076471Non-Paleolithic food groups, g999754,1825121,0111293,417513 Legumes, g00520140020618 Juice, g101,371100101,371100 Meat products^b^, g2403413525029337 Milk and milk products, g39503,33931540602,200315 Sweet beverages, g903,00094601,71486 Cereal grains (including rice), g13201,1148113911,11488 Fats, Oils, and Margarines, g3002093132020533 Bakery sweets, g6507155766071558 Jam, g1202052013020521 Sauces and soups, g301,000103036110 Beer, g8303,1431938601,961190 Spirits, g005507002367 Remainder miscellaneous, g406924401314Daily food group intake in the study population and the CRP subpopulation, both comprised of participants from the Malmö Diet and Cancer Study (MDCS) without previous coronary events, diabetes, stroke, or high-grade inflammation, and with no missing covariate data at baseline (1992–96). Non-energy containing beverages excludedCRP, C-reactive protein. Total food group energy’ refers to the overall daily energy intake from all foods combined. Disaggregated energy values for individual food groups are not available in the MDCS dataset^a^Pork, beef, lamb, game meat, poultry, and pure offal. ^b^ Offal as a mixed product or spread, and sausage
Highly significant (p < 0.001) but weak positive correlations were found among all biomarkers of inflammation, using Spearman’s correlation coefficient (rs): total leukocyte count and NLR (rs = 0.263), total leukocyte count and CRP (rs = 0.262), and NLR and CRP (rs = 0.062). PDF was highly significantly and inversely associated with all biomarkers of inflammation in both simple and adjusted multiple linear regressions (p < 0.001; Table 3 and Figs. 2, 3 and 4). Sensitivity analyses stratified by sex, age, and PDF found similar inverse associations across all strata, albeit with a significant interaction between PDF and age for NLR (p = 0.004, Table S1). Exploratory analyses of food groups in fully adjusted models showed that vegetables, fruits, and fish were negatively associated with SLGCI biomarkers, whereas meat products, milk and milk products, bakery sweets, and sweet beverages were positively associated (Table S2).Table 3. Association between Paleolithic Diet Fraction and inflammatory biomarkersBiomarkerModeln**B for constantB**SE Coeffßt**pAdj R^2^ for modelTotal leukocyte count, × 10^9^/L23,250Non-adjusted6.749− 0.0120.001− 0.090− 13.757< 0.0010.008Age and sex adjusted− 0.0130.001− 0.100− 14.895< 0.0010.010Fully adjusted*− 0.0080.001− 0.063− 10.037< 0.0010.158Neutrophil-to-lymphocyte ratio23,250Non-adjusted2.272− 0.0050.000− 0.075− 11.409< 0.0010.006Age and sex adjusted− 0.0040.000− 0.060− 8.924< 0.0010.010Fully adjusted*− 0.0030.000− 0.048− 7.139< 0.0010.019Ln C-reactive protein4,196Non-adjusted0.395− 0.0050.001− 0.057− 3.675< 0.0010.003Age and sex adjusted− 0.0050.001− 0.060− 3.790< 0.0010.012Fully adjusted*− 0.0050.001− 0.054− 3.555< 0.0010.114Association between Paleolithic Diet Fraction (%) and inflammatory biomarkers assessed using simple and multivariable linear regression models. The study population and the CRP subpopulation were both comprised of participants from the Malmö Diet and Cancer Study (MDCS) without previous coronary events, diabetes, stroke, or high-grade inflammation, and with no missing covariate data at baseline (1992–96)*Adjusted for age, sex, physical activity level, body mass index, smoking status, education level, living alone, born in Sweden, season of dietary data collection, and dietary method versionFig. 2Association between Paleolithic Diet Fraction and total leukocyte count. Note. Association between Paleolithic Diet Fraction and total leukocyte count in the study population (n = 23,250) comprised of participants from the Malmö Diet and Cancer Study (MDCS) without previous coronary events, diabetes, stroke, or high-grade inflammation, and with no missing covariate data at baseline (1992–96). The solid line depicts the fully adjusted linear regression fit (y = 6.603 − 0.008 × x, p < 0.001)Fig. 3. Association between Paleolithic Diet Fraction and neutrophil-to-lymphocyte ratio.Note. Association between Paleolithic Diet Fraction and neutrophil-to-lymphocyte ratio in the study population (n = 23,250) comprised of participants from the Malmö Diet and Cancer Study (MDCS) without previous coronary events, diabetes, stroke, or high-grade inflammation, and with no missing covariate data at baseline (1992–96). The solid line depicts the fully adjusted linear regression fit (y = 2.203 − 0.003 × x, p < 0.001)Fig. 4. Association between Paleolithic Diet Fraction and c-reactive protein.Note. Association between Paleolithic Diet Fraction and C-reactive protein (CRP) in the CRP subpopulation (n = 4196) comprised of participants from the Malmö Diet and Cancer Study (MDCS) without previous coronary events, diabetes, stroke, or high-grade inflammation, and with no missing covariate data at baseline (1992–96). The solid line depicts the fully adjusted regression fit, back-transformed from the natural logarithm of CRP [y = exp(0.385 − 0.005 × x), p < 0.001]
Discussion
This study investigated the associations between PDF, a measure estimating the proportion of dietary intake derived from food groups consistent with the Paleolithic diet, and biomarkers of SLGCI in a large Swedish cohort (the Malmö Diet and Cancer Study, MDCS). The main finding was that PDF was consistently and inversely associated with all biomarkers of SLGCI, even after adjusting for potential confounders. In sensitivity analyses, the inverse association between PDF and biomarkers of SLGCI was broadly consistent across sex, age, and PDF strata. Notably, for NLR, there was a significant interaction between PDF and age, with the greatest explanatory power of the model among older participants, consistent with the concept of inflammaging, whereby SLGCI becomes more prevalent with age [1]. However, no such age interaction was observed for total leukocyte count or CRP. Instead, for CRP, the inverse association with PDF was greatest and only significant in the PDF tertile with the lowest PDF values, suggesting a potential diminishing returns effect whereby those with the lowest baseline PDF values stand to gain the most from dietary shifts toward a Paleolithic pattern. These findings align with previous research on the effects of the Paleolithic diet on CRP in interventional and observational studies [31, 37, 48]. Nevertheless, a recent umbrella review found no consistent inverse association between a Paleolithic diet and CRP [49]. Only a limited number of Paleolithic dietary trials have examined inflammatory biomarkers [31, 37], and, among these, not all had inflammation as the primary outcome [33, 50–54], which can reduce their ability to detect significant changes in inflammatory biomarkers. Furthermore, Paleolithic diets, although similar in terms of excluded foods, may vary in their composition of included foods known to decrease inflammation, such as fish, fruits, and vegetables [23, 26]. In exploratory analyses, food group associations with SLGCI biomarkers showed a coherent pattern: Paleolithic food groups, particularly vegetables, fruits, and fish, were negatively associated, whereas non-Paleolithic food groups, including meat products and milk and milk products, were positively associated. This pattern supports the rationale and design of PDF. Moreover, all standardized coefficients for individual food groups were smaller than those for PDF, highlighting the usefulness of employing a dietary pattern measure such as PDF when assessing diet-SLGCI associations. Regarding total leukocyte count and NLR, no previous study assessing the effect of the Paleolithic diet on those biomarkers was found, thus precluding direct comparison with our results. As for other dietary patterns, the findings of this study concur with previous studies suggesting that emphasizing nutrient-dense foods while minimizing salt, refined sugars, trans fatty acids, and ultra-processed foods can lower biomarkers of systemic inflammation, including CRP [23–25, 55]. The inverse associations between PDF and inflammatory biomarkers, coupled with the previously documented association between cardiometabolic health and both PDF and biomarkers of inflammation [2, 8, 34], suggest that SLGCI could be a mediator between PDF and the incidence of cardiometabolic disease and mortality in the MDCS. The hypothesis that SLGCI could be a mediator between lifestyle factors, such as diet and cardiometabolic disease risk, is supported by comparisons of median levels of inflammatory biomarkers between populations, where the median levels of CRP (1.2 mg/L), total leukocyte count (6.0 × 10^9^/L), and NLR (2.0) of the MDCS population are comparable to those observed in other industrialized country cohorts [14, 56–59]. By contrast, CRP levels were lower in traditional populations with low cardiometabolic risk, such as the Melanesian horticulturalists from Kitava in Papua New Guinea [60], the Shuar forager-horticulturalists from the Ecuadorian Amazon [61], and the subsistence-agriculturalists from rural Ghana [62].
In the present study, mean PDF was roughly 40%, which is similar to what has been observed for non-Paleolithic diets in previous interventional and observational studies [38, 39, 48]. In contrast, mean PDF for the Paleolithic diet in previous RCTs was around 80% [38, 39]. Consuming a Paleolithic diet with a PDF of 80% instead of a non-Paleolithic diet with a PDF of 40% would, based on the findings of this study, be associated with mean differences of approximately − 0.33 × 10^9^/L in total leukocyte count, −0.13 in NLR, and −0.21 mg/L in CRP. Based on previously assessed associations between SLGCI and cardiometabolic disease incidence in MDCS [2], these mean differences in inflammatory biomarkers would be associated with between 0.6–3.6% lower adjusted cardiometabolic disease risks. Applying such lower disease risks to the whole previously assessed MDCS population of 25,969 individuals would translate to around 200 fewer cardiometabolic disease incidences out of 8,367 cardiometabolic disease incidences after 17.7 years [2].
Strengths and limitations
A major strength of this study is its large sample size and the use of a validated dietary assessment method, which allowed a precise estimation of PDF. Additionally, the inclusion of multiple inflammatory biomarkers provides a more comprehensive assessment of SLGCI. Moreover, the fact that CRP was measured approximately four months after total leukocyte count and NLR, yet still showed significant correlations with them, reinforces their interpretation as biomarkers of chronic rather than transient inflammation. The high quality and comprehensiveness of baseline data collection in the MDCS, together with adjustment for various potential confounders, strengthens the robustness of the findings.
However, several limitations should be noted. First, dietary intake was assessed at a single time point, precluding the ability to examine longitudinal changes in diet. Second, although the MDCS is a prospective cohort study, the present analysis is cross‑sectional, examining associations between baseline dietary data and biomarkers measured at or near baseline; as such, it limits the ability to establish temporal relationships and weakens causal inference. This is particularly relevant for CRP, which was measured approximately four months after baseline examinations, potentially weakening its association with variables assessed at baseline, including PDF. This time gap may have introduced the possibility that changes in inflammatory status due to factors unrelated to diet (e.g., psychological stress [63], changes in sleep patterns [64, 65], or physical activity fluctuations [66]) could have influenced CRP levels. Nonetheless, CRP remained significantly, albeit weakly, correlated with both total leukocyte count and NLR despite being measured later, indicating stability of SLGCI over time and supporting the reliability of its associations with PDF. Third, the absolute magnitude of the observed associations was modest, which may raise questions about their clinical relevance. Nevertheless, as previously illustrated, even small differences in SLGCI biomarkers may translate into meaningful reductions in disease burden at the population level. However, achieving the increase in PDF needed to produce even small differences in SLGCI biomarkers (e.g., from 40% to 80%) may be difficult for many individuals in real-world settings, which should be considered when assessing the feasibility and potential impact of such dietary changes at scale. Fourth, residual confounding cannot be ruled out despite adjustments for potential confounders. This includes the possibility of unmeasured factors such as health-seeking behaviors, whereby individuals with higher PDF may also engage in other health-promoting practices (e.g., higher preventive healthcare use, better adherence to medical advice) that could independently lower systemic inflammation. Moreover, participation in the MDCS itself likely reflects a certain degree of health interest and motivation, since those who agreed to participate may differ systematically from non-participants in ways that could influence both diet and inflammation. Fifth, the study population consisted predominantly of middle-aged Swedish individuals, the majority being women (63%) in an urban setting, which may limit the generalizability of the findings to other populations with different ethnic backgrounds, cultural contexts, and dietary habits. Finally, although the dietary assessment method employed in the MDCS was specifically developed for this cohort and has demonstrated good validity and reproducibility in previous studies [34, 44, 45], it nonetheless relies on self-reported data, which is inherently susceptible to measurement error and recall bias [67–69]. The use of a multi-method approach, which included a 7-day food record, a 168-item food frequency questionnaire, and a structured interview with a trained dietician, likely mitigated these sources of error to some extent. However, residual bias cannot be excluded, particularly for food items with high day-to-day variability [70] or socially desirable reporting patterns [71].
Implications for future research
Future research should focus on longitudinal observational studies and interventional trials, specifically examining the effects of the Paleolithic diet and PDF on inflammatory biomarkers. In particular, well-powered RCTs should prioritize inflammation as a primary outcome and assess biomarkers including CRP, total leukocyte count, NLR, and additional SLGCI biomarkers such as cytokines. Additionally, the biological mechanisms underlying the association between PDF and systemic inflammation should be explored. Further research in more ethnically diverse populations with varied dietary habits and cultural contexts is warranted to enhance the generalizability of the findings and better assess the potential of PDF as a dietary marker for reducing SLGCI and associated disease risks.
Conclusion
PDF and SLGCI were inversely associated, suggesting that SLGCI could mediate the effect of PDF on cardiometabolic disease and mortality. However, given the cross-sectional design, the small absolute magnitude of associations, and the potential influence of residual confounding, these findings should be interpreted with caution. Further longitudinal and interventional studies in diverse populations are warranted to clarify causality, identify contributing dietary components, and assess the clinical relevance of modifying PDF to reduce SLGCI. These findings, if confirmed, could inform dietary recommendations aimed at mitigating low-grade inflammation and improving cardiometabolic health.
Supplementary Information
Below is the link to the electronic supplementary material.Supplementary file1 (PDF 76 KB)Supplementary file2 (PDF 80 KB)