Subclinical myocardial dysfunction assessed by cardiac magnetic resonance feature tracking predicts ventricular arrhythmias in early-stage hypertension
Bin Fang, Weiwei Liao, Jianping Zhong, Junyuan Zhong

TL;DR
This study shows that heart strain measured by MRI can predict dangerous heart rhythms in people with early hypertension.
Contribution
The novel finding is that global circumferential strain (GCS) is a strong predictor of ventricular arrhythmias in early-stage hypertension.
Findings
Hypertension patients showed significantly impaired LV strain parameters compared to controls.
GCS was identified as the primary imaging predictor of ventricular arrhythmias with high specificity and sensitivity.
A combined model of GCS, BSA, and multi-drug antihypertensive therapy history improved VA prediction accuracy.
Abstract
Substantial evidence supports the utility of cardiac magnetic resonance feature tracking (CMR-FT) in evaluating subclinical cardiac dysfunction. This study investigated the clinical value of CMR-derived left ventricular (LV) strain for detecting myocardial impairment in asymptomatic patients with hypertension (HTN) and explored its association with ventricular arrhythmias (VA). A retrospective analysis included 150 HTN patients [with/without LV hypertrophy (LVH)] and 60 healthy controls. Clinical data and CMR parameters were collected. Conventional LV functional indices and strain parameters—global longitudinal strain (GLS), global circumferential strain (GCS), and global radial strain (GRS)—were measured and compared across groups. The multivariable regression model was used to identify independent risk factors for VA. Compared with controls, HTN patients showed significantly…
Genes, proteins, chemicals, diseases, species, mutations and cell lines named across the full text — each resolved to its canonical identifier and authoritative record.
Click any figure to enlarge with its caption.
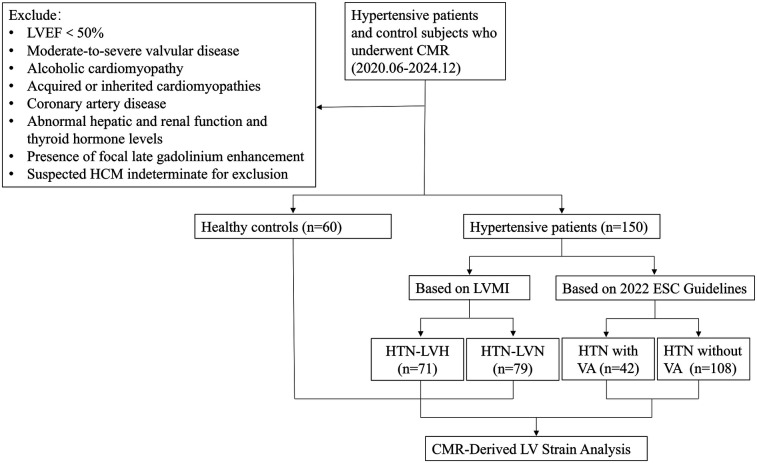 Figure 1
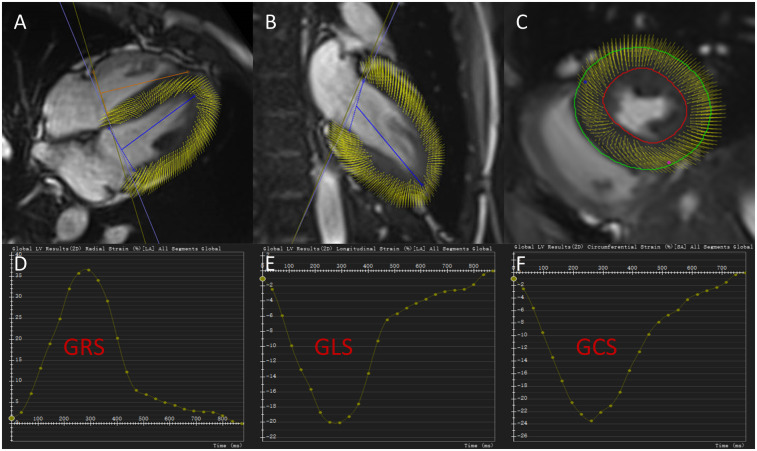 Figure 2
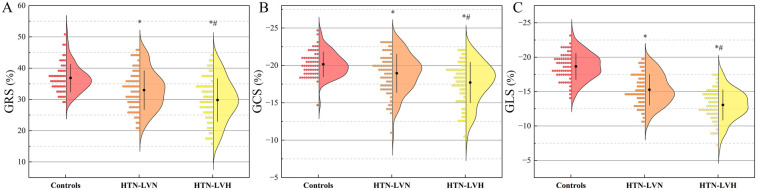 Figure 3
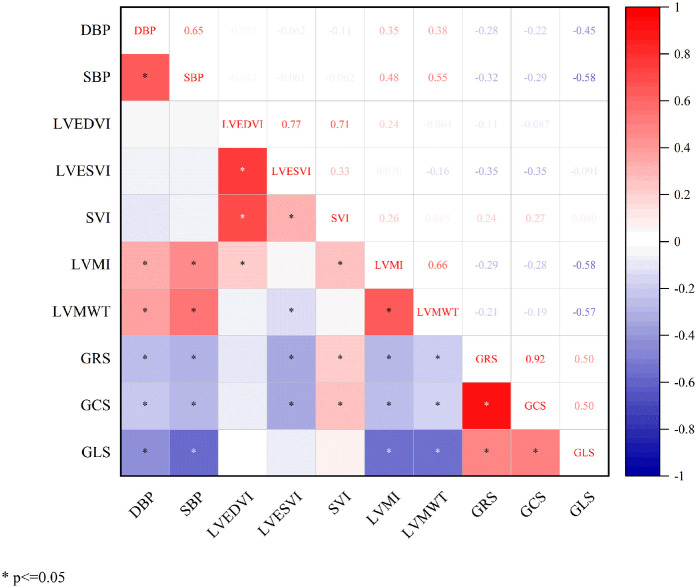 Figure 4
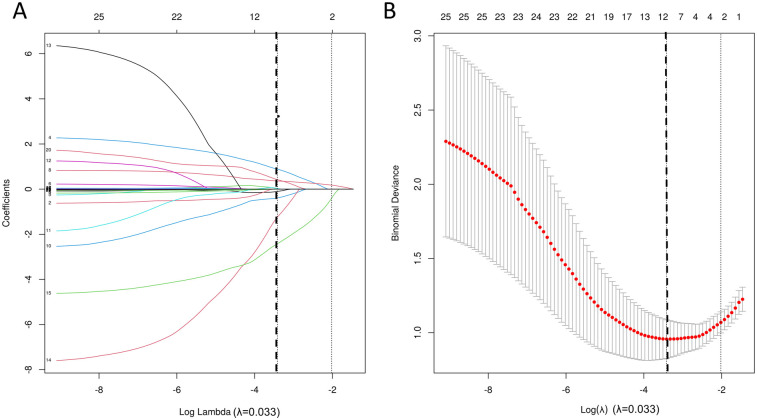 Figure 5
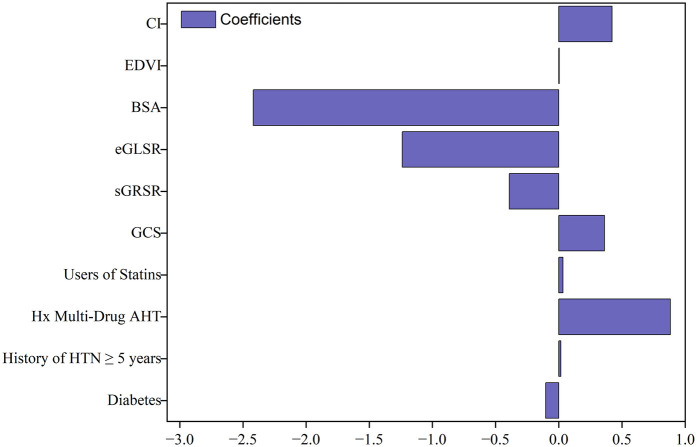 Figure 6
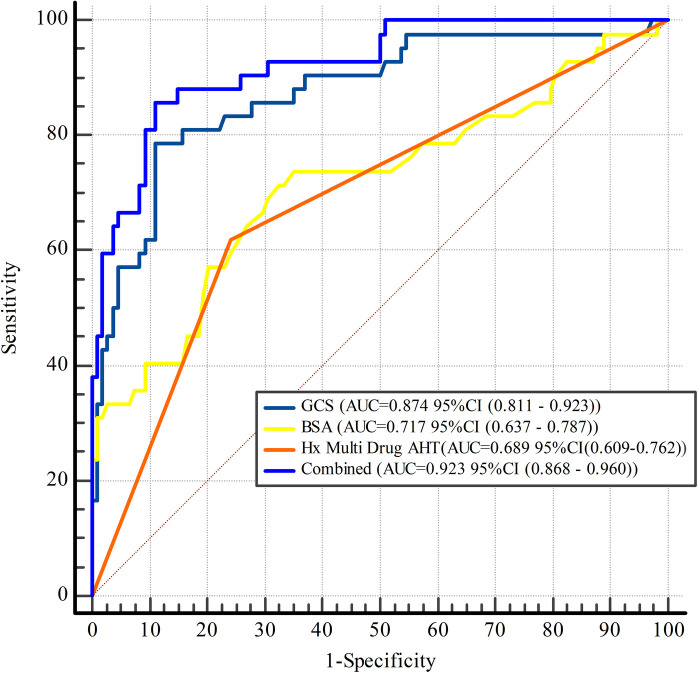 Figure 7
| Parameters | Controls (60) | HTN-LVN (79) | HTN-LVH (71) |
|
|
|
|---|---|---|---|---|---|---|
| Age (years) | 52.25 ± 11.79 | 56.20 ± 10.64 | 51.45 ± 12.29 | 0.071 | 1.000 | 0.076 |
| Man, | 29 (18%) | 50 (63.3%) | 49 (69.0%) | 0.078 | 0.066 | 0.393 |
| Smoking, | 12 (20.0%) | 22 (27.8%) | 29 (40.8%) | 0.286 | 0.010 | 0.093 |
| Alcohol consumption, | 9 (15.0%) | 14 (17.7%) | 17 (23.9%) | 0.669 | 0.201 | 0.347 |
| Body weight (kg) | 62.38 ± 10.02 | 69.50 ± 11.69 | 70.61 ± 12.18 | 0.001 | <0.001 | 1.000 |
| Height (cm) | 162 (159, 168) | 168 (157, 171) | 165 (160, 170) | 0.798 | 1.000 | 1.000 |
| BSA (m2) | 1.66 ± 0.19 | 1.73 ± 0.24 | 1.74 ± 0.25 | 0.605 | 0.841 | 0.962 |
| HR (beats per minute) | 75.5 (70.1, 88.2) | 73.3 (64.2, 81.5) | 71.4 (63.4, 79.3) | 0.480 | 0.209 | 0.944 |
| DBP (mmHg) | 116.05 ± 8.63 | 152.01 ± 15.53 | 161.06 ± 16.13 | <0.001 | <0.001 | 0.081 |
| SBP (mmHg) | 73.55 ± 8.18 | 88.52 ± 12.54 | 93.70 ± 15.75 | <0.001 | <0.001 | 0.013 |
| LVEDVI (mL/m2) | 68.60 ± 10.38 | 62.82 ± 14.41 | 69.88 ± 14.36 | 0.037 | 1.000 | 0.004 |
| LVESVI (mL/m2) | 25.77 ± 6.06 | 22.76 ± 7.23 | 25.08 ± 11.14 | 0.025 | 0.958 | 0.358 |
| SVI (mL/m2) | 42.93 ± 7.19 | 39.49 ± 9.68 | 44.30 ± 11.26 | 0.116 | 1.000 | 0.008 |
| CI (L/min/m2) | 2.99 (2.51, 3.30) | 2.90 (2.38, 3.36) | 3.14 (2.63, 3.52) | 0.895 | 0.600 | 0.160 |
| LVEF (%) | 63.06 ± 5.58 | 63.99 ± 6.78 | 65.11 ± 8.87 | 1.000 | 0.328 | 1.000 |
| LVMI (g/m2) | 57.86 ± 12.68 | 68.54 ± 12.39 | 99.62 ± 22.76 | <0.001 | <0.001 | <0.001 |
| LVMWT (mm) | 9.04 ± 1.54 | 11.98 ± 2.27 | 14.79 ± 3.17 | <0.001 | <0.001 | <0.001 |
| Diabetes, | ─ | 14 (17.7%) | 11 (15.7%) | ─ | ─ | 0.743 |
| Hyperlipidemia, | ─ | 31 (40.3%) | 38 (54.3%) | ─ | ─ | 0.128 |
| History of HTN ≥ 5 years, | ─ | 32 (40.5%) | 34 (47.9%) | ─ | ─ | 0.363 |
| Hx Multi-Drug AHT, | ─ | 21 (26.6%) | 31 (43.7%) | ─ | ─ | 0.028 |
| Users of Statins, | ─ | 44 (55.7%) | 46 (64.8%) | ─ | ─ | 0.256 |
| Parameters | Controls (60) | HTN-LVN (79) | HTN-LVH (71) |
|
|
|
|---|---|---|---|---|---|---|
| GRS (%) | 36.86 ± 4.48 | 32.98 ± 6.24 | 29.80 ± 6.87 | <0.001 | <0.001 | 0.011 |
| GCS (%) | −20.15 ± 1.67 | −18.95 ± 2.56 | −17.72 ± 2.71 | 0.003 | <0.001 | 0.015 |
| GLS (%) | −18.66 ± 1.92 | −15.27 ± 2.24 | −12.66 ± 3.91 | <0.001 | <0.001 | <0.001 |
| sGRSR (s−1) | 1.93 ± 0.39 | 1.82 ± 0.44 | 1.67 ± 0.43 | 0.477 | 0.002 | 0.081 |
| sGCSR (s−1) | −1.07 (−1.23, −0.97) | −1.03 (−1.21, −0.94) | −0.99 (−1.15, −0.91) | 0.104 | 0.010 | 0.290 |
| sGLSR (s−1) | −0.95 (−1.04, −0.90) | −0.92 (−1.03, −0.82) | −0.81 (−0.93, −0.73) | 0.028 | <0.001 | 0.001 |
| eGRSR (s−1) | −1.94 ± 0.43 | −1.47 ± 0.50 | −1.31 ± 0.39 | <0.001 | <0.001 | <0.001 |
| eGCSR (s−1) | 1.01 ± 0.17 | 0.87 ± 0.17 | 0.78 ± 0.17 | <0.001 | <0.001 | <0.001 |
| eGLSR (s−1) | 1.03 ± 0.20 | 0.85 ± 0.15 | 0.73 ± 0.15 | <0.001 | <0.001 | <0.001 |
| Parameters | HTN without VA (108) | HTN with VA (42) |
|
|---|---|---|---|
| Age (years) | 53.81 ± 12.18 | 54.62 ± 12.46 | 0.719 |
| Man, | 73 (67.59%) | 31 (73.81%) | 0.458 |
| BSA (m2) | 1.79 ± 0.19 | 1.58 ± 0.28 | <0.001 |
| HR (beats per minute) | 73.61 ± 13.10 | 75.93 ± 18.69 | 0.465 |
| SBP (mmHg) | 154.55 ± 16.01 | 158.21 ± 17.48 | 0.373 |
| DBP (mmHg) | 90.72 ± 13.87 | 91.62 ± 15.65 | 0.732 |
| Diabetes, | 15 (14.0%) | 10 (23.8%) | 0.150 |
| Hyperlipidemia, | 47 (45.2%) | 22 (55.0%) | 0.403 |
| History of HTN ≥ 5 years, | 44 (40.7%) | 22 (52.4%) | 0.197 |
| Hx Multi-Drug AHT, | 26 (24.1%) | 26 (61.9%) | <0.001 |
| Users of Statins, | 60 (55.6%) | 30 (71.4%) | 0.075 |
| LVEDVI (mL/m2) | 63.63 ± 13.88 | 72.68 ± 15.15 | <0.001 |
| LVESVI (mL/m2) | 21.71 ± 7.21 | 29.38 ± 11.71 | <0.001 |
| SVI (mL/m2) | 41.36 ± 9.25 | 42.82 ± 13.81 | 0.453 |
| CI (L/min/m2) | 3.00 ± 0.66 | 3.12 ± 1.05 | 0.501 |
| LVEF (%) | 66.03 ± 6.99 | 60.64 ± 8.59 | <0.001 |
| LVMI (g/m2) | 82.69 ± 24.05 | 84.68 ± 23.26 | 0.647 |
| LVMWT (mm) | 13.26 ± 2.98 | 13.42 ± 3.32 | 0.776 |
| GRS (%) | 33.55 ± 5.89 | 26.13 ± 5.73 | <0.001 |
| GCS (%) | −19.32 ± 2.04 | −15.62 ± 2.66 | <0.001 |
| GLS (%) | −14.48 ± 3.70 | −12.89 ± 2.07 | 0.009 |
| sGRSR (s−1) | 1.87 ± 0.41 | 1.45 ± 0.36 | <0.001 |
| sGCSR (s−1) | −1.05 (−1.22, −0.95) | −0.95 (−1.00, −0.81) | 0.067 |
| sGLSR (s−1) | −0.90 (−1.02, −0.80) | −0.79 (−0.88, −0.69) | <0.001 |
| eGRSR (s−1) | −1.52 ± 0.39 | −1.08 ± 0.46 | <0.001 |
| eGCSR (s−1) | 0.85 ± 0.17 | 0.76 ± 0.19 | 0.004 |
| eGLSR (s−1) | 0.81 ± 0.15 | 0.74 ± 0.18 | 0.021 |
| Variables | VIF | Multivariable logistic regression | ||
|---|---|---|---|---|
|
|
|
| ||
| BSA (m2) | 1.149 | −4.786 | 0.008 (0.001–0.169) | 0.02 |
| LVEDVI (mL/m2) | 1.882 | 0.006 | 1.006 (0.950–1.065) | 0.842 |
| CI (L/min/m2) | 1.202 | 0.882 | 2.417 (0.881–6.633) | 0.087 |
| Diabetes, | 1.089 | 0.461 | 1.586 (0.311–8.089) | 0.579 |
| History of HTN ≥ 5 years | 1.092 | 0.096 | 1.101 (0.298–4.069) | 0.885 |
| Hx Multi-Drug AHT | 1.318 | −1.704 | 0.182 (0.046–0.723) | 0.015 |
| Users of Statins | 1.166 | −0.854 | 0.426 (0.108–1.674) | 0.222 |
| GCS (%) | 1.773 | 0.789 | 2.202 (1.551–3.125) | <0.001 |
| sGRSR (s−1) | 1.897 | −0.724 | 0.485 (0.153–3.347) | 0.523 |
| eGCSR(s−1) | 1.689 | 2.157 | 0.037 (0.012–2.516) | 0.262 |
| eGLSR (s−1) | 1.406 | −4.341 | 0.130 (0.011–1.674) | 0.089 |
| Parameters | Intra-observer | Inter-observer | ||
|---|---|---|---|---|
|
|
|
|
| |
| GRS | 0.911 | 0.823–0.957 | 0.900 | 0.802–0.951 |
| GCS | 0.927 | 0.854–0.965 | 0.864 | 0.736–0.933 |
| GLS | 0.872 | 0.750–0.937 | 0.882 | 0.768–0.942 |
| sGRSR | 0.869 | 0.746–0.935 | 0.846 | 0.686–0.918 |
| sGCSR | 0.880 | 0.766–0.941 | 0.878 | 0.762–0.940 |
| sGLSR | 0.725 | 0.502–0.859 | 0.663 | 0.407–0.824 |
| eGRSR | 0.862 | 0.733–0.932 | 0.751 | 0.543–0.873 |
| eGCSR | 0.902 | 0.806–0.952 | 0.887 | 0.773–0.944 |
| eGLSR | 0.924 | 0.847–0.963 | 0.848 | 0.707–0.924 |
- —Ganzhou Health Commission Scientific Research Planning Project
- —Clinical Research Center for Medical Imaging in Jiangxi Province
Peer Reviews
No public reviews on file for this paper yet. If you reviewed it on a platform where reviews are public (OpenReview, ICLR, NeurIPS, ICML), you can paste yours below so the community can read it here.
Videos
No videos yet. Explain this paper in a talk, walkthrough, or lecture? Add one.
Taxonomy
TopicsCardiac Imaging and Diagnostics · Advanced MRI Techniques and Applications · Cardiovascular Function and Risk Factors
Introduction
Hypertension (HTN), a critical global public health challenge affecting billions worldwide, continues to demonstrate suboptimal treatment and control rates (1). As the primary target organ, the heart develops characteristic pathological alterations including left ventricular hypertrophy (LVH), myocardial interstitial fibrosis, and progressive cardiac dysfunction (2). Notably, LVH and fibrosis induce increased ventricular myocyte excitability, abnormal electrical conduction, and regional relative ischemia-hypoxia, collectively elevating the risk of ventricular arrhythmias (VA) (3–5). VA may further exacerbate cardiac workload and promote myocardial remodeling (6). Substantial evidence confirms that early standardized antihypertensive therapy can reverse LVH progression and reduce VA incidence (7). It is crucial to early identify subclinical myocardial injury and predict VA risk.
Cardiac magnetic resonance (CMR) provides comprehensive assessment of cardiac morphology, function, and tissue characteristics. While conventional left ventricular (LV) functional parameters, such as left ventricular ejection fraction (LVEF), reflect global pump function, they often remain normal or even elevated during the HTN compensatory phase due to adaptive myocardial hypertrophy, making them insensitive for detecting early myocardial injury. The late gadolinium enhancement (LGE) technique accurately identifies focal replacement fibrosis (known as myocardial scarring) and serves as a key tool for detecting arrhythmogenic substrates (8, 9). However, in HTN patients, diffuse fibrosis predominates with LGE being rarely observed (10). Although extracellular volume (ECV) serves as a complementary marker for diffuse fibrosis, studies indicate that ECV changes are only mild and primarily observed in HTN patients with LVH (11). This suggests ECV may have limited predictive value for VA in early-stage HTN. Collectively, these limitations underscore the urgent need for more sensitive biomarkers to assess VA risk in early-stage HTN.
In recent years, cardiac magnetic resonance feature tracking (CMR-FT) has emerged as a novel noninvasive method for evaluating subclinical myocardial dysfunction by quantifying radial, circumferential, and longitudinal strain parameters (12). These strain metrics demonstrate significant correlations with myocardial hypertrophy severity, fibrotic distribution, and microcirculatory impairment (13, 14), establishing CMR-FT not only as a robust tool for detecting early cardiac dysfunction in HTN but also as a potential indicator of VA risk. Despite its promise, systematic studies on CMR-FT applications in HTN populations remain scarce, with limited exploration of its association with VA. This study employs CMR-FT to characterize subclinical LV mechanical properties in early-stage essential HTN and assess the correlation between strain parameters and VA in HTN patients.
Materials and methods
Clinical characteristics
This retrospective study was conducted with approval from the institutional review board, which waived the requirement for written informed consent (IRB no. MR-36-24-013077). We consecutively enrolled 150 consecutive patients with HTN who received treatment at our center between June 2020 and December 2024. Inclusion Criteria: (1) documented HTN [≥2 office measurements of systolic blood pressure (SBP) > 140 mmHg and/or diastolic blood pressure (DBP) > 90 mmHg or current antihypertensive therapy]; (2) LVEF ≥50% (derived from CMR diagnostic reports); (3) absence of secondary LVH etiologies (such as moderate-severe valvular disease, alcoholic cardiomyopathy, and acquired or inherited cardiomyopathies confirmed by clinical or paraclinical investigations); (4) no structural heart disease (coronary artery disease, rheumatic heart disease, etc.); (5) normal hepatic and renal function and thyroid hormone levels. Exclusion Criteria: (1) failure to meet inclusion criteria; (2) inadequate image quality for analysis; (3) presence of focal LGE; (4) suspected hypertrophic cardiomyopathy (HCM) with diffuse ventricular wall thickening indistinguishable from HTN. Figure 1 shows the flow chart of the study.
The flowchart of study participants.
HTN patients were stratified into two groups based on left ventricular mass index (LVMI): HTN-LVH group (n = 71, 54 males, mean age 51.03 ± 12.50 years) and HTN-LVN group (n = 79, 50 males, mean age 56.75 ± 11.38 years). LVH was defined as LVMI >81 g/m² for men and >61 g/m² for women (15). A healthy control group matched by age and sex (n = 60, 29 males; mean age 50.42 ± 12.84 years) was concurrently enrolled, with confirmed normal cardiac structure/function and absence of HTN or other cardiovascular diseases. Patients with arrhythmia on routine electrocardiogram (ECG) or recurrent arrhythmias that required follow-up underwent 24-hour dynamic electrocardiography (DCG) monitoring. DCG monitoring identified 42 HTN patients with VA (HTN-LVH:23, HTN-LVN:19). VA were classified per the 2022 ESC Guidelines as: non-sustained ventricular tachycardia (≥3 consecutive premature ventricular contractions, rate >100 beats per minute, duration ≤30 s), sustained ventricular tachycardia (>30 s or requiring urgent intervention), or ventricular fibrillation (9). Clinical data for all participants were systematically collected.
CMR imaging protocol
All examinations were performed on a 3.0 T MRI scanner (Skyra, Siemens Healthineers, Germany). Using an 18-channel body matrix coil with retrospective ECG gating and respiratory compensation. Cine imaging was acquired using balanced steady-state free precession (b-SSFP) sequence with the following parameters: repetition time (TR) 39.48 ms, echo time (TE) 1.43 ms, flip angle 47°, field of view (FOV) 340 × 285 mm², slice thickness 5 mm with no gap. Imaging planes included two-chamber, three-chamber, four-chamber views, and short-axis stacks covering the LV from mitral annulus to apex. For LGE imaging, Gd-DTPA (Beijing Beilu Pharmaceutical Corporation, China) was administered intravenously at 0.05 mmol/kg followed by 20 mL saline flush. LGE images were obtained 8–10 min post-injection using a 2D phase-sensitive inversion recovery sequence. The relevant parameters are as follows: TR 750 ms, TE 2.1 ms, flip angle 20°, FOV 350 × 262.5 mm², slice thickness 5 mm with no gap, and inversion time (TI) individually adjusted between 260 and 370 ms.
Image analysis
Conventional cardiac function parameters were analyzed using the Syngo.via post-processing workstation (Siemens Healthineers, Germany). All cine images were imported, and the software automatically delineated endocardial and epicardial contours at end-systole and end-diastole. Following manual adjustment to exclude papillary muscles and trabeculae, parameters were normalized to body surface area (BSA). The derived indices included: LVEF, LVMI, left ventricular end-diastolic volume index (LVEDVI), left ventricular end-systolic volume index (LVESVI), cardiac index (CI). Maximum left ventricular wall thickness (LVMWT) was measured at end-diastole from short-axis cine images. LGE images were independently evaluated by two experienced radiologists to identify focal fibrotic lesions.
LV myocardial strain measurements were performed using CVI42 (version 5.11.1, Circle Cardiovascular Imaging, Calgary, Canada). Following import of the cine sequences, endocardial and epicardial contours at end-diastole were automatically identified by the software. After manual correction, the following strain and strain rate parameters were calculated: global longitudinal strain (GLS), global radial strain (GRS), global circumferential strain (GCS), global peak systolic longitudinal strain rate (sGLSR), systolic radial strain rate (sGRSR), systolic circumferential strain rate (sGCSR), global peak early-diastolic longitudinal strain rate (eGLSR), early-diastolic radial strain rate (eGRSR), early-diastolic circumferential strain rate (eGCSR) (are shown in Figure 2).
Cardiac magnetic resonance tissue tracking in four-chamber, two-chamber long-axis, and short-axis cine views at end-diastole (A–C). Global radial strain curve, global longitudinal strain curve and global circumferential strain curve for a hypertensive patient without left ventricular hypertrophy (D–F). GRS, global radial strain; GCS, global circumferential strain; GLS, global longitudinal strain.
Reproducibility of strain parameters
To evaluate measurement reliability, we randomly selected CMR images from 20 HTN patients and 10 healthy controls for reproducibility validation. Two radiologists, each with over 2 years of experience in CMR post-processing, independently measured LV strain parameters to assess inter-observer agreement. Intra-observer reproducibility was determined by selecting the same radiologist repeat measurements on the same 30 subjects after a 3-month interval.
Statistical analysis
Continuous variables were tested for normality with the Kolmogorov–Smirnov test and expressed as mean ± standard deviation (normally distributed) or median (interquartile range) (non-normal). Categorical variables were reported as frequencies (%). For three-group comparisons, normally distributed data were analyzed by one-way analysis of variance (ANOVA) with Bonferroni post-hoc correction, and non-normally distributed data by the Kruskal–Wallis H test. HTN patients with and without VA were compared using independent t-tests (normal data) or Mann–Whitney U-tests (non-normal data). Categorical variables were analyzed with chi-square or Fisher's exact tests. Pearson correlation evaluated associations between strain parameters and other continuous variables. Variable selection was performed using least absolute shrinkage and selection operator (LASSO) regression, with subsequent multivariate logistic regression identifying independent risk factors for VA in HTN patients. Receiver operating characteristic (ROC) curves assessed the discriminative ability of strain parameters for VA in HTN patients. Intraclass correlation coefficients (ICC) quantified intra- and inter-observer reliability of LV strain measurements. LASSO regression was performed using the glmnet package (version 4.18) in R, with all other analyses conducted in SPSS 25.0 (IBM Corp., NY). A two-tailed P < 0.05 defined statistical significance.
Results
Comparison of clinical characteristics and conventional LV function parameters
Comparisons of clinical characteristics and conventional LV function parameters among the control, HTN-LVN, and HTN-LVH groups are summarized in Table 1. Compared with the control group, HTN patients (HTN-LVN and HTN-LVH) had significantly higher body weight, DBP, and SBP (all P < 0.05). Smoking prevalence was higher in the HTN-LVH group than in controls (P < 0.05). Notably, LVEDVI demonstrated an initial decrease followed by an increase across the control, HTN-LVN, and HTN-LVH groups (P < 0.05), aligning with hypertensive LV remodeling. Conversely, LVMI and LVMWT showed a progressive increase with statistically significant differences across all subgroups (all P < 0.05). Age, sex, height, alcohol use, BSA, heart rate (HR), stroke volume index (SVI), CI, and LVEF did not differ significantly among the groups. Furthermore, in comparisons between the two HTN subgroups, the HTN-LVH group exhibited significantly higher SBP and a greater proportion of patients with a history of multi-drug antihypertensive therapy (Hx Multi-Drug AHT) (both P < 0.05), while no significant differences were observed in HTN duration, diabetes prevalence, or hyperlipidemia prevalence (despite 3 missing hyperlipidemia cases, sensitivity analysis classifying missing data as “Unverified” confirmed result robustness: ΔP < 0.10 vs. primary analysis; Supplementary Table 1).
Comparison of LV strain parameters
The LV strain parameters among control, HTN-LVN, and HTN-LVH groups are presented in Table 2 and Figure 3. GRS, GCS, GLS, and strain rate parameters (eGRSR, eGCSR, eGLSR) exhibited a progressive decrease across groups, with statistically significant differences observed in all intergroup comparisons (all P < 0.05). However, sGRSR and sGCSR were significantly reduced in the HTN-LVH group compared to controls (both P < 0.05), while no significant differences were observed between other subgroups (all P > 0.05).
*Half-violin plots displaying left ventricular strain parameters for the three study groups: global radial strain (GRS, A), global circumferential strain (GCS, B), and global longitudinal strain (GLS, C). Positive and negative values indicate the direction of myocardial motion. HTN-LVN, hypertensive patients without left ventricular hypertrophy; HTN-LVH, hypertensive patients with left ventricular hypertrophy. , P < 0.05 vs. Controls; #, P < 0.05 vs. HTN-LVN.
Correlation analysis
Pearson correlation analysis revealed significant linear relationships between LV global strain parameters and cardiac functional indices in all participants (Figure 4). DBP showed inverse correlations with GRS (r = −0.28), GCS (r = −0.22), and GLS (r = −0.45). Similarly, SBP correlated negatively with GRS (r = −0.32), GCS (r = −0.29), and GLS (r = −0.58). LVESVI demonstrated negative correlations with GRS (r = −0.35) and GCS (r = −0.35), while SVI showed positive correlations with GRS (r = 0.24) and GCS (r = 0.27). LVMI correlated inversely with GRS (r = −0.29), GCS (r = −0.28), and GLS (r = −0.58). LVMWT exhibited negative correlations with GRS (r = −0.21), GCS (r = −0.19), and GLS (r = −0.57). All correlations were statistically significant (P < 0.05).
Correlation analysis between global left ventricular myocardial strain and basic functional parameters. DBP, diastolic blood pressure; SBP, systolic blood pressure; LVEDVI, left ventricular end-diastolic volume index; LVESVI, left ventricular end-systolic volume index; SVI, stroke volume index; LVMI, left ventricular mass index; LVMWT, maximum left ventricular wall thickness; GRS, global radial strain; GCS, global circumferential strain; GLS, global longitudinal strain.
Comparison of parameters between HTN patients with and without VA
As shown in Table 3, HTN patients with VA demonstrated significantly higher LVEDVI and LVESVI, lower LVEF, and a higher proportion of Hx Multi-Drug AHT compared to those without VA (all P < 0.05). No significant differences were observed between the two groups in terms of height, weight, age, sex distribution, LVMI, LVMWT, SVI, CI, or HR. Notably, patients with VA exhibited reduced myocardial strain parameters including GRS, GCS, GLS, sGRSR, sGLSR, eGRSR, eGCSR, and eGLSR compared to VA-free patients (all P < 0.05), with the exception of sGCSR which showed no significant difference.
Risk factor analysis and diagnostic performance of strain parameters for VA in HTN patients
LASSO regression was employed for variable selection to construct a logistic prediction model. Figure 5 depicts the coefficients and mean standard error for 10-fold cross-validation. Following LASSO regression, 11 variables with nonzero coefficients were retained, as shown in Figure 6 and Table 4. Collinearity diagnostics revealed variance inflation factors (VIF) ranging from 1.089 to 1.897, indicating no significant multicollinearity among the variables. Multivariate logistic regression analysis demonstrated that only GCS, BSA, and Hx Multi-Drug AHT were independent predictors of VA in HTN patients (all P < 0.05), as presented in Table 4. ROC curve analysis (Figure 7) indicated high discriminatory value of GCS for distinguishing VA in HTN patients. Optimal predictive performance was achieved at a GCS cutoff of −17.005% [area under the curve (AUC) = 0.874, 95% CI 0.808–0.941; sensitivity 78.6%, specificity 88.9%]. The combined model integrating GCS, Hx Multi-Drug AHT, and BSA yielded an AUC of 0.923 (95% CI 0.868–0.960) with 85.71% sensitivity and 88.89% specificity.
Variable selection process using LASSO regression. (A) Coefficient trajectories of candidate predictors; (B) Cross-validation error curve with optimal lambda (λ).
Coefficients of variables selected by LASSO regression (Bar plot of non-zero coefficients at optimal lambda).
Receiver operating characteristic analysis of risk factors for ventricular arrhythmias in hypertensive patients. The combined indicator includes GCS, BSA, and Hx Multi-Drug AHT. GCS, global circumferential strain; BSA, body surface area; Hx Multi-Drug AHT, History of multi-drug antihypertensive therapy (concurrent use of ≥2 drug classes [e.g., Beta-blocker + Calcium blocker] for ≥3 months; AUC, area under the curve.
Reproducibility analysis of strain parameters
Table 5 summarizes the intra-observer and interobserver variability of LV strain parameters. The results demonstrated good agreement for all strain parameters except sGLSR. The intra-observer ICCs ranged from 0.862 to 0.927, while interobserver ICCs ranged from 0.751 to 0.900.
Discussion
This study utilized CMR-FT to assess LV myocardial mechanics in HTN patients, revealing four key findings. First, HTN patients exhibit early concordant reduction in LV strain parameters—affecting not only GLS but equally GCS and GRS. Second, all diastolic strain rate peaks were significantly lower in HTN patients vs. controls, while systolic strain rates in HTN-LVN showed no statistical difference from controls, indicating diastolic dysfunction may precede systolic impairment. Third, LV strain parameters significantly correlated with blood pressure levels, LVMI, and LVMWT. Fourth, HTN patients with VA exhibited markedly lower myocardial strain parameters than non-VA counterparts, and reduced GCS may serve as an independent risk factor for VA development in this population.
Compared to conventional parameters (LVEF, LVESVI, CI), myocardial strain demonstrates superior sensitivity in detecting early functional remodeling. Our study revealed significantly reduced GLS, GCS, and GRS in HTN patients even when traditional indices remained normal, with these alterations predating LVH development. The underlying mechanisms may involve early microvascular disarray and pathological changes in calcium dysregulation, which precede cardiomyocyte hypertrophy and fibrosis formation, ultimately impairing myocardial deformation capacity (16). Notably, while some studies report preserved or compensatory elevated circumferential/radial strain with initial longitudinal impairment in HTN (17, 18). our cohort demonstrated early concordant reduction across all directional strain components. This pattern suggests global rather than segmental involvement in the HTN remodeling process (19). Even in early-stage HTN, although subendocardial longitudinally-oriented fibers show predominant involvement, interstitial fibrosis extends into mid-myocardial and epicardial layers. Consequently, the myocardial microstructure may already differ significantly from normal myocardium at these initial stages.
In progressive HTN, worsening cardiomyocyte hypertrophy and myocardial fibrosis increase myocardial stiffness while reducing compliance. Concurrently, LVH diminishes capillary density and induces thickening of small coronary artery walls, precipitating microcirculatory dysfunction and myocardial ischemia. These pathological cascades progressively impair myocardial strain (20, 21). Our study demonstrated more pronounced strain impairment in HTN patients with LVH compared to the non-LVH group, indicating that strain deterioration parallels remodeling progression. Consistent with Niu et al.'s findings (22), LVH exerts greater detrimental effects on myocardial strain than diffuse interstitial fibrosis. Our correlation analyses confirmed significant inverse relationships between strain parameters (GRS, GCS, GLS) and both LVMI and LVMWT, establishing that strain reduction escalates with hypertrophy severity. Notably, the negative correlations between these strain parameters (GRS, GCS, GLS) and blood pressure further underscore the clinical imperative for stringent blood pressure control to mitigate mechanical dysfunction.
LV peak diastolic strain rate reflects the maximum myocardial deformation velocity during relaxation. It accurately captures subtle cardiac motion changes independent of tethering effects or global cardiac displacement (23). Our study demonstrated significantly reduced early-diastolic strain rates (eGRSR, eGCSR, and eGLSR) in all HTN patients (regardless of LVH status) compared to controls. Notably, peak systolic strain rates (sGRSR, sGCSR, sGLSR) remained comparable between HTN-LVN and healthy subjects. These findings establish diastolic dysfunction as the earliest functional manifestation of HTN cardiac injury, preceding detectable systolic impairment. Therefore, CMR-FT-derived myocardial strain measurements not only precisely evaluate diastolic dysfunction in HTN patients, but also provide deeper insights into the underlying pathological progression of the disease.
HTN patients are particularly susceptible to VA, which not only represent one of the most frequently observed rhythm disorders in this population (24, 25) but also confer a substantially increased risk of sudden cardiac death (26). Reduced strain in HTN patients has been widely reported (16, 17, 27); however, few studies have investigated strain changes in patients with coexisting VA. Our study demonstrated that compared to HTN patients without VA, those with comorbid VA exhibited significantly reduced strain parameters (GRS, GCS, GLS, sGRSR, sGLSR, eGRSR, eGCSR, eGLSR) alongside altered volumetric parameters—specifically elevated LVEDVI and LVESVI, and decreased LVEF. These findings indicate that arrhythmic comorbidity induces additional LV remodeling, thereby accelerating disease progression in HTN patients. Consequently, accurate assessment and monitoring of cardiac functional impairment in this population are imperative. Notably, VA occurrence showed no association with LVMI or LVMWT in our cohort, contradicting conventional views that prioritize LVH as the primary VA driver (4, 28). Beyond LVH, VA in HTN patients may arise from a combination of factors, including overactivation of the sympathetic nervous and renin-angiotensin-aldosterone systems, electrolyte disturbances and coronary microvascular dysfunction (CMD) (10). Research by Nicola Gaibazzi et al. (29) suggests that reduced myocardial strain may be associated with bystander and silent coronary artery disease. Thus, CMD potentially serves as a key link connecting a spectrum of morphological and functional remodeling (including myocardial hypertrophy, fibrosis, and reduced strain) with VA in HTN patients (30).
Multivariate regression demonstrated that GCS, BSA, and Hx Multi-Drug AHT were independent risk factors for VA in HTN patients, with GCS exhibiting the strongest correlation with VA risk. ROC analysis confirmed the superior diagnostic performance of GCS in distinguishing HTN patients with vs. without VA, and the combination of all three factors further increased the AUC. The LV wall consists of endocardial longitudinal fibers, mid-layer circumferential fibers, and epicardial oblique fibers (31). In HTN patients, early myocardial fibrosis primarily deposits in the subendocardial region, resulting in the most significant impairment in GLS (32). GCS reflects mid-epicardial circumferential motion, and its reduction is associated with mid-layer fibrosis and microcirculatory dysfunction (32, 33). Although GCS is initially less impaired than GLS, it progressively deteriorates with the progression of fibrosis. A significantly reduced GCS may therefore indicate extensive fibrosis, reflecting more severe myocardial structural remodeling and functional impairment, thereby potentially increasing susceptibility to VA. This may explain why reduced GCS demonstrates a stronger association with VA compared to GLS. Previous studies have confirmed that GCS predicts heart failure, myocardial infarction, stroke, and death (34, 35); our findings specifically link reduced GCS to future VA events in HTN patients. Therefore, assessing and monitoring myocardial strain parameters with targeted interventions is critical for HTN prognosis. We confirmed good-to-excellent intra- and inter-observer agreement (ICC 0.75–0.93) for CMR-FT-derived strain parameters, except sGLSR. This auxiliary indicator (vs. GLS as primary parameter) was excluded from our prediction model, thus its reproducibility limitation poses minimal impact.
Limitations
Several limitations should be acknowledged in this study. First, as a single-center observational study in which all enrolled patients underwent CMR, the findings are subject to selection bias and should not be directly extrapolated to the general HTN population in routine clinical management. In addition, the relatively modest sample size inherent to this retrospective investigation, along with the lack of both external validation in independent cohorts and internal cross-validation, limits the robustness and generalizability of the findings. Second, The absence of longitudinal follow-up data limits prognostic assessment. Future investigations should specifically evaluate the prognostic value of CMR-FT-derived strain parameters in HTN patients, particularly those with concomitant VA, to better define their clinical significance for risk stratification. Third, while CMR-FT demonstrates significant clinical value, its dependency on specialized software and additional post-processing workflows currently limits widespread adoption. The integration of artificial intelligence may streamline strain quantification in future applications. Fourth, while T1 mapping and ECV fraction provide valuable assessment of diffuse fibrosis, technical constraints limited their systematic application in our early cohort. Future prospective studies will incorporate these techniques to examine their interactions with myocardial deformation parameters in VA risk evaluation. Finally, although CMR-FT and echocardiographic strain parameters show good agreement in literature (36, 37), the lack of contemporaneous echocardiographic data in our retrospective cohort precludes direct comparison, requiring verification in future multimodality studies.
Conclusion
In summary, CMR-FT-derived myocardial strain parameters enable early identification of LV dysfunction in HTN patients. Among these parameters, GCS may serve as a simple and reliable imaging marker to distinguish HTN patients complicated by VA, offering potential as an intervention target for preventing cardiac remodeling and arrhythmia progression in this population.
The reference list from the paper itself. Each links out to its DOI / PubMed record.
- 1WHO. Global Report on Hypertension: The Race Against a Silent Killer. Geneva: World Health Organization (2023). p. 1–291. Available online at: https://www.who.int/publications/i/item/9789240081062
- 2Tadic M Cuspidi C Plein S Milivojevic IG Wang DW Grassi G Comprehensive assessment of hypertensive heart disease: cardiac magnetic resonance in focus. Heart Fail Rev. (2020) 26(6):1383–90. 10.1007/s 10741-020-09943-x 32170529 · doi ↗ · pubmed ↗
- 3Grajewski KG Stojanovska J Ibrahim E-SH Sayyouh M Attili A. Left ventricular hypertrophy: evaluation with cardiac MRI. Curr Probl Diagn Radiol. (2020) 49(6):460–75. 10.1067/j.cpradiol.2019.09.00531630875 · doi ↗ · pubmed ↗
- 4Afzal MR Savona S Mohamed O Mohamed-Osman A Kalbfleisch SJ. Hypertension and arrhythmias. Heart Fail Clin. (2019) 15(4):543–50. 10.1016/j.hfc.2019.06.01131472889 · doi ↗ · pubmed ↗
- 5Sutton MGSJ Sharpe N. Left ventricular remodeling after myocardial infarction pathophysiology and therapy. Clinical Cardiology: New Frontiers. (2000) 101(25):2981–8. 10.1161/01.CIR.101.25.298110869273 · doi ↗ · pubmed ↗
- 6Almahameed ST Ziv O. Ventricular arrhythmias. Mdical Clinics. (2019) 103(5):881–95. 10.1016/j.mcna.2019.05.00831378332 · doi ↗ · pubmed ↗
- 7Khalique OK Bello NA. Are we getting closer to the HEART of hypertensive heart disease? Hypertension. (2019) 74(2):257–9. 10.1161/hypertensionaha.119.1316931256720 PMC 6938583 · doi ↗ · pubmed ↗
- 8Papanastasiou CA Bazmpani M-A Kampaktsis PN Zegkos T Gossios T Parcharidou D Cardiac magnetic resonance for ventricular arrhythmias a systematic review and meta-analysis. Heart. (2024) 110(18):1113–23. 10.1136/heartjnl-2024-32418239084706 · doi ↗ · pubmed ↗