Construction and validation of a risk prediction model for hyperamylasemia after kidney transplantation
Linde Li, Guifeng Dang, Feiyi Du, Meisi Li, Qianhua Ma, Ning Wen, Jiqiu Wen, Jianhui Dong, Xuyong Sun

TL;DR
This study creates a risk prediction model to identify kidney transplant patients likely to develop hyperamylasemia, helping doctors monitor and manage risks more effectively.
Contribution
The study introduces a novel nomogram for predicting hyperamylasemia after kidney transplantation, validated internally with clinical data.
Findings
The nomogram incorporates six factors including WBC count, tacrolimus concentration, and donor age to predict hyperamylasemia risk.
The model achieved an AUC of 0.73 in both training and validation cohorts, indicating moderate predictive accuracy.
Calibration plots and decision curve analysis confirmed the model's clinical utility and reliability.
Abstract
Kidney transplantation (KT) is the preferred treatment for patients with end-stage renal disease (ESRD); however, postoperative hyperamylasemia (HA) remains common and has been associated with acute rejection (AR), infection, and impaired graft function. Early identification of HA risk factors is essential to improve outcomes of kidney transplant recipients (KTR). This study aimed to develop and internally validate a novel nomogram for predicting the risk of HA after KT, thereby supporting personalized monitoring, prevention and intervention strategies. We retrospectively analyzed KTR treated at the Transplant Medicine Institution of the Second Affiliated Hospital of Guangxi Medical University from July 2021 to June 2022. Based on admission dates, patients were assigned to a training cohort (n=243, July 2021 to March 2022) and a validation cohort (n=107, April 2022 to June 2022). In…
Genes, proteins, chemicals, diseases, species, mutations and cell lines named across the full text — each resolved to its canonical identifier and authoritative record.
Click any figure to enlarge with its caption.
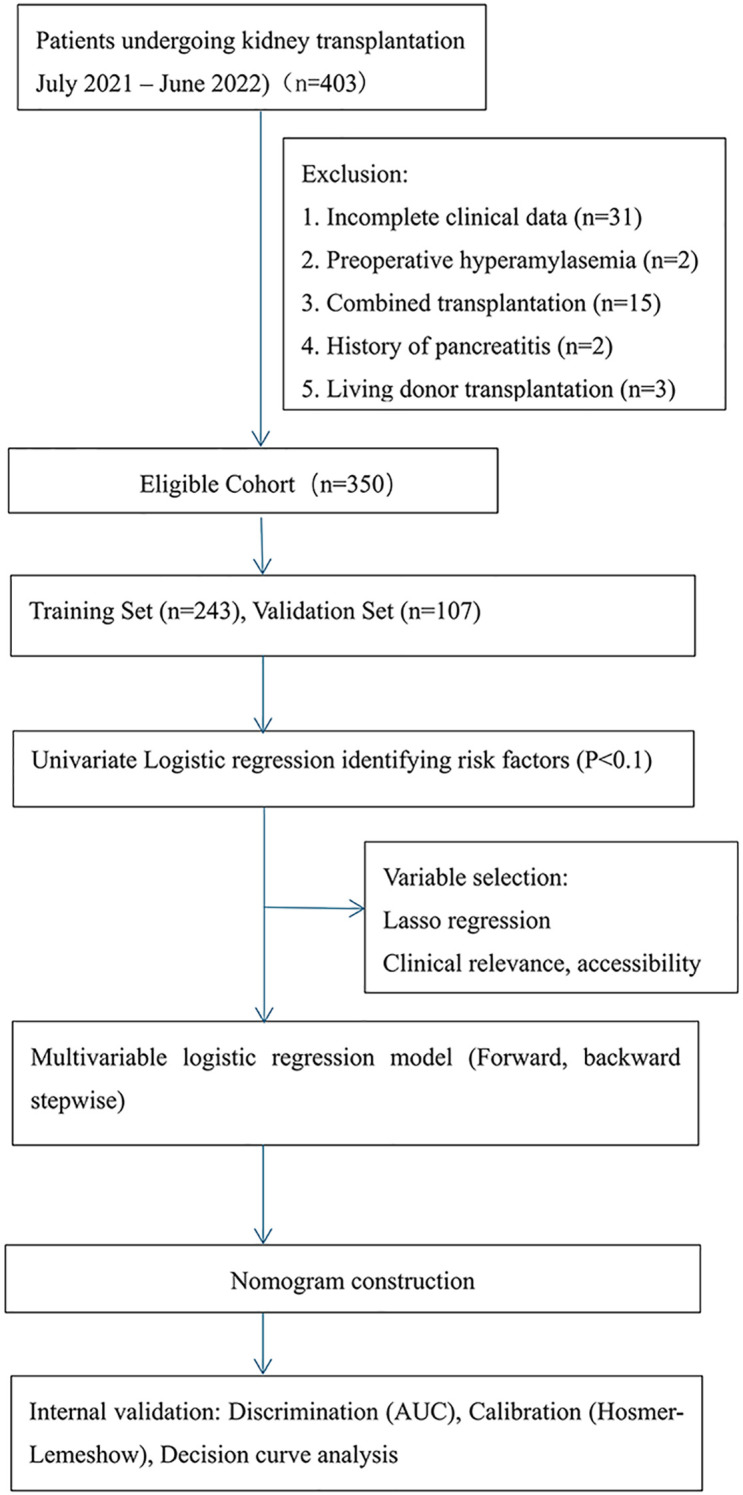 Figure 1
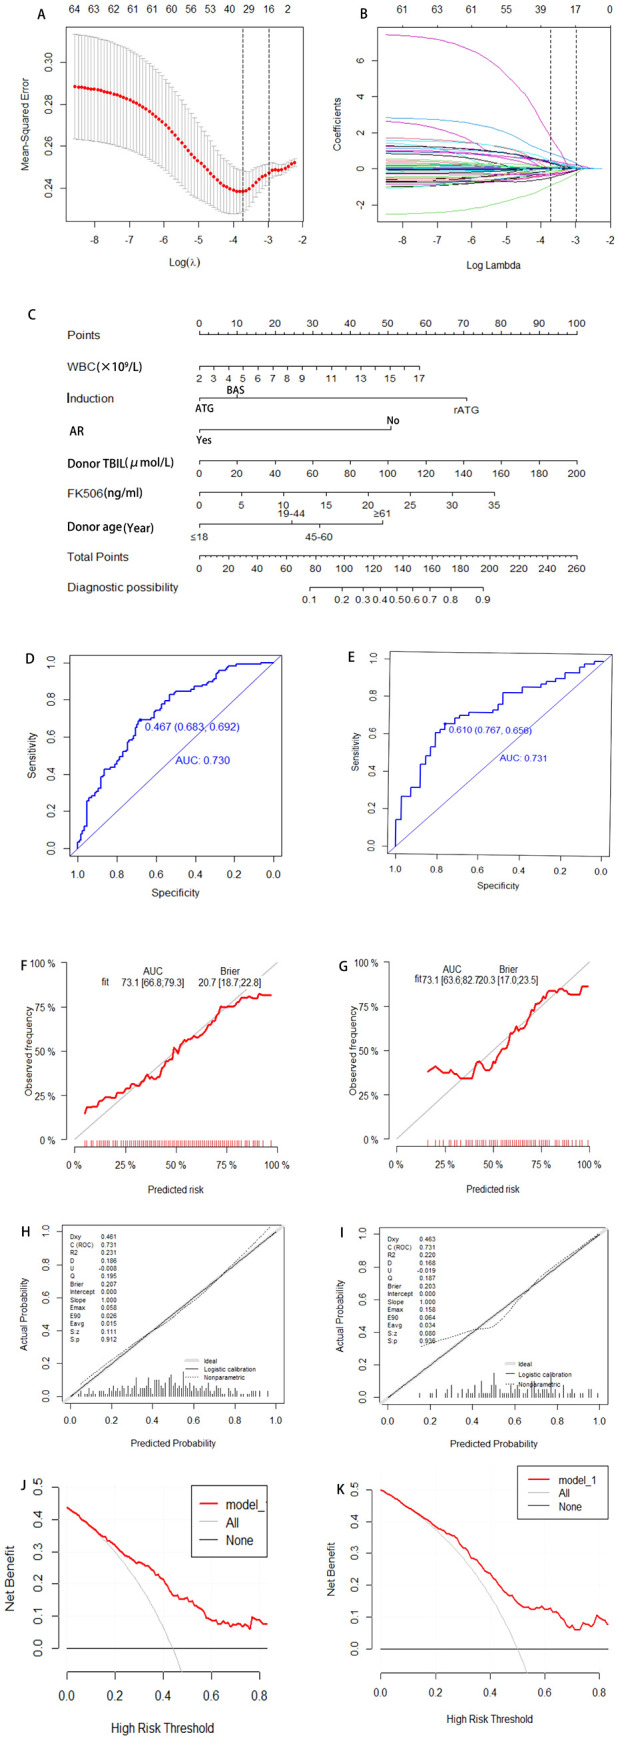 Figure 2
| Variable | Total (N = 350) | Normal amylase group (N = 169) | Hyperamylasemia group (N = 181) |
|
|---|---|---|---|---|
| Recipient | ||||
| Gender | 0.31 | |||
| Female | 115 | 51 (30.2%) | 64 (35.4%) | |
| Male | 235 | 118 (69.8%) | 117 (64.6%) | |
| Age (year) | 39.0 (32.0,49.0) | 38.0 (31.0, 47.0) | 40.0 (32.0, 49.0) | 0.30 |
| BMI (kg/m2) | 22.1 (19.7,24.5) | 22.2 (20.2, 24.5) | 22.0 (19.5, 24.5) | 0.65 |
| Dialysis modality | <0.01 | |||
| Not dialyzed | 5 | 1 (0.6%) | 4 (2.2%) | |
| HD | 269 | 131 (77.5%) | 138 (76.2%) | |
| PD | 41 | 27 (16.0%) | 14 (7.7%) | |
| HD+PD | 35 | 10 (5.9%) | 25 (13.8%) | |
| Hospital stay duration (day) | 10 (8.0,15.0) | 9.0 (7.0, 12.0) | 10.0 (8.0, 16.0) | <0.01 |
| Dialysis duration (month) | 24 (14.0,48.0) | 24.0 (15.0, 41.0) | 26.0 (14.0, 48.0) | 0.74 |
| Hypertension | 0.27 | |||
| No | 47 | 19 (11.2%) | 28 (15.5%) | |
| Yes | 303 | 150 (88.8%) | 153 (84.5%) | |
| HPT | 0.02 | |||
| No | 185 | 100 (50.2%) | 85 (47%) | |
| Yes | 165 | 69 (40.8%) | 96 (53.0%) | |
| Surgical history | 0.41 | |||
| No | 246 | 115 (68.0%) | 131 (72.4%) | |
| Yes | 94 | 54 (32.0%) | 50 (27.6%) | |
| History of blood transfusion | 0.70 | |||
| No | 273 | 130 (76.9%) | 143 (79.0%) | |
| Yes | 77 | 39 (23.1%) | 38 (21.0%) | |
| Smoking history | 0.27 | |||
| No | 286 | 134 (79.3%) | 152 (84.0%) | |
| Yes | 64 | 35 (20.7%) | 29 (16.0%) | |
| Drinking history | 0.32 | |||
| No | 291 | 137 (81.1%) | 154 (85.1%) | |
| Yes | 59 | 32 (18.9%) | 27 (14.9%) | |
| HLA antibodies | 1.00 | |||
| NO | 323 | 156 (92.3%) | 167 (92.3%) | |
| Yes | 27 | 13 (7.7%) | 14 (7.7%) | |
| Operation time (min) | 165 (144,185) | 163.0 (146.0, 185.0) | 165.0 (140.0, 185.0) | 0.51 |
| Blood type | 0.17 | |||
| A | 76 | 41 (24.3%) | 35 (19.3%) | |
| B | 73 | 27 (16.0%) | 46 (25.4%) | |
| O | 173 | 87 (51.5%) | 86 (47.5%) | |
| AB | 28 | 14 (8.3%) | 14 (7.7%) | |
| HLA antibodies | 1.00 | |||
| NO | 323 | 156 (92.3%) | 167 (92.3%) | |
| Yes | 27 | 13 (7.7%) | 14 (7.7%) | |
| Blood glucose | 0.38 | |||
| Normal | 295 | 139 (82.2%) | 156 (86.2%) | |
| Abnormal | 55 | 30 (17.8%) | 25 (13.8%) | |
| Blood lipid | 0.34 | |||
| Normal | 164 | 84 (49.7%) | 80 (44.2%) | |
| Abnormal | 186 | 85 (50.3%) | 101 (55.8%) | |
| Maintenance regimen | 0.31 | |||
| MPA+FK506 +Pred | 310 | 153 (90.5%) | 157 (86.7%) | |
| MMF+FK506 +Pred | 40 | 16 (9.5%) | 24 (13.3%) | |
| Induction | 0.06 | |||
| BAS | 238 | 110 (65.1%) | 128 (70.7%) | |
| ATG | 95 | 54 (32.0%) | 41 (22.7%) | |
| rATG | 17 | 5 (3.0%) | 12 (6.6%) | |
| Hormone pulse | 0.88 | |||
| No | 303 | 147 (87.0%) | 156 (86.2%) | |
| Yes | 47 | 22 (13.0%) | 25 (13.8%) | |
| DGF | 0.70 | |||
| No | 320 | 156 (92.3%) | 164 (90.6%) | |
| Yes | 30 | 13 (7.7%) | 17 (9.4%) | |
| AR | 0.04 | |||
| No | 334 | 157 (92.9%) | 177 (97.8%) | |
| Yes | 16 | 12 (7.1%) | 4 (2.2%) | |
| FK506 trough | 6.6 (4.8, 8.9) | 6.3 (4.5, 8.4) | 7.1 (5.1, 9.4) | <0.01 |
| Donor | ||||
| Age (year) | 48 (37,55) | 46.0 (35.0, 54.0) | 48.0 (38.0, 56.0) | 0.03 |
| Infectious markers | 0.73 | |||
| Normal | 313 | 150 (88.8%) | 163 (90.1%) | |
| Abnormal | 37 | 19 (11.2%) | 18 (9.9%) | |
| Pathogens | 0.47 | |||
| Negative | 294 | 139 (82.2%) | 155 (85.6%) | |
| Positive | 56 | 30 (17.8%) | 26 (14.4%) | |
| Gender | 0.51 | |||
| Female | 74 | 33 (19.5%) | 41 (22.7%) | |
| Male | 276 | 136 (80.5%) | 140 (77.3%) | |
| BMI (kg/m2) | 23.5 (22,25) | 23.5 (21.3, 25.3) | 23.5 (22.0, 25.1) | 0.39 |
| ICU length of stay (day) | 5.6 (3.3,10) | 5.8 (3.3, 10.8) | 5.5 (3.2, 9.2) | 0.43 |
| OPO intervention time (hour) | 37.9 (24,55) | 36.0 (21.1, 45.2) | 38.5 (28.3, 56.0) | 0.08 |
| Cold ischemia time (hour) | 10 (8.5, 12.3) | 10.0 (8.6, 12.4) | 10.0 (8.5, 12.3) | 0.99 |
| History of CPR | 0.89 | |||
| No | 291 | 140 (82.8%) | 151 (83.4%) | |
| Yes | 59 | 29 (17.2%) | 30 (16.6%) | |
| Variable | Training cohort (n=243) | Validation cohort (n=107) | ||||
|---|---|---|---|---|---|---|
| Normal amylase group (n=126) | Hyperamylasemia group (n=117) |
| Normal amylase group(n=43) | Hyperamylasemia group (n=64) |
| |
| Preoperative recipient | ||||||
| Gender | 0.13 | 0.54 | ||||
| Female | 33 (26.2%) | 42 (35.9%) | 18 (41.9%) | 22 (34.4%) | ||
| Male | 93 (73.8%) | 75 (64.1%) | 25 (58.1%) | 42 (65.6%) | ||
| Age (year) | 0.05 | 0.80 | ||||
| ≤18 | 6 (4.8%) | 2 (1.7%) | 0 (0.0%) | 1 (1.6%) | ||
| 19-44 | 82 (65.1%) | 65 (55.6%) | 30 (69.8%) | 40 (62.5%) | ||
| 45-60 | 33 (26.2%) | 48 (41.0%) | 11 (25.6%) | 21 (32.8%) | ||
| ≥ 61 | 5 (4.0%) | 2 (1.7%) | 2 (4.6%) | 2 (3.1%) | ||
| BMI (kg/m2) | 0.26 | 0.78 | ||||
| <18.49 | 13 (10.3%) | 20 (17.1%) | 6 (14.0%) | 7 (10.9%) | ||
| 18.50-24.99 | 86 (68.3%) | 70 (59.8%) | 29 (67.4%) | 44 (68.8%) | ||
| 25.00-29.99 | 24 (19.0%) | 21 (17.9%) | 8 (18.6%) | 11 (17.2%) | ||
| >30.00 | 3 (2.4%) | 6 (5.1%) | 0 (0.0%) | 2 (3.1%) | ||
| Dialysis modality | 0.12 | 0.03 | ||||
| No dialysis | 1 (0.8%) | 2 (1.7%) | 0 (0.0%) | 2 (3.1%) | ||
| HD | 98 (77.8%) | 92 (78.6%) | 33 (76.7%) | 46 (72.0%) | ||
| PD | 18 (14.3%) | 8 (6.8%) | 9 (20.9%) | 6 (9.3%) | ||
| HD+PD | 9 (7.1%) | 15 (12.8%) | 1 (2.4%) | 10 (15.6%) | ||
| Blood type | 0.35 | 0.11 | ||||
| A | 28 (22.2%) | 23 (19.7%) | 13 (30.2%) | 12 (18.8%) | ||
| B | 21 (16.7%) | 28 (23.9%) | 6 (14.0%) | 18 (28.1%) | ||
| O | 65 (51.6%) | 60 (51.3%) | 22 (51.2%) | 26 (40.6%) | ||
| AB | 12 (9.5%) | 6 (5.1%) | 2 (4.6%) | 8 (12.5%) | ||
| HLA antibodies | 1.00 | 1.00 | ||||
| No | 118 (93.7%) | 110 (94.0%) | 38 (88.4%) | 57 (89.1%) | ||
| Yes | 8 (6.3%) | 7 (6.0%) | 5 (11.6%) | 7 (10.9%) | ||
| WBC (×109/L) | 6.2 (4.8, 8.1) | 7.4 (6.0, 8.8) | <0.01 | 6.5 (5.1, 8.0) | 6.1 (5.2, 7.8) | 0.57 |
| NEU (%) | 0.7 (0.6, 0.8) | 0.7 (0.6, 0.8) | 0.24 | 0.7 (0.6, 0.8) | 0.7 (0.6, 0.8) | 0.49 |
| Ca2+(mmol/L) | 2.3 (2.2, 2.4) | 2.3 (2.2, 2.5) | 0.38 | 2.3 (2.1, 2.4) | 2.2 (2.0, 2.4) | 0.74 |
| PCT (ng/ml) | 0.5 (0.3, 1.1) | 0.6 (0.3, 1.4) | 0.40 | 0.3 (0.2, 0.8) | 0.4 (0.2, 0.6) | 0.54 |
| CRP (mg/L) | 4.8(2.2, 10.1) | 3.8 (1.8, 8.0) | 0.20 | 2.5 (1.5, 5.4) | 2.9 (1.6, 4.9) | 0.60 |
| Dialysis duration | 0.25 | 0.56 | ||||
| ≤34 | 68 (54.0%) | 54 (46.2%) | 20 (46.5%) | 34 (53.1%) | ||
| ≥35 | 58 (46.0%) | 63 (53.8%) | 23 (53.5%) | 30 (46.9%) | ||
| Blood glucose | 0.51 | 0.75 | ||||
| Normal | 101 (80.2%) | 98 (83.8%) | 38 (88.4%) | 58 (90.6%) | ||
| Abnormal | 25 (19.8%) | 19 (16.2%) | 5 (11.6%) | 6 (9.4%) | ||
| Blood lipid | 0.37 | 0.84 | ||||
| Normal | 63 (50.0%) | 51 (43.6%) | 21 (48.8%) | 29 (45.3%) | ||
| Abnormal | 63 (50.0%) | 66 (56.4%) | 22 (51.2%) | 35 (54.7%) | ||
| Hypertension | 0.47 | 0.35 | ||||
| No | 16 (12.7%) | 19 (16.2%) | 3 (7.0%) | 9 (14.1%) | ||
| Yes | 110 (87.3%) | 98 (83.8%) | 40 (93.0%) | 55 (85.9%) | ||
| HPT | 0.03 | 0.82 | ||||
| No | 90 (71.4%) | 68 (58.1%) | 10 (23.3%) | 17 (26.6%) | ||
| Yes | 36 (28.6%) | 49 (41.9%) | 33 (76.7%) | 47 (73.4%) | ||
| Surgical history | 0.12 | 0.68 | ||||
| No | 85 (67.5%) | 90 (76.9%) | 30 (69.8%) | 41 (64.1%) | ||
| Yes | 41 (32.5%) | 27 (23.1%) | 13 (30.2%) | 23 (35.9%) | ||
| History of blood | 0.36 | 0.47 | ||||
| No | 94 (74.6%) | 94 (80.3%) | 36 (83.7%) | 49 (76.6%) | ||
| Yes | 32 (25.4%) | 23 (19.7%) | 7 (16.3%) | 15 (23.4%) | ||
| Smoking history | 0.41 | 0.61 | ||||
| No | 100 (79.4%) | 98 (83.8%) | 34 (79.1%) | 54 (84.4%) | ||
| Yes | 26 (20.6%) | 19 (16.2%) | 9 (20.1%) | 10 (15.6%) | ||
| Drinking history | 0.23 | 1.00 | ||||
| No | 101 (80.2%) | 101 (86.3%) | 36 (83.7%) | 53 (82.8%) | ||
| Yes | 25 (19.8%) | 16 (13.7%) | 7 (16.3%) | 11 (17.2%) | ||
| Perioperative Recipients | ||||||
| DGF | 0.44 | 1.00 | ||||
| No | 113 (89.7%) | 101 (86.3%) | 43 (100.0%) | 63 (98.4%) | ||
| Yes | 13 (10.3%) | 16 (13.7%) | 0 (0.0%) | 1 (1.6%) | ||
| AR | 0.07 | 1.00 | ||||
| No | 114 (90.5%) | 113 (96.6%) | 43 (100.0%) | 64 (100.0%) | ||
| Yes | 12 (9.5%) | 4 (3.4%) | 0 (0.0%) | 0 (0.0%) | ||
| Operation time | 0.70 | 0.69 | ||||
| ≤172 | 69 (54.8%) | 61 (52.1%) | 18 (41.9%) | 30 (46.9%) | ||
| >172 | 57 (45.2%) | 56 (47.9%) | 25 (58.1%) | 34 (53.1%) | ||
| Hospital stay | 0.11 | 0.32 | ||||
| ≤13 | 83 (65.9%) | 65 (55.6%) | 25 (58.1%) | 30 (46.9%) | ||
| ≥ 14 | 43 (34.1%) | 52 (44.4%) | 18 (41.9%) | 34 (53.1%) | ||
| Maintenance regimen | 0.24 | 0.82 | ||||
| MPA+FK506 +Pred | 122 (96.8%) | 109 (93.2%) | 31 (72.1%) | 48 (75.0%) | ||
| MMF+FK506 +Pred | 4 (3.2%) | 8 (6.8%) | 12 (27.9%) | 16 (25.0%) | ||
| Induction | 0.02 | 0.65 | ||||
| BAS | 82 (65.1%) | 81 (69.2%) | 28 (65.1%) | 47 (73.4%) | ||
| ATG | 42 (33.3%) | 27 (23.1%) | 12 (27.9%) | 14 (21.9%) | ||
| rATG | 2 (1.6%) | 9 (7.7%) | 3 (7.0%) | 3 (4.7%) | ||
| Hormone pulse | 0.58 | 0.76 | ||||
| No | 110 (87.3%) | 99 (84.6%) | 37 (86.1%) | 57 (89.1%) | ||
| Yes | 16 (12.7%) | 18 (15.4%) | 6 (13.9%) | 7 (10.9%) | ||
| FK506 trough | 6.4 | 7.0 | 0.12 | 6.2 | 7.3 | 0.01 |
| CRP (mg/L) | 25.9(16.7,41.2) | 26.9 (19.2, 43.7) | 0.32 | 21.9(14.1,38.1) | 23.5 (17.2, 35.7) | 0.79 |
| PCT (ng/mL) | 1.5 (0.6, 3.6) | 2.6 (0.8, 7.1) | <0.01 | 2.1 (0.6, 3.5) | 2.1 (0.6, 4.1) | 0.81 |
| WBC (×109/L) | 13.8(11.2,16.8) | 15.5 (13.4, 18.3) | <0.01 | 15.0(13.2,20.2) | 14.9 (11.9,18.9) | 0.65 |
| NEU (%) | 0.9 (0.9, 1.0) | 0.9 (0.9, 1.0) | 0.04 | 1.0 (0.9, 1.0) | 0.9 (0.9, 1.0) | 0.09 |
| Donor | ||||||
| Age (year) | 0.10 | 0.61 | ||||
| ≤18 | 15 (11.9%) | 5 (4.3%) | 2 (4.7%) | 4 (6.2%) | ||
| 19-44 | 41 (32.5%) | 35 (29.9%) | 19 (44.2%) | 20 (31.3%) | ||
| 45-60 | 61 (48.4%) | 63 (53.8%) | 19 (44.2%) | 33 (51.6%) | ||
| ≥ 61 | 9 (7.1%) | 14 (12.0%) | 3 (6.9%) | 7 (10.9%) | ||
| Infectious | 0.14 | 0.23 | ||||
| Normal | 110 (87.3%) | 109 (93.2%) | 40 (93.0%) | 54 (84.4%) | ||
| Abnormal | 16 (12.7%) | 8 (6.8%) | 3 (7.0%) | 10 (15.6%) | ||
| Cold ischemia | 0.90 | 0.44 | ||||
| <10.58 h | 63 (50.0%) | 57 (48.7%) | 20 (46.5%) | 35 (54.7%) | ||
| ≥10.58h | 63 (50.0%) | 60 (51.3%) | 23 (53.5%) | 29 (45.3%) | ||
| Pathogens | 0.21 | 0.80 | ||||
| Negative | 103 (81.7%) | 103 (88.0%) | 36 (83.7%) | 52 (81.3%) | ||
| Positive | 23 (18.3%) | 14 (12.0%) | 7 (16.3%) | 12 (18.7%) | ||
| Gender | 1.00 | 0.36 | ||||
| Female | 25 (19.8%) | 24 (20.5%) | 8 (18.6%) | 17 (26.6%) | ||
| Male | 101 (80.2%) | 93 (79.5%) | 35 (81.4%) | 47 (73.4%) | ||
| BMI (kg/m2) | 0.73 | 0.86 | ||||
| <18.49 | 6 (4.8%) | 7 (6.0%) | 2 (4.7%) | 4 (6.2%) | ||
| 18.50-24.99 | 86 (68.3%) | 81 (69.2%) | 32 (74.4%) | 43 (67.2%) | ||
| 25-29.99 | 31 (24.6%) | 24 (20.5%) | 8 (18.6%) | 14 (21.9%) | ||
| >30 | 3 (2.4%) | 5 (4.3%) | 1 (2.3%) | 3 (4.7%) | ||
| ICU length of | 0.52 | 1.00 | ||||
| ≤5.6 | 60 (47.6%) | 61 (52.1%) | 21 (48.8%) | 32 (50.0%) | ||
| >5.61 | 66 (52.4%) | 56 (47.9%) | 22 (51.2%) | 32 (50.0%) | ||
| OPO intervention | 0.09 | 0.54 | ||||
| ≤37.85 | 77 (61.1%) | 58 (49.6%) | 18 (41.9%) | 22 (34.4%) | ||
| >37.85 | 49 (38.9%) | 59 (50.4%) | 25 (58.1%) | 42 (65.6%) | ||
| WBC (×109/L) | 14.4(10.7,18.6) | 12.6(8.3,16.7) | 0.03 | 11.5(8.6,16.2) | 14.6 (10.9,19.4) | <0.01 |
| NEU (%) | 0.9 (0.8, 0.9) | 0.9 (0.8, 0.9) | 0.91 | 0.9 (0.8, 0.9) | 0.9 (0.8, 0.9) | 0.04 |
| LYM (%) | 0.1 (0.0, 0.1) | 0.1 (0.0, 0.1) | 0.88 | 0.1 (0.0, 0.1) | 0.1 (0.0, 0.1) | 0.06 |
| REC (×1012/L) | 3.5 (2.7, 4.1) | 3.2 (2.4, 4.1) | 0.10 | 2.8 (2.3, 3.7) | 3.3 (2.5, 3.6) | 0.27 |
| HGB (g/L) | 103.5 | 91.0 | 0.01 | 76.0 | 91.0 | 0.04 |
| PLT (×109/L) | 176.0 | 145.0 | 0.08 | 142.0 | 138.0 | 0.50 |
| CRP (mg/L) | 157.2 | 150.0 | 0.57 | 126.6 | 140.5 | 0.54 |
| PCT (ng/mL) | 1.7 (0.8, 7.1) | 1.9 (0.7, 8.8) | 0.61 | 2.8 (0.6, 8.3) | 1.5 (0.6, 6.6) | 0.46 |
| Blood glucose | 0.89 | 1.00 | ||||
| Normal | 36 (28.6%) | 32 (27.4%) | 16 (37.2%) | 25 (39.1%) | ||
| Abnormal | 90 (71.4%) | 85 (72.6%) | 27 (62.8%) | 39 (60.9%) | ||
| TBIL (μmol/L) | 15.4(9.7,25.0) | 18.2 (11.4, 33.2) | 0.02 | 15.6(12.1,23.1) | 15.4 (11.1, 25.1) | 0.75 |
| DBIL (μmol/L) | 8.2(4.7,14.3) | 9.0 (6.0, 18.8) | 0.02 | 9.0 (5.1, 17.2) | 8.6 (4.9, 13.9) | 0.76 |
| IBIL (μmol/L) | 6.7(4.1,10.0) | 7.7 (4.3, 12.0) | 0.03 | 6.6 (4.1, 11.8) | 6.8 (4.6, 12.0) | 0.91 |
| ALT (U/L) | 28.5(15.0,52.0) | 30.0 (18.0, 56.0) | 0.69 | 33.0(17.0,75.0) | 32.5 (19.1, 56.0) | 0.47 |
| AST (U/L) | 42.0(28.0,71.0) | 52.0 (33.0, 113.0) | 0.02 | 53.7(34.0,92.0) | 41.0 (27.0, 86.5) | 0.26 |
| BUN (mmol/L) | 7.0(5.1, 11.0) | 7.4 (4.9, 11.4) | 0.63 | 7.4(5.5, 16.0) | 6.8 (5.0, 11.9) | 0.37 |
| SCr (μmol/L) | 90.0 | 102.0 | 0.01 | 103.0 | 103.0 | 0.94 |
| K+ (mmol/L) | 4.2 (3.7, 4.6) | 4.2 (4.0, 4.9) | 0.12 | 4.0 (3.7, 4.4) | 4.0 (3.7, 4.6) | 0.82 |
| Na+ (mmol/L) | 145.6 | 144.1 | 0.48 | 145.9 | 144.8 | 0.85 |
| Ca2+ (mmol/L) | 2.2 (2.1, 2.4) | 2.2 (2.0, 2.4) | 0.79 | 2.3 (2.1, 2.4) | 2.2 (2.1, 2.4) | 0.78 |
| CPR | 0.52 | 0.22 | ||||
| No | 104 (82.5%) | 92 (78.6%) | 36 (83.7%) | 59 (92.2%) | ||
| Yes | 22 (17.5%) | 25 (21.4%) | 7 (16.3%) | 5 (7.8%) | ||
| Variable | B | SE | Z | OR | 95% CI |
| |||
|---|---|---|---|---|---|---|---|---|---|
| Preoperative Recipient | |||||||||
| Gender | -0.456 | 0.280 | 2.662 | 0.634 | 0.366 - 1.096 | 0.103 | |||
| Age (year) | 0.383 | 0.220 | 3.030 | 1.466 | 0.953 - 2.256 | 0.082 | |||
| Blood type | |||||||||
| A | 3.294 | 0.348 | |||||||
| B | 0.496 | 0.574 | 0.749 | 1.643 | 0.534 - 5.058 | 0.387 | |||
| O | 0.981 | 0.577 | 2.886 | 2.667 | 0.860 - 8.268 | 0.089 | |||
| AB | 0.613 | 0.531 | 1.333 | 1.846 | 0.652 - 5.228 | 0.248 | |||
| BMI (kg/m2) | -0.052 | 0.191 | 0.076 | 0.949 | 0.653 - 1.379 | 0.783 | |||
| Hypertension | -0.287 | 0.367 | 0.614 | 0.750 | 0.366 - 1.539 | 0.433 | |||
| HPT | 0.589 | 0.272 | 4.682 | 1.801 | 1.057 - 3.070 | 0.030 | |||
| Surgical history | -0.475 | 0.290 | 2.675 | 0.622 | 0.352 - 1.099 | 0.102 | |||
| History of blood | -0.330 | 0.310 | 1.136 | 0.719 | 0.392 - 1.319 | 0.287 | |||
| Smoking history | -0.293 | 0.334 | 0.774 | 0.746 | 0.388 - 1.434 | 0.379 | |||
| Drinking history | -0.446 | 0.350 | 1.629 | 0.640 | 0.322 - 1.270 | 0.202 | |||
| Dialysis modality | |||||||||
| No dialysis | 5.329 | 0.149 | |||||||
| HD | 0.182 | 1.295 | 0.020 | 1.200 | 0.095 - 15.196 | 0.888 | |||
| PD | -0.574 | 0.446 | 1.657 | 0.563 | 0.235 - 1.350 | 0.198 | |||
| HD+PD | -1.322 | 0.599 | 4.875 | 0.267 | 0.082 - 0.862 | 0.027 | |||
| Dialysis duration | 0.313 | 0.258 | 1.479 | 1.368 | 0.826 - 2.266 | 0.224 | |||
| WBC (×109/L) | 0.150 | 0.053 | 7.828 | 1.161 | 1.046 - 1.290 | 0.005 | |||
| NEU (%) | 1.332 | 1.154 | 1.331 | 3.788 | 0.394 - 36.399 | 0.249 | |||
| Blood calcium | 0.465 | 0.556 | 0.702 | 1.593 | 0.536 - 4.733 | 0.402 | |||
| PCT (ng/ml) | 0.005 | 0.014 | 0.114 | 1.005 | 0.977 - 1.033 | 0.735 | |||
| CRP (mg/L) | -0.013 | 0.013 | 1.142 | 0.987 | 0.963 - 1.011 | 0.285 | |||
| HLA antibodies | -0.063 | 0.534 | 0.014 | 0.939 | 0.329 - 2.675 | 0.906 | |||
| Blood glucose | -0.244 | 0.336 | 0.529 | 0.783 | 0.406 - 1.513 | 0.467 | |||
| Blood lipid | 0.258 | 0.258 | 1.000 | 1.294 | 0.781 - 2.145 | 0.317 | |||
| Perioperative Recipient | |||||||||
| Induction | |||||||||
| BAS | 6.439 | 0.040 | |||||||
| ATG | -1.516 | 0.797 | 3.617 | 0.220 | 0.046 - 1.047 | 0.057 | |||
| rATG | -1.946 | 0.820 | 5.635 | 0.143 | 0.029 - 0.712 | 0.018 | |||
| Maintenance regimen | 0.806 | 0.626 | 1.655 | 2.239 | 0.656 - 7.641 | 0.198 | |||
| Operation time (min) | 0.106 | 0.257 | 0.168 | 1.111 | 0.671 - 1.841 | 0.682 | |||
| AR | -1.090 | 0.592 | 3.384 | 0.336 | 0.105 - 1.074 | 0.066 | |||
| DGF | 0.320 | 0.398 | 0.647 | 1.377 | 0.632 - 3.002 | 0.421 | |||
| Hormone pulse | 0.223 | 0.370 | 0.363 | 1.250 | 0.605 - 2.584 | 0.547 | |||
| FK506 trough | 0.071 | 0.035 | 4.217 | 1.073 | 1.003 - 1.149 | 0.040 | |||
| CRP (mg/L) | 0.008 | 0.005 | 2.177 | 1.008 | 0.997 - 1.018 | 0.140 | |||
| PCT (ng/mL) | 0.015 | 0.008 | 3.639 | 1.015 | 1.000 - 1.031 | 0.056 | |||
| WBC (×109/L) | 0.105 | 0.032 | 10.516 | 1.110 | 1.042 - 1.183 | 0.001 | |||
| NEU (%) | 5.235 | 2.966 | 3.116 | 187.801 | 0.561 - 62839.036 | 0.078 | |||
| Hospital stay duration | 0.434 | 0.264 | 2.700 | 1.544 | 0.920 - 2.593 | 0.100 | |||
| Donor | |||||||||
| Infectious marker | -0.684 | 0.454 | 2.274 | 0.505 | 0.207 - 1.228 | 0.132 | |||
| Pathogen | -0.496 | 0.367 | 1.835 | 0.609 | 0.297 - 1.248 | 0.176 | |||
| Gender | -0.042 | 0.320 | 0.017 | 0.959 | 0.512 - 1.795 | 0.896 | |||
| Age (year) | 0.394 | 0.173 | 5.194 | 1.482 | 1.057 - 2.079 | 0.023 | |||
| BMI (kg/m2) | -0.043 | 0.216 | 0.040 | 0.958 | 0.628 - 1.462 | 0.842 | |||
| WBC (×109/L) | -0.041 | 0.019 | 4.472 | 0.960 | 0.925 - 0.997 | 0.034 | |||
| NEU (%) | -0.090 | 0.888 | 0.010 | 0.914 | 0.160 - 5.210 | 0.920 | |||
| LYM (%) | 1.193 | 1.259 | 0.899 | 3.297 | 0.280 - 38.856 | 0.343 | |||
| REC (×1012/L) | -0.198 | 0.122 | 2.604 | 0.821 | 0.646 - 1.043 | 0.107 | |||
| HGB (g/L) | -0.010 | 0.004 | 5.457 | 0.990 | 0.982 - 0.998 | 0.019 | |||
| PLT (×109/L) | -0.002 | 0.001 | 2.101 | 0.998 | 0.996 - 1.001 | 0.147 | |||
| CRP (mg/L) | -0.001 | 0.002 | 0.115 | 0.999 | 0.995 - 1.004 | 0.735 | |||
| PCT (ng/mL) | 0.005 | 0.005 | 0.758 | 1.005 | 0.994 - 1.015 | 0.384 | |||
| TBIL (μmol/L) | 0.021 | 0.009 | 6.146 | 1.022 | 1.004 - 1.039 | 0.013 | |||
| DBIL (μmol/L) | 0.022 | 0.011 | 4.073 | 1.022 | 1.001 - 1.043 | 0.044 | |||
| IBIL (μmol/L) | 0.058 | 0.021 | 7.757 | 1.060 | 1.017 - 1.104 | 0.005 | |||
| ALT (U/L) | 0.000 | 0.001 | 0.014 | 1.000 | 0.997 - 1.003 | 0.905 | |||
| AST (U/L) | 0.001 | 0.001 | 3.029 | 1.001 | 1.000 - 1.003 | 0.082 | |||
| BUN (mmol/L) | 0.038 | 0.025 | 2.429 | 1.039 | 0.990 - 1.019 | 0.119 | |||
| SCr (μmol/L) | 0.004 | 0.002 | 4.640 | 1.004 | 1.000 - 1.008 | 0.031 | |||
| K+ (mmol/L) | 0.033 | 0.112 | 0.086 | 1.033 | 0.830 - 1.286 | 0.770 | |||
| Na+ (mmol/L) | -0.013 | 0.013 | 1.042 | 0.987 | 0.963 - 1.012 | 0.307 | |||
| Ca2+ (mmol/L) | -0.154 | 0.563 | 0.074 | 0.858 | 0.284 - 2.587 | 0.785 | |||
| CPR | 0.250 | 0.325 | 0.592 | 1.285 | 0.679 - 2.431 | 0.442 | |||
| Blood glucose | 0.061 | 0.286 | 0.045 | 1.062 | 0.606 - 1.862 | 0.832 | |||
| Cold ischemia time | 0.051 | 0.257 | 0.040 | 1.053 | 0.636 - 1.741 | 0.842 | |||
| ICU length of stay | -0.181 | 0.257 | 0.495 | 0.835 | 0.504 - 1.381 | 0.482 | |||
| OPO intervention time | 0.469 | 0.260 | 3.256 | 1.599 | 0.960 - 2.661 | 0.071 | |||
| Variable | B | SE | OR | 95% CI | Z |
|
|---|---|---|---|---|---|---|
| Preoperative WBC of recipients (×109/L) | 0.142 | 0.057 | 1.15 | 1.03 - 1.29 | 2.506 | 0.012 |
| Induction | ||||||
| ATG (ref=BAS) | -0.379 | 0.315 | 0.68 | 0.37 - 1.27 | -1.201 | 0.230 |
| rATG (ref=BAS) | 2.275 | 0.992 | 9.73 | 1.39 - 68.02 | 2.294 | 0.022 |
| Donor TBIL (μmol/L) | 0.018 | 0.009 | 1.02 | 1.00 - 1.04 | 2.021 | 0.043 |
| FK506 trough concentration (ng/ml) | 0.080 | 0.036 | 1.08 | 1.10 - 1.16 | 2.215 | 0.027 |
| Donor age (year) | 0.479 | 0.185 | 1.61 | 1.12 - 2.32 | 2.590 | 0.010 |
| AR | -1.924 | 0.829 | 0.15 | 0.03 - 0.74 | -2.320 | 0.020 |
Peer Reviews
No public reviews on file for this paper yet. If you reviewed it on a platform where reviews are public (OpenReview, ICLR, NeurIPS, ICML), you can paste yours below so the community can read it here.
Videos
No videos yet. Explain this paper in a talk, walkthrough, or lecture? Add one.
Taxonomy
TopicsParathyroid Disorders and Treatments · Dialysis and Renal Disease Management · Magnesium in Health and Disease
Introduction
1
KT stands as the optimal therapeutic intervention for patients with ESRD, delivering superior patients’ survival and graft longevity than maintenance dialysis (1). However, even with ongoing advances in surgical techniques and immunosuppressive regimens, KTR remain susceptible to numerous postoperative complications. These risks underline the necessity for robust, continuous laboratory surveillance to enable early detection and management of adverse events (2). Among routinely monitoring biomarkers, serum amylase has historically been considered an indicator of pancreatic injury. Notably, elevated serum amylase, HA, is remarkably common, frequently emerging in the absence of clinical pancreatitis or abdominal symptoms (3). This phenomenon challenges conventional diagnostic thresholds and underscores the complexity of interpreting biochemical abnormalities in KTR.
The pathophysiology of HA after KT is multifaceted. Amylase, a hydrolase involved in carbohydrate digestion, includes pancreatic (P-type) and salivary (S-type) isoenzymes, both primarily eliminated through renal filtration (4, 5). The decline in native kidney function both pre- and post-transplantation markedly reduces amylase clearance, which may result in persistently elevated serum levels unrelated to pancreatic disease (6, 7). Recent studies further suggest that minor elimination pathways, such as hepatic and reticuloendothelial systems, influence amylase kinetics in patients with systemic comorbidities, particularly following organ transplantation.
HA is reported in 20%-61% of KTR, varying by diagnostic criteria and timing of assessment (6, 8, 9). Most cases are transient and asymptomatic, but a proportion may signal critical complications, such as AR, infection, acute pancreatitis, or impending graft dysfunction. Notably, the true prognostic significance of isolated HA in this setting remains undefined. The absence of standardized diagnostic criteria contributes to clinical uncertainty, often leading to both under-recognition of real threats and unnecessary alarm when isolated biochemical changes are found.
Despite these challenges, risk stratification for post-transplant HA remains infrequently standardized or data-driven. Due to variations in laboratory testing methods, differences in patient populations, and the impact of renal insufficiency on serum amylase levels, the definition of HA ranges from 100U/L to 132U/L across studies (10–12). Previous studies have been constrained by small sample sizes, heterogeneous definitions, and methodological limitations, which have impeded their translation into widely applicable clinical guidelines. In this context, the clinical interpretation of HA is inherently complex. Existing evidence suggests that the etiology of post-transplant HA is multifactorial, potentially involving factors such as impaired renal clearance of amylase, perioperative stress, immunosuppressive therapy, and subclinical pancreatic injury (13–15). However, the relative contributions and interactions of these factors remain poorly understood. Notably, there is a lack of large-scale, well-designed studies specifically examining the determinants of HA in this patient population.
There is a pressing need for a validated, individualized risk prediction tool that integrates diverse recipient and donor variables—including inflammatory status, immunosuppressive regimens, and donor organ quality—to guide early detection, tailored monitoring, and targeted intervention for HA in KTR.
In this context, our study developed and internally validated a novel nomogram to quantify HA risk in the early postoperative period post-KT. By applying contemporary statistical modeling to a well-characterized cohort, we aimed to deliver a practical instrument that not only advanced the precision of risk assessment but also supported individualized patient management. This model may serve as a foundation for future external validation and for the evolution of personalized perioperative strategies in KT.
Materials and methods
2
Study design
2.1
This study was conducted with a cohort of 403 KTR at the Transplant Medical Institution of the Second Affiliated Hospital of Guangxi Medical University from July 2021 to June 2022. After screening, we excluded patients based on the following criteria: preoperative HA, history of pancreatitis, living donor KT, combined organ transplant, and incomplete clinical data. As a result, 350 KTR and their corresponding 182 donors were included in the final analysis.
The 350 KTR were divided into two cohorts based on the date of admission: a training cohort (n=243; July 2021 to March 2022) and a validation cohort (n=107; April 2022 to June 2022).
Patient selection
2.2
The inclusion criteria for KTR were as follows: (1) diagnosis of chronic kidney disease stage 5 (CKD-5); (2) first-time KT; (3) age between 18 and 70 years; and (4) stable preoperative cardiopulmonary function sufficient to tolerate surgery.
The exclusion criteria for recipients were as follows: (1) recipients of multi-organ combined transplantation; (2) patients with a preoperative history of pancreatitis or HA; and (3) patients with more than 20% missing clinical data.
The inclusion criteria for donors included: (1) deceased citizen donors with verified identity; (2) organ donation conducted only after the donor’s family members or authorized representatives signed both the China Human Organ Donation Registration Form and the Informed Consent Form for Human Organ Donation; (3) donors who met established brain death criteria; and (4) donors with complete clinical data available.
The exclusion criteria for donors were: (1) living donors; (2) donors with a history of acute pancreatitis prior to donation.
Data collection
2.3
Recipient data included: gender, age, body mass index (BMI), dialysis method (hemodialysis [HD] or peritoneal dialysis [PD]), hospitalization duration, dialysis duration, history of hypertension, hyperparathyroidism (HPT), surgical history, transfusion history, smoking history, alcohol consumption history, operation time, blood type, preoperative blood routine tests, electrolytes, procalcitonin (PCT), C-reactive protein (CRP), human leukocyte antigen (HLA) antibodies, blood glucose, blood lipids, perioperative immunosuppression protocol, induction immunosuppressive medications, Whether to add hormone pulse therapy, occurrence of delayed graft function (DGF), occurrence of AR, and FK506 serum drug concentration. Among these, AR was defined as cases diagnosed by clinical symptoms, laboratory indicators, and/or pathological examination before the confirmation of HA (The diagnosis of AR was made with specific reference to the KDIGO Clinical Practice Guideline on the Care of Kidney Transplant Recipients). In this study, the serum trough concentration of FK506 specifically referred to the latest trough concentration measured during the routine postoperative monitoring period before the confirmation of HA.
Donor data included: gender, age, BMI, cause of death, Intensive Care Unit (ICU) treatment duration, Organ Procurement Organization (OPO) intervention time, cold ischemia time (CIT), history of cardio-pulmonary resuscitation (CPR) prior to procurement, infectious disease screening, etiological examination, complete blood count before procurement, CRP, PCT, TBIL, Direct Bilirubin (DBIL), Indirect Bilirubin (IBIL), Alanine Aminotransferase (ALT), Aspartate Aminotransferase (AST), blood glucose, renal function, and electrolytes.
Immunosuppressive regimen
2.4
The development of the immune induction regimen was grounded in a comprehensive preoperative evaluation of the recipient’s immunological risk. Rabbit anti-human thymocyte globulin (rATG) was administered as intraoperative induction for recipients with high-risk factors such as pre-existing Donor-Specific Antibody (DSA) and Panel Reactive Antibody (PRA) levels >50%. Basiliximab (BAS) was used as intraoperative induction for recipients with immunological low risk. Anti-Thymocyte Globulin Porcine (ATG) was intraoperatively utilized for recipients with middle risk. FK506 combined with mycophenolate and corticosteroids remains the most commonly used maintenance regimen in our institution.
Diagnosis of HA after KT
2.5
Currently, no standardized criteria exist for defining post-kidney transplantation hyperamylasemia (HA). In this study, HA was defined as serum amylase levels >110 U/L in two tests within 6–24 hours after surgery, without clinical symptoms such as abdominal pain. This time window was chosen to capture early postoperative enzyme changes while reducing transient, stress-related fluctuations within the first 6 hours. The 110 U/L threshold was based on our laboratory’s reference range and adjusted for renal impairment in transplant recipients that may affect amylase clearance. This definition balances sensitivity and specificity while accounting for methodological and physiological variability in this population (16).
Nomogram construction and validation
2.6
Dataset partitioning and data processing
2.6.1
The dataset was divided into a training cohort (July 2021 to March 2022, N = 243) and a validation cohort (April 2022 to June 2022, N = 107) based on admission dates. Baseline characteristics were analyzed for the overall population, training cohort, and validation cohort using Stata 16.0 (Stata Corp, College Station, TX, USA). Categorical variables were compared using the chi-square test. For continuous variables, normality was assessed prior to analysis. Normally distributed variables with homogeneous variances were analyzed using the independent samples t-test (mean [standard deviation]); if variances were unequal, Welch’s t-test was applied. Non-normally distributed continuous variables were analyzed using the Wilcoxon rank-sum test (median [interquartile range]). The comparability between the two cohorts was assessed to confirm model applicability. All missing data were confirmed to be missing completely at random (MCAR). Variables with more than 20% missingness (e.g., mycophenolic acid concentration, cytokine levels, G-test results) were excluded to minimize bias. For variables with less than 20% missingness, multiple imputation using chained equations (MICE) was performed to preserve multivariate distribution and inter-variable correlations. This preprocessing strategy enhanced data completeness and ensured the robustness and validity of the statistical inferences.
Variable screening and model establishment
2.6.2
Univariate logistic regression analysis was conducted using SPSS 26.0 to identify potential risk factors for post-transplant HA in the training cohort, with variables having a P-value < 0.1 considered for inclusion. Subsequently, Lasso regression was applied using R 4.2.1 to perform variable selection and dimensionality reduction. The optimal penalty parameter (λ) was determined through 10-fold cross-validation. This was followed by stepwise multivariate logistic regression to build the final predictive model, using an inclusion criterion of α = 0.05 and an exclusion criterion of α = 0.1.
Model validation
2.6.3
Internal validation was conducted using the predefined validation cohort. Model performance was comprehensively assessed in terms of discrimination, calibration, and clinical utility. Discrimination was evaluated by calculating the area under the receiver operating characteristic curve (AUC). Calibration was assessed using the Hosmer–Lemeshow goodness-of-fit test. Clinical utility was evaluated using DCA to estimate the net benefit across a range of threshold probabilities.
All statistical analyses were conducted using Stata 16.0, SPSS 26.0, R version 4.2.1, and RStudio. A two-sided P-value < 0.05 was considered statistically significant.
Results
3
Participant flow and baseline characteristics
3.1
Of 403 screened KTR, 350 met the inclusion criteria and were analyzed (Figure 1). The training cohort included 243 patients and the validation cohort 107. Baseline characteristics are shown in Table 1. Among these, 181 (51.7%) developed HA. Comparative analysis between the HA group and the normal amylase group revealed several noteworthy clinical differences. Notably, patients in the HA group had a significantly longer median hospital stay (10 days vs. 9 days, p < 0.01), indicating a more complex or prolonged postoperative recovery. Additionally, lower incidence of acute rejection (AR) was found in the HA group (2.2% vs. 7.1%, p = 0.04); FK506 trough concentrations were significantly higher in the HA group (median 7.1 ng/mL vs. 6.3 ng/mL, p < 0.01). These differences suggested that adequate FK506 levels is critical in reducing the risk of AR, also contributing to enzymatic alterations.
Study flowchart illustrating patient selection and predictive model construction for KTR.
Furthermore, the prevalence of hyperparathyroidism was significantly higher in the HA group (53.0% vs. 40.8%, p = 0.02), suggesting a potential association between HA and post-transplant metabolic disturbances. In contrast, no statistically significant differences were observed between the HA and normal amylase groups regarding the incidence of DGF. These findings suggest that HA may could reflect underlying perioperative metabolic disturbances or subclinical pancreatic inflammation.
Taken together, these results underscore the multifactorial etiology of HA, which likely involves interactions between the recipient’s inflammatory status, immunosuppressive therapy, and donor-related factors. The findings emphasize the clinical relevance of incorporating HA into perioperative risk stratification and management strategies for KTR.
Baseline characteristics of training and validation cohort
3.2
Table 2 compares baseline characteristics between normal amylase and HA groups within the training cohort (N = 243) and validation cohort (N = 107). Most demographic and clinical variables, including age, gender, BMI, blood type, dialysis duration, hypertension, surgical history, transfusion history, and donor factors, were well balanced between groups in both cohorts.
In the training cohort, the HA group showed significantly higher preoperative WBC counts (median 7.4 vs. 6.2 ×10^9^/L, P<0.01), elevated PCT levels (median 2.6 vs. 1.5 ng/mL, P<0.01), higher neutrophil (NEU) % (P = 0.04), lower HGB (P = 0.01), increased HPT (41.9% vs. 28.6%, P = 0.03), and more use of rATG induction therapy (7.7% vs. 1.6%, P = 0.02). FK506 trough concentrations were higher, though not statistically significant (P = 0.12).
In the validation cohort, only WBC count (P<0.01) and FK506 trough concentration (P = 0.01) remained significantly higher in the HA group, while other differences were not replicated. Donor characteristics were largely similar, except for higher bilirubin and creatinine levels in the training cohort’s HA group.
Overall, the two cohorts were comparable, with WBC count, FK506 concentration, and rATG use emerging as consistent differentiators, supporting their inclusion in predictive modeling.
Feature predictor selection
3.3
This study employed univariate logistic regression, LASSO regularization algorithm (based on 10-fold cross-validation) combined with stepwise regression to screen potential predictive variables associated with HA after KT. As shown in Table 3, univariate logistic regression analysis identified 6 variables with significant differences between the normal and HA group. To further optimize variable selection, the LASSO regression was used to analyze all candidate variables. By adjusting the penalty coefficient λ (with the optimal λ value determined by minimizing the mean squared error), 14 candidate predictors were ultimately retained (Figures 2A, B). These variables screened by univariate Logistic regression and LASSO regression were incorporated into the multivariate Logistic regression model. The final model was selected based on the Akaike Information Criterion (AIC) combined with forward-backward stepwise regression, which balanced model fit and complexity. Six independent predictive factors were ultimately identified, including: recipient preoperative WBC count, induction, FK506 trough concentration, AR, donor age, and donor TBIL level. The results of the multivariate Logistic regression are detailed in Table 4.
Development and validation a model for predicting risk factors of HA. Variable selection via LASSO regression with 10-fold cross-validation identifying optimal penalty parameter (λ) minimizing mean-squared error (A). Corresponding coefficients of selected predictors at optimal λ (B). A nomogram integrating independent risk factors including Preoperative WBC of recipients, induction, AR, donor TBIL, FK506, donor age, enabling individualized risk estimation (C). ROC for training and validation cohort, with AUC of 0.730 and 0.731, respectively, indicating satisfactory discrimination (D, E). Calibration plots comparing predicted and observed probabilities (F, G); Hosmer-Lemeshow test P-values >0.05 indicate adequate model fit (H, I). DCA demonstrating net benefit across a range of threshold probabilities compared to treat-all or treat-none strategies (J, K). WBC, White Blood Cell; AR, Acute Rejection; AUC, Area Under the Curve; DCA, Decision Curve Analysis; ROC, Receiver Operating characteristic Curve; TBIL, Total Bilirubin; FK506, Tacrolimus.
Construction and validation of the nomogram
3.4
The final predictors were incorporated into the risk prediction model for post-KT HA (Figure 2C). In the training cohort, ROC analysis showed an AUC of 0.730, with a Youden index of 0.683. In the validation cohort, the model achieved an AUC of 0.731, with a Youden index of 0.767 (Figures 2D, E). To further assess model performance, 1000 Bootstrap resampling validation was conducted to confirm the model’s stability (Figures 2F, G). Calibration plots demonstrated excellent agreement between predicted and observed probability in both the training and validation cohorts, with midline deviations within clinically acceptable ranges. Brier scores and the coefficient of determination (R²) were used to quantify the model’s calibration performance: the training cohort achieved a Brier score of 0.207 (P = 0.912) with R²=0.231, while the validation cohort showed a Brier score of 0.203 (P = 0.936) with R²=0.220, indicating the satisfactory calibration and discrimination (Figures 2H, I). In addition, Additionally, DCA results showed that the model provided clinical benefit across a wide range of threshold probabilities, supporting its potential application in clinical practice. For both the training and validation cohorts, the model demonstrated robust discrimination and calibration, suggesting it can reliably identify patients at risk for post-transplant HA and support individualized risk assessment (Figures 2J, K).
Discussion
4
This study developed and internally validated a multifactorial nomogram to predict the risk of HA following KT. By integrating recipient inflammatory status, immunosuppressive protocols, and donor factors, the model provided crucial knowledge in perioperative management. Practical application of this model enables early identification of high-risk individuals, facilitating targeted monitoring and intervention, which may help reduce postoperative complications and optimize graft outcomes.
Recipient preoperative WBC count was identified as a significant independent predictor of post-transplant HA, underscoring the central role of systemic inflammation in early metabolic disturbances post-KT. Elevated preoperative WBC reflected inflammation state, which was associated with adverse outcomes in KT, including graft dysfunction and increased susceptibility to complications (17–19). Previous studies have linked inflammatory markers such as CRP and NEU counts to post-transplant metabolic disturbances. (20, 21). Inflammatory response may damage pancreatic tissue through the inflammatory cascade and induction of apoptosis and necrosis, which supports the role of inflammation in pancreatic enzyme elevation (22, 23). By incorporating preoperative WBC into our model, we provided quantifiable evidence that inflammation was a key factor in HA risk, emphasizing the need for close monitoring of inflammatory status in the early post-transplant period. This finding aligned with and extended existing knowledge by directly associating WBC with HA risk (24).
Immunosuppressive regimen, particularly rATG induction and higher FK506 trough concentration, also contributed to increased HA risks. Potent immunosuppression can heighten susceptibility to metabolic complications, either by immune-mediated mechanisms or direct pancreatic toxicity. Prior literature has documented FK506-associated HA and pancreatitis in KTR (25–27). This phenomenon may be linked to FK506-induced activation of the mitochondrial-dependent apoptosis pathway, which leads to the disruption of mitochondrial membrane integrity in pancreatic exocrine cells and the abnormal accumulation of reactive oxygen species. Consequently, this process results in the upregulation of pro-apoptotic proteins and apoptotic executioner proteins, ultimately precipitating exocrine cell dysfunction and, in some cases, cell death. (28). The reduction in the incidence of acute rejection (AR) was probably associated with the elevated trough concentrations of FK506 in HA group, which, in turn, align with its well-established immunosuppressive properties. Adequate FK506 exposure effectively suppresses alloreactive immune responses, thereby attenuating the recipient’s immune-mediated AR-related injury to the transplanted graft. Unlike earlier models that focused primarily on recipient clinical variables, our study uniquely integrated detailed immunosuppressive parameters, enhancing the clinical relevance and applicability of the predictive model. These results underscored the importance of optimizing immunosuppressive dosing to balance rejection prevention with metabolic safety.
Beyond recipient and treatment-related factors, donor characteristics further contributed to HA risk. Donor age and TBIL emerged as significant predictors in our model, highlighting the influence of donor organ quality on recipient outcomes. Advanced donor age has been consistently associated with reduced graft function and a higher risk of complications (29, 30). Elevated donor TBIL, reflecting hepatic and systemic health, has been linked to oxidative stress and immune modulation, which might affect graft viability and recipient metabolism (31–33). Our findings corroborated these associations and extended prior research by integrating donor biochemical markers into HA risk assessment. This comprehensive approach improved prediction accuracy and supported personalized transplant management strategies. Together, these findings demonstrated the multifactorial nature of post-transplant HA, involving recipient inflammation, immunosuppressive therapy, and donor factors.
Subsequently, our findings suggested that HA may function more as a marker of perioperative metabolic imbalance. Nevertheless, the clinical significance of isolated HA in the absence of other complications remains uncertain, largely due to the lack of standardized diagnostic criteria and the multifactorial nature of its underlying mechanisms. Future research, particularly large-scale, multicenter studies with long-term follow-up, is required to determine the extent to which HA influences long-term outcomes, including graft survival and overall patient survival.
This study has several limitations. First, the single-center retrospective design may introduce selection bias and limit the generalizability. Future multicenter, prospective studies are necessary to validate the model in diverse populations. Second, some important factors, such as nutritional status, genetic predispositions, and dynamic changes in clinical parameters, were unavailable and could improve prediction if included. Third, although internal validation demonstrated robust model performance, external validation using independent datasets remains essential before clinical use. Addressing these issues is key to applying the model in practice.
Despite its limitations, this study introduces an innovative and comprehensive predictive model for assessing the risk of HA following KTR. By integrating recipient inflammatory biomarkers, immunosuppressive therapy details, and donor biochemical indicators, we have developed a risk stratification model that facilitates timely and personalized patient assessments. This model enables the early identification of high-risk individuals, thereby providing robust support for tailored patient management. Clinicians can optimize treatment strategies through enhanced monitoring, adjustments to immunosuppressive regimens, ensuring adequate hydration, and closely monitoring amylase levels, all of which contribute to effective complication prevention. While further multicenter prospective validation is necessary, the development of this tool represents a significant advancement in precision perioperative care for KTR. Future research should focus on external validation and the incorporation of dynamic biomarker monitoring alongside multi-omics data to further refine the risk prediction model.
Conclusion
5
This study provides a novel and comprehensive prediction model for post-transplant HA in KTR. This prediction model could help identify high-risk populations for post-transplant HA and provides support for personalized patient management. Our study provides a foundation for improving transplant outcomes through individualized care.
The reference list from the paper itself. Each links out to its DOI / PubMed record.
- 1Wolfe RA Ashby VB Milford EL Ojo AO Ettenger RE Agodoa LY. Comparison of mortality in all patients on dialysis, patients on dialysis awaiting transplantation, and recipients of a first cadaveric transplant. N Engl J Med. (1999) 341:1725–30. doi: 10.1056/nejm 199912023412303, PMID: 10580071 · doi ↗ · pubmed ↗
- 2Hariharan S Johnson CP Bresnahan BA Taranto SE Mc Intosh MJ Stablein D. Improved graft survival after renal transplantation in the United States, 1988 to 1996. N Engl J Med. (2000) 342:605–12. doi: 10.1056/nejm 200003023420901, PMID: 10699159 · doi ↗ · pubmed ↗
- 3Dardamanis MA Elisaf MS Vasakos SA Tsianos EV Siamopoulos KC. Alpha-amylase and isoamylase levels in renal transplant recipients compared to uremic patients. Ren Fail. (1995) 17:715–9. doi: 10.3109/08860229509037639, PMID: 8771244 · doi ↗ · pubmed ↗
- 4Akinfemiwa O Zubair M Muniraj T. Amylase. In: Statpearls. Stat Pearls Publishing Copyright © 2025, Stat Pearls Publishing LLC, Treasure Island (FL (2025)., PMID: 32491670 · pubmed ↗
- 5Junge WMályusz M Ehrens HJ. The role of the kidney in the elimination of pancreatic lipase and amylase from blood. J Clin Chem Clin Biochem. (1985) 23:387–92. doi: 10.1515/cclm.1985.23.7.387, PMID: 2413160 · doi ↗ · pubmed ↗
- 6Yilmaz UE Yilmaz N Titiz I Basaranoglu M Tarcin O. The utility of amylase and lipase as reliable predictive markers for functioning renal graft. Ann Transplant. (2012) 17:77–84. doi: 10.12659/aot.883461, PMID: 23018259 · doi ↗ · pubmed ↗
- 7Collen MJ Ansher AF Chapman AB Mackow RC Lewis JH. Serum amylase in patients with renal insufficiency and renal failure. Am J Gastroenterol. (1990) 85:1377–80., PMID: 1699413 · pubmed ↗
- 8Penn I Durst AL Ma Chado M Halgrimson CG Booth AS Jr.Putman CW. Acute pancreatitis and hyperamylasemia in renal homograft recipients. Arch Surg. (1972) 105:167–72. doi: 10.1001/archsurg.1972.04180080021004, PMID: 4557978 PMC 2964057 · doi ↗ · pubmed ↗