CD5 Expression in CTCL and Its Implications for Anti-CD5 CAR T-Cell Therapy
Leena Wardeh, Madeline Williams, Courtney Prestwood, Zachary Wolner, Neda Nikbakht

TL;DR
This study examines CD5 expression in CTCL and finds it varies by disease stage, suggesting it could be a potential therapy target for early-stage CTCL.
Contribution
The study provides new insights into CD5 expression dynamics in CTCL, particularly its potential as a target for CAR T-cell therapy.
Findings
CD5 expression is significantly higher in malignant MF CD4 T cells compared to healthy controls.
Tumor stage MF lesions show higher CD5 loss in malignant CD4+ T cells compared to patch/plaque stage lesions.
CD5 may be a viable therapeutic target for early-stage CTCL but less so for advanced stages.
Abstract
Cutaneous T-Cell Lymphomas (CTCL) are a heterogenous group of T-cell malignancies in the skin and have poor treatment outcomes in advanced stages. CD5, a surface glycoprotein expressed on most mature T cells, has emerged as a promising target for chimeric antigen receptor (CAR) T-cell therapy in systemic T-cell lymphomas. However, its expression profile in CTCL and relevance for targeted therapy remain unclear. Notably, in CTCL, the cell surface expression of receptors, such as CD7 and CD26, tends to become downregulated on the surfaces of malignant T cells In this study, we analyzed single-cell RNA sequencing (scRNA-seq) data from patients at two institutions with mycosis fungoides (MF), the most common subtype of CTCL with a predominantly CD4 phenotype. We utilized 5 patch/plaque MF skin biopsies (majority from early-stage patients), 8 MF tumor biopsies (all from advanced-stage…
Genes, proteins, chemicals, diseases, species, mutations and cell lines named across the full text — each resolved to its canonical identifier and authoritative record.
Click any figure to enlarge with its caption.
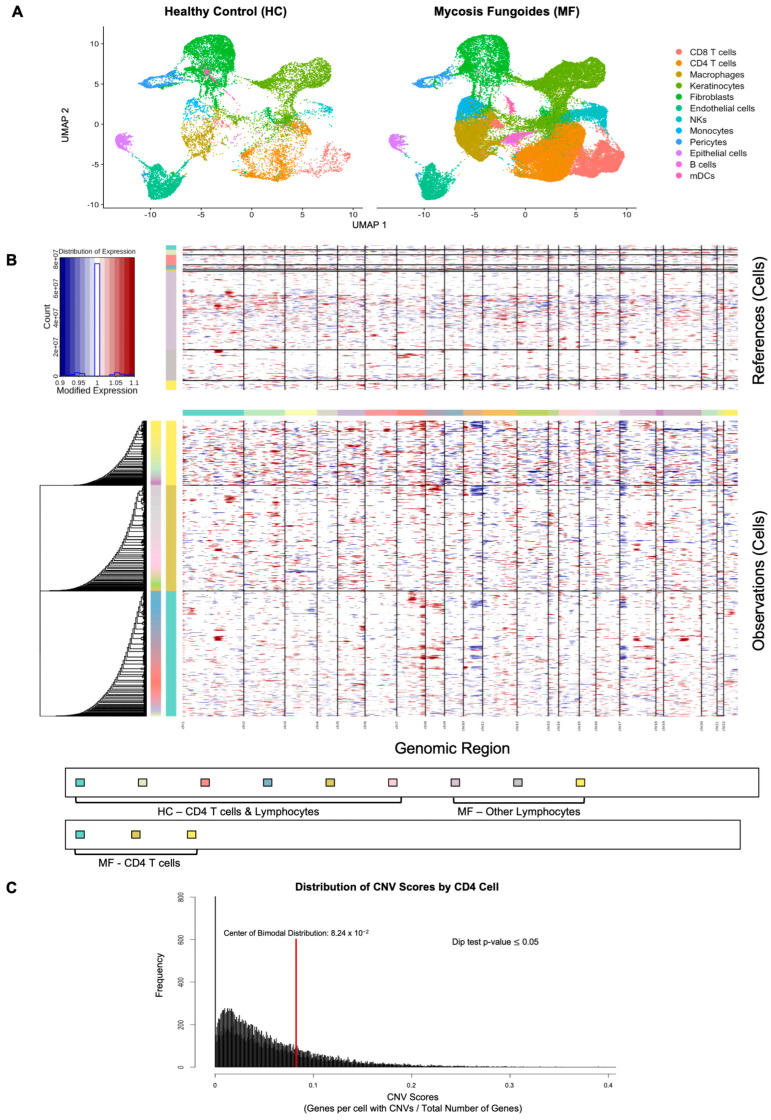 Figure 1
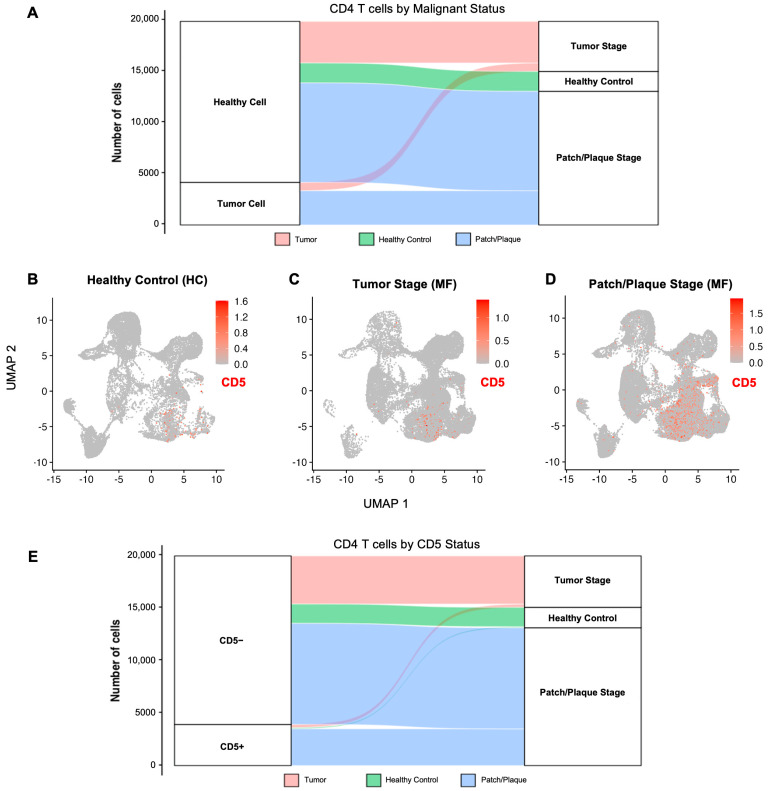 Figure 2
Peer Reviews
No public reviews on file for this paper yet. If you reviewed it on a platform where reviews are public (OpenReview, ICLR, NeurIPS, ICML), you can paste yours below so the community can read it here.
Videos
No videos yet. Explain this paper in a talk, walkthrough, or lecture? Add one.
Taxonomy
TopicsCAR-T cell therapy research · Cutaneous lymphoproliferative disorders research · Lymphoma Diagnosis and Treatment
1. Introduction
Cutaneous T-cell lymphomas (CTCL) are a group of rare non-Hodgkin lymphomas characterized by the proliferation of malignant T-cells in the skin. The most common subtype, mycosis fungoides (MF), primarily involves the skin but may progress to lymph nodes, peripheral blood, and visceral organs [1,2]. Although early-stage disease often presents with an indolent course, advanced-stage CTCL is associated with limited treatment options and poor overall survival [3].
CD5 is a transmembrane glycoprotein expressed on thymocytes, mature T-cells, and a subset of B-cells. It plays a critical role in regulating T-cell receptor signaling, modulating immune activation, and maintaining peripheral tolerance [4,5]. In systemic mature T-cell lymphomas, CD5 expression has been associated with higher clinical stage, bone marrow involvement, and poorer outcomes [6]. However, CTCL was excluded from these analyses, and the clinical relevance of CD5 expression in CTCL remains poorly described. Notably, CTCL frequently exhibits downregulation or complete loss of surface antigens including CD26 and CD7, particularly in advanced disease stages [7,8]. Cell surface antigen modification is a recognized mechanism of immune evasion and therapeutic resistance, and it raises concerns that CD5 downregulation may impact the success of CD5-targeted therapies in CTCL.
The development of CD5-directed chimeric antigen receptor (CAR) T-cell therapy for relapsed and refractory T-cell lymphomas has generated substantial interest. Early-phase studies have shown clinical response rates of approximately 60% in systemic T-cell lymphomas, with manageable toxicity profiles [8,9,10,11,12]. However, the lack of data on CD5 expression patterns in CTCL, combined with the known prevalence of antigen loss in this disease, presents an opportunity to evaluate CD5 expression and its relationship to the outcome of CD5-directed CAR T-cell therapy in this patient population.
To better understand the role of CD5 in CTCL and evaluate its potential as a therapeutic agent, we assessed CD5 gene expression on malignant CD4 T cells in MF patients utilizing single-cell RNA sequencing (scRNA-seq) strategies. Our study aims to inform the use of CD5-targeted immunotherapies in CTCL and guide patient selection for future clinical trials.
2. Results
2.1. Written Results
2.1.1. CD4 T Cells Are Prominent in MF Skin Lesions
We compared scRNA-seq data obtained from the skin of MF patients with either early-stage patch/plaque or advanced-stage tumor lesions to healthy control skin. To identify the prominent cell populations in the MF skin lesions, we analyzed publicly available scRNA-seq data from the University of Vienna and University of Pittsburgh [13,14,15,16,17]. We compared scRNA-seq data collected from skin of healthy individuals (n = 4) to that of CTCL skin lesions (n = 13; patch/plaque lesions = 5, tumors = 8) (Table 1). 81,124 cells from these 17 samples passed quality control and were resolved into various cell clusters based on canonical cell markers and differential expression testing (Table 2). To identify CD4 T-cells, including the presumed malignant CD4 T cells in the MF samples, the differential expression of CD3D, IL7R, and CCR7 among other canonical CD4 T cell gene signatures was used (Table 2). The uniform manifold approximation and projection (UMAP) resolved 12 cell clusters in healthy control and MF skin (Figure 1A). As expected, compared to healthy control skin, the CD4 T cell population was the prominent cell population in MF skin lesions (Figure 1A).
2.1.2. Malignant CD4 Cell Identification by Copy Number Variants
We identified malignant cells within MF samples using chromosomal copy number variant (CNV) burden. These CNV profiles for MF cells and HC cells (used as reference cells in analysis) were visualized in a heatmap (Figure 1B). After scoring each cell for their CNV burden (i.e., number of genes with CNVs per cell), we found a significant bimodal distribution (Figure 1C). Malignant cells were then defined as those with CNV signal above 0.082. Using this method, a total of 4168 malignant CD4 cells were identified in MF samples (Figure 2A).
2.1.3. CD5 Expression Across All Cell Clusters
Next, we assessed CD5 expression in all cell clusters from healthy control, tumor-stage, and patch/plaque stage MF lesions. Amongst all cell clusters identified across all groups, CD4 T cells had the highest CD5 expression, with CD8 T cells and natural killer cells showing less, but still observable expression of CD5 (Figure 2B–D). Minimal CD5 expression was observed in keratinocytes, fibroblasts, myeloid cells, or other non-T-cell compartments, supporting the specificity of CD5 expression to the lymphocytic cells in CTCL, especially the CD4 T cells.
2.1.4. CD5 Expression in CD4 T Cells from MF Patients Versus Healthy Controls
Of the 19,909 CD4 T cells identified across all groups and the 4168 that were malignant, CD5 expression was significantly increased in malignant CD4 T cells from all MF patients (log_2_ fold change of 1.85, adjusted p-value < 0.0001), indicating elevated CD5 expression in malignant MF CD4 T-cells relative to healthy skin (Figure 2E). However, when MF cells were divided by lesion type and compared to healthy control CD4 T cells, only malignant CD4 T cells from patch/plaque lesions showed significantly different CD5 expression compared to healthy CD4 T cells (log_2_ fold change of 2.10, adjusted p-value < 0.0001). Malignant CD4 cells from tumor-stage lesions did not have significantly different CD5 expression compared to healthy controls (log_2_ fold change of −0.24, adjusted p-value > 0.05).
2.1.5. CD5 Expression in Malignant CD4 T Cells from Patch/Plaque Versus Tumor-Stage MF Lesions
CD5 expression was significantly reduced in malignant CD4 T cells from tumor-stage MF lesions compared to patch/plaque MF lesions (Figure 2B–E). Malignant CD4 T-cells from tumor lesions exhibited a log_2_ fold change of −2.34 (adjusted p-value < 0.0001). Notably, approximately 94.3% of malignant CD4 T-cells in tumor-stage lesions did not express CD5, compared to only 76.6% of malignant CD4 T cells from patch/plaque MF lesions. This suggests the emergence of CD5-negative malignant subpopulations in MF tumor lesions.
2.1.6. CD5 Expression in Other Lymphocytes in MF
Of the 8289 CD8 T cells identified, CD5 expression was not significantly different in CD8 T cells from MF patients compared to healthy controls (adjusted p-value > 0.05). There were also 3224 natural killer cells identified, and CD5 expression was not significantly different between natural killer cells from MF patients compared to healthy controls (adjusted p-value > 0.05).
3. Discussion
This study demonstrates that CD5 expression in CTCL is largely dependent on lesion type, with malignant CD4 T cells from patch/plaque MF lesions showing elevated CD5 transcript levels compared to malignant CD4 T cells from MF tumor lesions and healthy control CD4 T cells. These findings provide a high-resolution view of CD5 heterogeneity and support the idea that its therapeutic potential may be influenced by MF lesion type.
The observed decrease in CD5 expression in tumor-stage MF lesions aligns with earlier findings that progressive surface antigen loss is a mechanism of immune evasion and treatment resistance in CTCL [7]. Similar patterns have been reported with CD7 and CD26 in CTCL, where antigen loss limits the durability of targeted therapies [8]. Our findings extend this paradigm to CD5 and support the notion that CD5 downregulation may be another form of immune evasion in CTCL.
CD5-directed CAR T-cell therapy has shown promising antitumor activity in systemic T-cell lymphomas, with overall response rates approaching 60 percent and manageable toxicity [8,9,10,11,12]. Recent studies in systemic mature T-cell lymphomas, such as those by Elghawy et al. [6], demonstrated that CD5 expression is prevalent in approximately 63 percent of cases and is associated with worse survival outcomes. However, their analysis excluded CTCL, leaving uncertainty around the role of CD5 in this distinct subtype. Our data begins to fill this gap, showing that CD5 is indeed highly expressed in malignant CTCL CD4 T cells, particularly in patch/plaque lesions, but that expression is heterogeneous and can be lost in more robust MF tumors.
In the cells analyzed, we observed that CD5 expression was primarily restricted to lymphocytes, including malignant CD4 T cells which had the highest expression, and was not detected in other populations such as keratinocytes, fibroblasts, or myeloid cells. It is worth noting that this study is limited to surveying CD5 expression in the skin, not the blood of CTCL patients. It remains to be seen if similar downregulation of CD5 occurs in the blood compartment of patients with leukemic MF and advanced CTCL.
The limitations of this study include its use of public data, the small sample size, and the inability to assess other tissues (blood and lymph nodes). The use of a small sample size in one tissue compartment limits the broader applicability of our conclusions but indicates a need for future research addressing CD5 expression beyond the skin in MF patients. Additionally, while we used CNV burden to distinguish malignant CD4 T cells in MF samples, T-cell clonality was not utilized to confirm the identity of these malignant clones. Future directions include validating these transcriptomic findings at the protein level through multiplex IHC and spatial transcriptomics, as well as conducting longitudinal studies to track CD5 expression changes over the course of disease progression.
In summary, this study identifies a dynamic, lesion-specific pattern of CD5 expression in CTCL and supports that CD5 may be downregulated in skin lesions of advanced stage MF patients. These findings underscore the importance of biomarker-driven patient selection for CD5 CAR T-cell therapy and the need for therapeutic strategies that account for antigen heterogeneity.
4. Materials and Methods
4.1. Sample Selection and Data Acquisition
Single-cell RNA sequencing (scRNA-seq) data from patients with Mycosis Fungoides (MF) and healthy control skin were obtained from publicly available Gene Expression Omnibus (GEO) repositories. Datasets from the University of Vienna (cases 1–12) and University of Pittsburgh (cases 13–17) included 5 classic patch/plaque-stage MF samples, 8 tumor-stage MF samples, and 8 healthy control samples (Table 1) [13,14,15,16,17]. GEO accession numbers included GSE128531, GSM5280111, GSM5047045, GSM5261812, GSM5534588, GSM5534589, and GSM8255139–GSM8255145. Sample metadata and clinical annotations were reviewed to ensure inclusion of representative patch/plaque and tumor lesions.
4.2. Computational Environment
All analyses were conducted using R (version 4.4.1, R Foundation for Statistical Computing, Vienna, Austria) and RStudio (version 2024.9.0.375, Posit Software, PBC, Boston, MA, USA). The Seurat package version 5.1 was used for preprocessing, normalization, integration, clustering, and visualization. Additional packages included SCTransform (v0.4.1) for normalization and variance stabilization [18,19,20].
4.3. Preprocessing and Quality Control
Cells were retained if they expressed between 200 and 6000 genes and had fewer than 5% mitochondrial transcripts, minimizing inclusion of dead or low-quality cells. In total, 81,124 high-quality single cells were retained for analysis (Table 2).
4.4. Normalization and Feature Selection
Data were normalized using SCTransform (v2), with the number of variable features set to 2000. This approach stabilizes technical variance while preserving the biological signal.
4.5. Data Integration and Clustering
Samples were integrated using Seurat’s canonical correlation analysis (CCA)–based anchor integration to align datasets from different conditions. Dimensionality reduction was performed using principal component analysis (PCA) followed by Uniform Manifold Approximation and Projection (UMAP) for visualization. Using the ElbowPlot function in Seurat, a total of 12 distinct clusters were identified.
4.6. Cell Type Annotation
Clusters were annotated using canonical gene markers (Table 2). CD4 T cells were identified using CD3D, IL7R, and CCR7 expression. Other cell types such as keratinocytes (KRT1, KRT5, KRT14), fibroblasts (COL1A1), myeloid cells (LYZ, CD14), and B cells (MS4A1) were annotated based on established lineage markers. Cell population counts by cluster are included in Table 2.
4.7. Estimating and Inferring Malignant CD4 T Cells
The CNV level of each cell was obtained using InferCNV in R (v1.20.0). Healthy control lymphocytes were used as reference cells (B cells, NKs, CD8 T cells, and CD4 T cells) in addition to B cells, NKs, and CD8 T cells from MF patients. The R code is available at https://github.com/broadinstitute/inferCNV (accessed 13 October 2025) and was used with default settings, except for a cutoff of 0.1. Cells were sorted based on the number of genes per cell with CNVs and stratified based on the resulting bimodal distribution. Malignant cells were defined as having CNVs in greater than 8.24% of genes.
4.8. Differential Gene Expression Analysis
Differential expression of CD5 (ENSG00000110448) was evaluated using the Wilcoxon Rank-Sum test with Bonferroni correction for multiple hypothesis testing. An expression cutoff >0 UMI was used to classify cells as CD5 positive. Comparisons were performed between MF and healthy control CD4 T cells, and between patch/plaque-stage and tumor-stage MF lesions. Genes with adjusted p-values < 0.05 were considered statistically significant.
4.9. Visualization
UMAP projections and alluvial plots were used to visualize CD5 expression across disease states. All plots were generated using Seurat.
The reference list from the paper itself. Each links out to its DOI / PubMed record.
- 1Willemze R. Cerroni L. Kempf W. Berti E. Facchetti F. Swerdlow S.H. Jaffe E.S. The 2018 update of the WHO-EORTC classification for primary cutaneous lymphomas Blood 201913317031714 Erratum in Blood 2019, 134, 111210.1182/blood-2018-11-88126830635287 PMC 6473500 · doi ↗ · pubmed ↗
- 2Pulitzer M. Cutaneous T-cell lymphoma Clin. Lab. Med.20173752754610.1016/j.cll.2017.06.00628802499 PMC 5710803 · doi ↗ · pubmed ↗
- 3Jawed S.I. Myskowski P.L. Horwitz S. Moskowitz A. Querfeld C. Primary cutaneous T-cell lymphoma (mycosis fungoides and Sézary syndrome): Part I. Diagnosis: Clinical and histopathologic features and new molecular and biologic markers J. Am. Acad. Dermatol.201470205.e 1205.e 16quiz 221–22210.1016/j.jaad.2013.07.04924438969 · doi ↗ · pubmed ↗
- 4Tabbekh M. Mokrani-Hammani B. Bismuth G. Mami-Chouaib F. T-cell modulatory properties of CD 5 and its role in antitumor immune responses Oncoimmunology 20132 e 2284110.4161/onci.2284123483035 PMC 3583937 · doi ↗ · pubmed ↗
- 5Soldevila G. Raman C. Lozano F. The immunomodulatory role of CD 5 on lymphocyte receptor in health and disease Curr. Opin. Immunol.20112331031810.1016/j.coi.2011.03.00321482089 PMC 3109098 · doi ↗ · pubmed ↗
- 6Elghawy O. Cao M. Xu J. Landsburg D.J. Svoboda J. Nasta S.D. Chong E.A. Schuster S.J. Thomas C.J. Carter J.S. Prevalence and prognostication of CD 5+ mature T-cell lymphomas Cancers 202416343010.3390/cancers 1619343039410047 PMC 11476060 · doi ↗ · pubmed ↗
- 7Beygi S. Duran G.E. Fernandez-Pol S. Rook A.H. Kim Y.H. Khodadoust M.S. Resistance to mogamulizumab is associated with loss of CCR 4 in cutaneous T-cell lymphoma Blood 20221393732373610.1182/blood.202101446835436328 PMC 9247360 · doi ↗ · pubmed ↗
- 8To V. Evtimov V.J. Jenkin G. Pupovac A. Trounson A.O. Boyd R.L. CAR-T cell development for cutaneous T cell lymphoma: Current limitations and potential treatment strategies Front. Immunol.20221396839510.3389/fimmu.2022.96839536059451 PMC 9433932 · doi ↗ · pubmed ↗