Plasmodium berghei rhoptry neck protein 6 maintains parasite infectivity and virulence
Veeda Narahari, Smita Patri, Minal Dilip Satpute, Geeta Kashyap Vemuganti, Dilip Kumar Mishra, Surendra Kumar Kolli, Kota Arun Kumar

TL;DR
This study shows that a protein called RON6 in Plasmodium berghei is crucial for parasite infectivity and virulence, and its absence leads to prolonged host survival and immune system changes.
Contribution
The study identifies PbRON6 as essential for parasite invasion and virulence in a rodent malaria model, offering a new target for malaria prevention.
Findings
RON6-depleted parasites fail to maintain infectivity and virulence, leading to prolonged mouse survival.
RON6 is localized to the sporozoite membrane and is required for invasion of hepatocytes and merozoites.
RON6 mutants induce hyper-reactive malarial splenomegaly with reduced B and T lymphocytes.
Abstract
Apicomplexan parasites possess unique secretory organelles called rhoptries, which are reservoirs for rhoptry neck proteins (RONs) and rhoptry bulb proteins (ROPs) that aid in host cell attachment, invasion, and intracellular proliferation. In Plasmodium falciparum, the RON6 (PfRON6) locus is indispensable, limiting its functional investigation. Using a rodent malaria model, we show the role of P. berghei RON6 (PbRON6), a putative ortholog of PfRON6, in the invasion of RBC, hepatocytes, and during liver stage development. PbRON6 localizes to the sporozoite membrane and has an extracellular C-terminal domain. RON6-depleted parasites fail to maintain infectivity and virulence, leading to prolonged survival of mice. The mutants induce chronic malaria and hyper-reactive malarial splenomegaly, characterized by decreased B and T lymphocytes concurring with loss of lymphoid follicles. Our…
Genes, proteins, chemicals, diseases, species, mutations and cell lines named across the full text — each resolved to its canonical identifier and authoritative record.
Click any figure to enlarge with its caption.
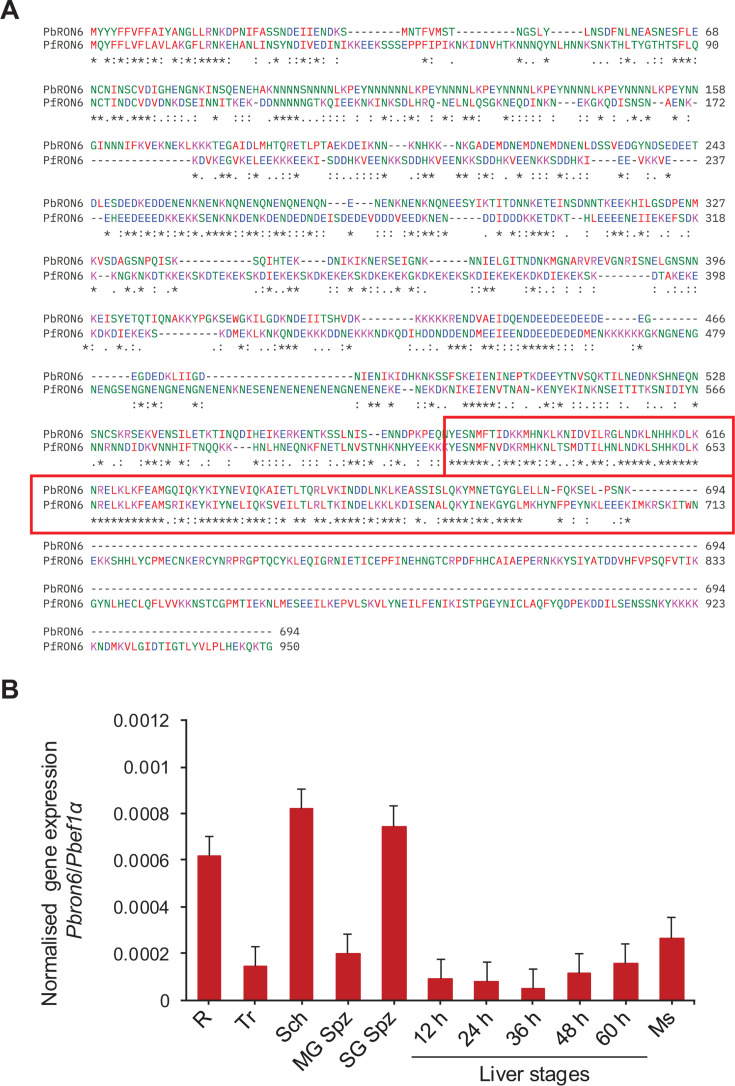 Fig 1
Fig 1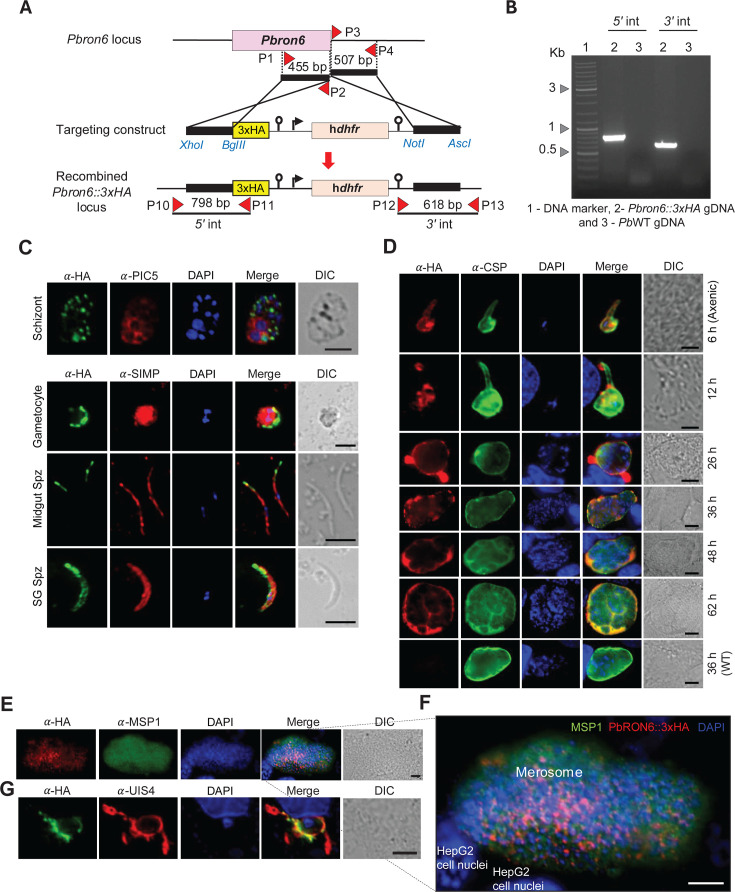 Fig 2
Fig 2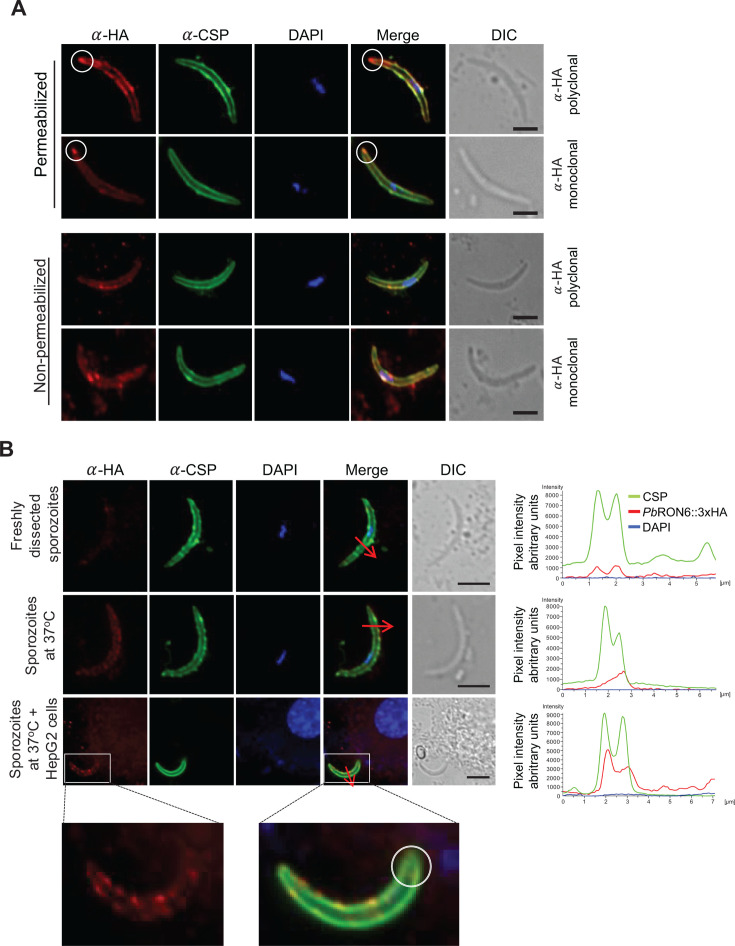 Fig 3
Fig 3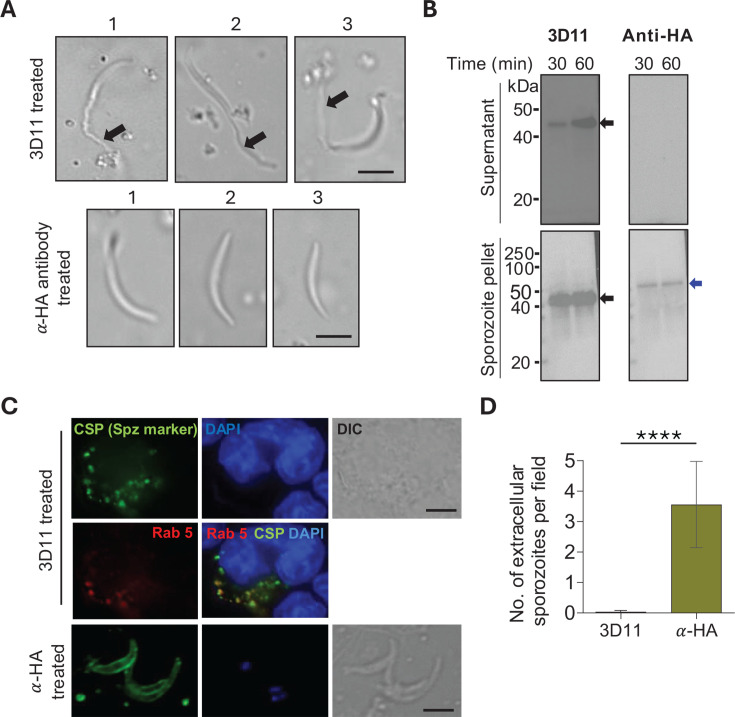 Fig 4
Fig 4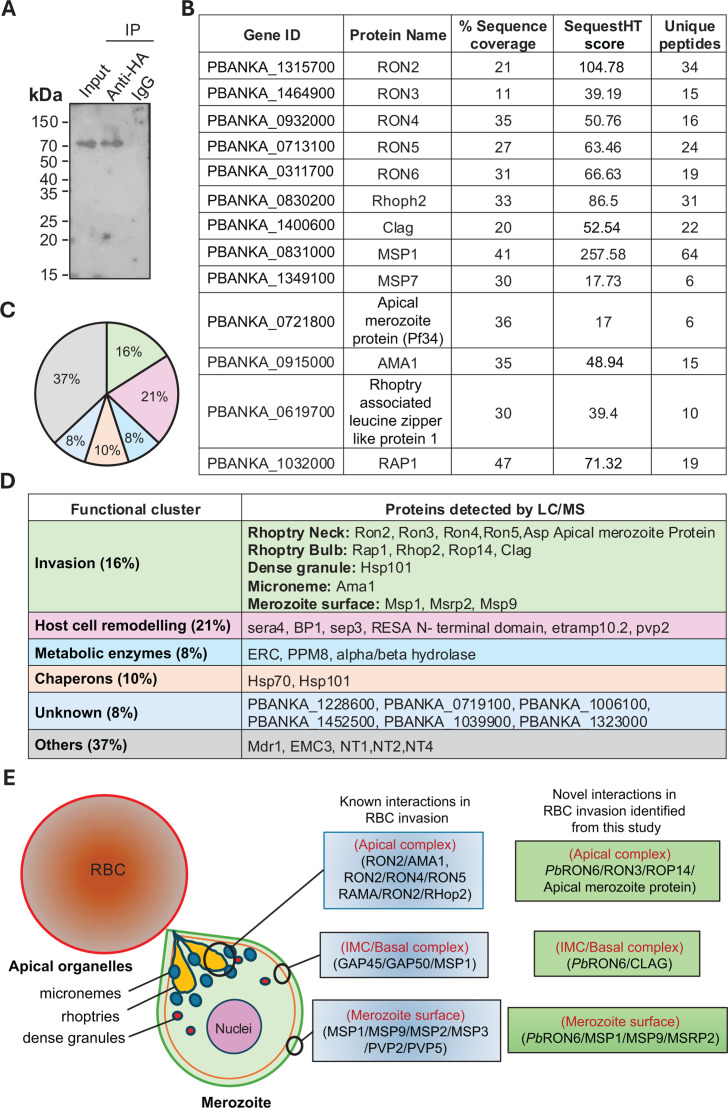 Fig 5
Fig 5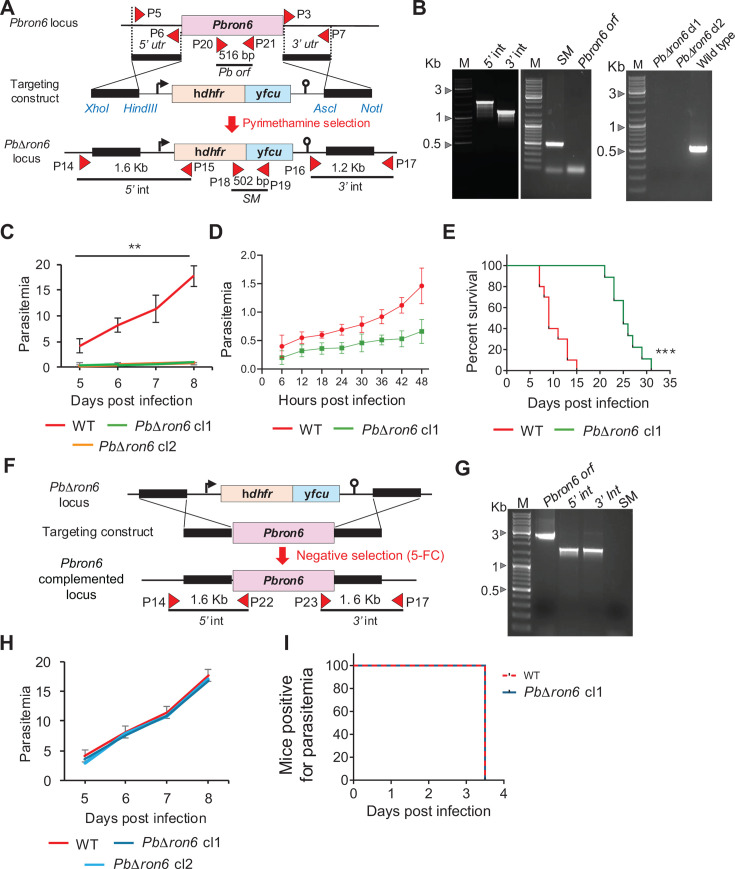 Fig 6
Fig 6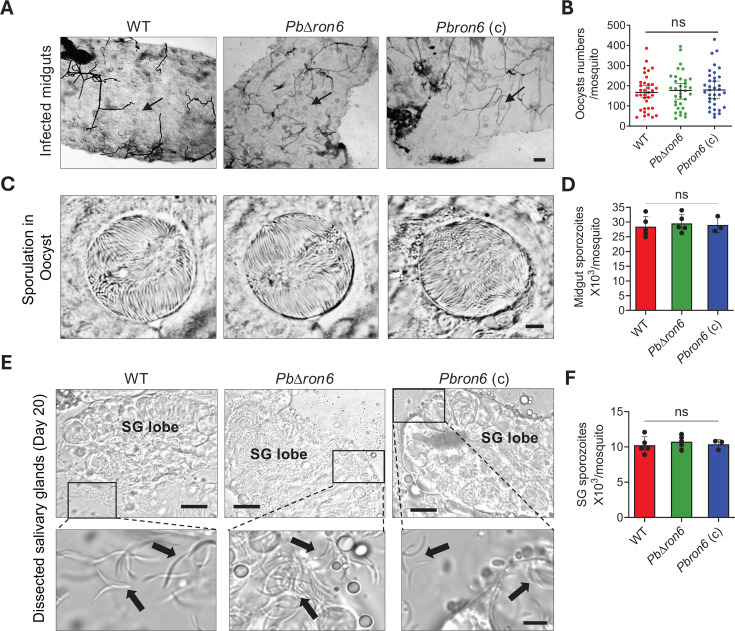 Fig 7
Fig 7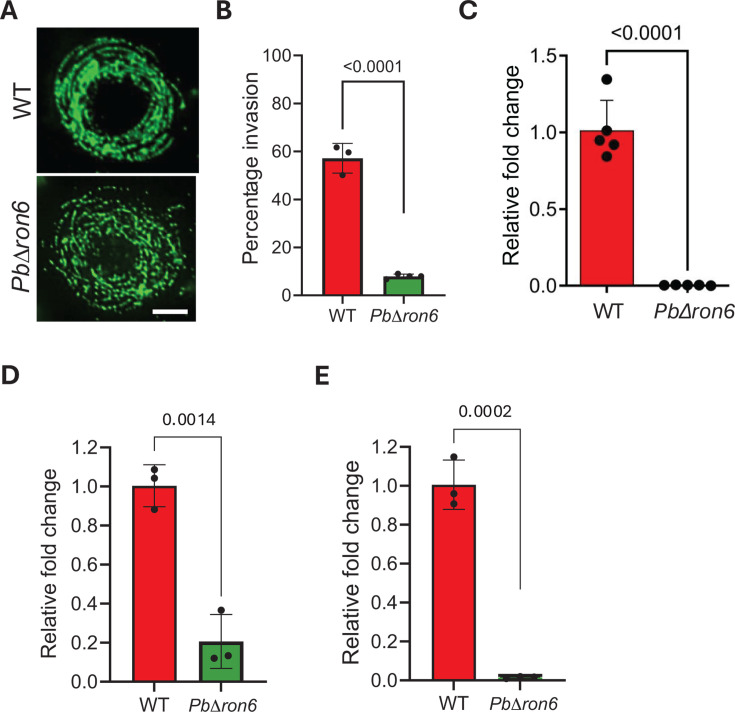 Fig 8
Fig 8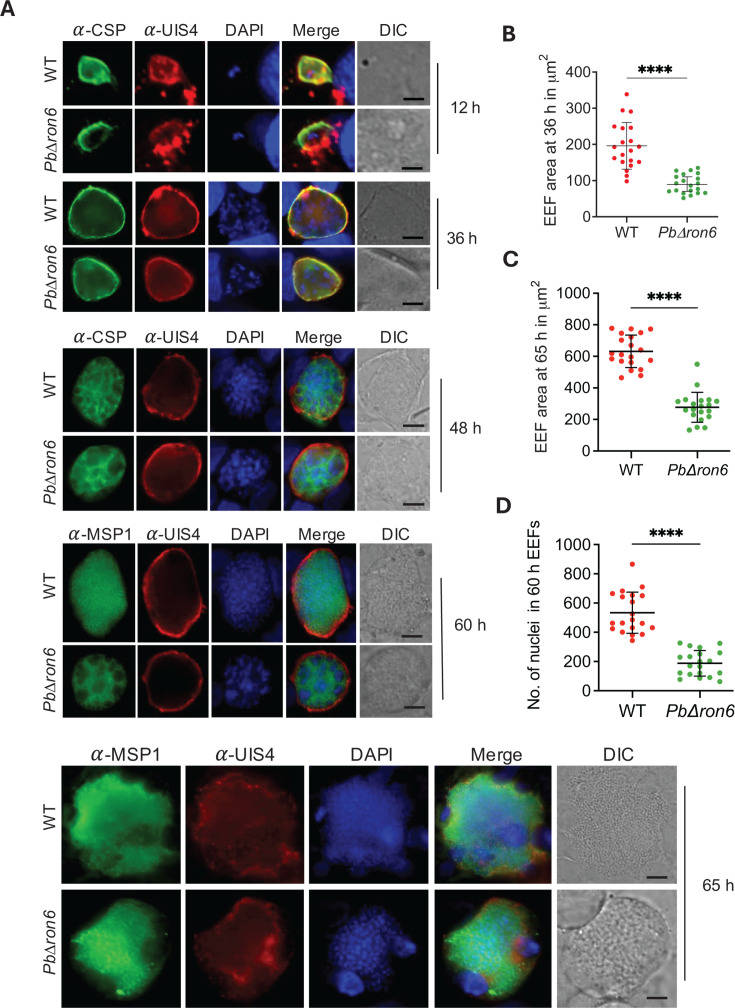 Fig 9
Fig 9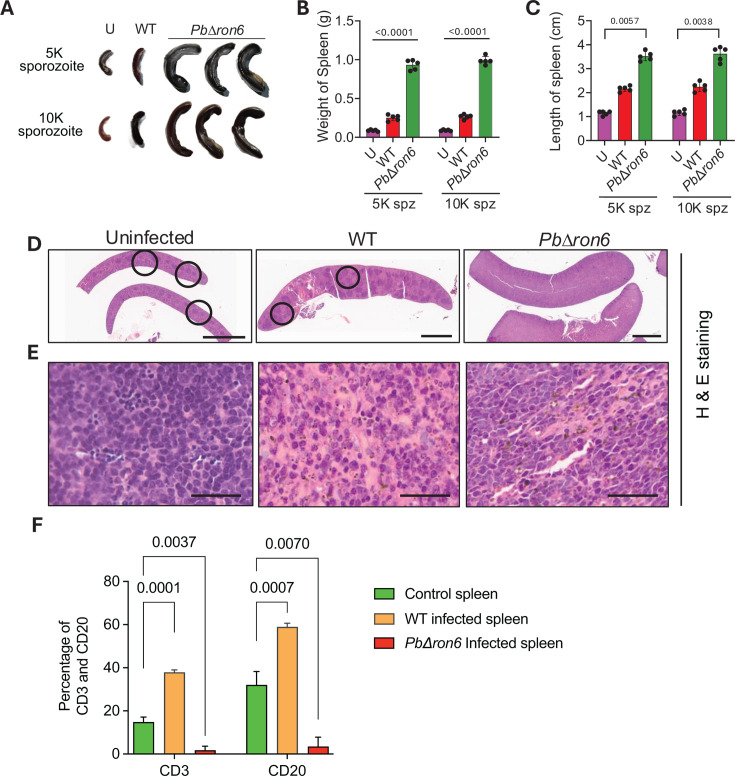 Fig 10
| Experiment # | Parasite strain | No. of animals | Sporozoite dose | Positive for blood stage infection | Pre-patency period |
|---|---|---|---|---|---|
| Expt 1 | WT | 6 | 5 × 10³ | 6 | 3.5 |
|
| 6 | 5 × 10³ | 6 | 8 | |
| Expt 2 | WT | 7 | 5 × 10³ | 7 | 3.5 |
|
| 7 | 5 × 10³ | 7 | 8 | |
| Expt 3 | WT | 3 | 1 × 10⁴ | 3 | 3.5 |
|
| 3 | 1 × 10⁴ | 3 | 7.5 |
- —Department of Science and Technology, Ministry of Science and Technology, India (DST)
Peer Reviews
No public reviews on file for this paper yet. If you reviewed it on a platform where reviews are public (OpenReview, ICLR, NeurIPS, ICML), you can paste yours below so the community can read it here.
Videos
No videos yet. Explain this paper in a talk, walkthrough, or lecture? Add one.
Taxonomy
TopicsMalaria Research and Control · Mosquito-borne diseases and control · Parasites and Host Interactions
INTRODUCTION
Malaria is caused by a unicellular apicomplexan parasite Plasmodium that is digenetic in nature, requiring two hosts to complete its life cycle. The disease is highly prevalent in tropical and subtropical areas of the world, including parts of South America, Asia, and Africa. Malaria kills nearly half a million people each year, with the majority of cases occurring in Sub-Saharan Africa. According to the WHO report of 2023, in 2022 alone, nearly 249 million people got infected with malaria, and approximately 0.6 million died due to the disease (1).
The malaria infection in the vertebrate host begins with the inoculation of sporozoites by the bite of a female Anopheles mosquito (2). The sporozoites quickly travel to the liver via circulation, invade hepatocytes, and develop into exoerythrocytic forms (EEFs) (3). Within the EEF, thousands of first-generation merozoites are formed as a result of the asexual schizogony (4). At the end of the EEF development, the hepatic merozoites are packaged into merosomes, specialized sac-like structures derived from hepatocyte plasma membrane and parasite proteins (5). These merosomes, upon rupture, initiate the erythrocytic cycle. Following repeated asexual cycles, some of the erythrocytic stages transform into sexually dimorphic forms called gametocytes that are infective to female Anopheles mosquitoes. Sexual reproduction occurs in the mosquito gut and results in the formation of a zygote, which transforms into a motile ookinete. Ookinetes breach the midgut epithelium and develop into an oocyst on the hemocoel side of the epithelium. Sporulation within the oocyst produces thousands of sporozoites (6), which are released into the hemocoel upon rupture. The sporozoites migrate and colonize the salivary glands (SGs) and wait for the next round of transmission to a new vertebrate host during blood-feeding.
Host cell invasion at multiple life cycle stages is key for malaria transmission, thus making this process an attractive target to control the disease. All apicomplexan parasites, including Plasmodium sporozoites, deploy three secretory organelles, viz., the micronemes, dense granules, and rhoptries for the secretion of a variety of proteins that aid in parasite motility, cell traversal, and host cell invasion (7). Post-invasion, some secretory proteins also contribute to the formation of parasitophorous vacuolar membrane (PVM) (8), a unique structure that prevents the endocytic fusion and cellular degradation of the intracellular parasites (9).
The rhoptries in Plasmodium schizonts are the largest, club-shaped secretory organelles (10) originating from the fusion of coated vesicles of the Golgi (11). They are delimited by a membrane and organized into a distinct neck and bulb region (11, 12), which respectively make up nearly 2% and 7% volume of the merozoite (12). As these are required for invasive stages, they arise de novo during sporogony and schizogony stages (13, 14), with the exception of the midgut invasive ookinete stage, where they are completely absent (15). Recent experimental approaches have identified nearly 45 and 11 proteins localizing to the rhoptries of merozoites and sporozoites, respectively (16). The rhoptry proteins perform a myriad of functions in asexual stages. In Plasmodium falciparum, there is a distinct division of labor for the activities of the neck and bulb proteins*,* with functions respectively in host cell contact, invasion, and remodeling. For example, the reticulocyte binding proteins like Rh1, Rh2a, Rh2b, Rh4, and Rh5 (17–22) that bind to host cell receptors and facilitate merozoite invasion of RBCs localize to the rhoptry neck. Other rhoptry neck proteins like RON2, RON4, and RON5 are involved in tight junction formation, along with micronemal proteins AMA1 (13). RON3 interacts with RON2 and RON4 but not with AMA1 and hence not a part of moving junction (MJ) complex (23). Interestingly, few RONs are conserved in other Apicomplexan parasites like Toxoplasma and Eimeria, pointing to a common role in host cell invasion mechanisms (13). In contrast, the ROPs are unique to each species of Apicomplexa, likely conferring them with distinct host specificities (13). For example, in Toxoplasma, the ROPs interfere with host cell signaling (24) and abrogate host cell immunity (25, 26), favoring the establishment of chronic infections (27). However, in Plasmodium, ROPs are involved in the biogenesis of rhoptries (28, 29), invasion of host cells (29, 30), PV formation (31), and modification of host cells (32, 33).
More recently, RONs have been implicated in the sporozoite invasion of SGs and hepatocytes. Conditional depletion of RON2 (34) and RON11 (35) in sporozoites impaired SG invasion and reduced hepatocyte infectivity. A well-characterized protein complex of RON2, RON4, and RON5 implicated in merozoite invasion of RBC was also shown to be critical for sporozoite invasion of SGs (36). The study demonstrated a requirement of RON2 interaction with RON4 to form a stable complex that eventually facilitates sporozoite attachment to the substrate. An in vivo role of RON4 has also been demonstrated in gliding and infection of hepatocytes (37). Interestingly, while RON12 localizes to the rhoptry bulb in oocyst and SG sporozoites, it has no role in sporozoite invasion of SGs or hepatocytes, and its depletion does not affect EEF development (38).
The role of RON6 has not been studied in the sporozoite and liver stages of Plasmodium till date. In the current study, we provide a comprehensive analysis of the stage-specific localization of RON6 across all stages of P. berghei. Importantly, we show the localization of PbRON6 on the sporozoite membrane, bearing an extracellular domain and also its association with PVM in liver stages. The study also identified novel interacting partners of PbRON6 in the merozoite stage. We also generated a Pbron6 deletion mutant (PbΔron6) and showed its dispensable nature across all life cycle stages. Nonetheless, the invasive stages of mutant merozoites and sporozoites revealed a dramatic decrease in infectivity to host cells. Interestingly, the PbΔron6 mutants manifested compromised asexual propagation and erythrocytic reinvasion, reduction in hepatic growth and schizogony and delayed pre-patency, collectively leading to reduced parasite virulence. Concomitant with this observation, the mutants induced a condition of hyper-reactive malarial splenomegaly. Immunophenotyping of splenocytes from mutant-infected mice revealed reduced B and T lymphocytes, pointing to an altered immunological niche in the spleen.
RESULTS
Bioinformatics analysis revealed PbRON6 is extracellular
PlasmoDB annotated PBANKA_0311700 as putative rhoptry neck protein 6 in P. berghei (PbRON6), and the gene ID of RON6 in P. falciparum is PF3D7_0214900 (PfRON6). The predicted protein sequences of PbRON6 and PfRON6 had 694 and 950 amino acids (AAs), respectively (Fig. 1A). Functional domain analysis using the DTU/Deep TMHMM prediction tool inferred both PfRON6 and PbRON6 to be globular proteins with no transmembrane domains. A signal sequence was predicted in both PbRON6 and PfRON6 from 1 to 15 AAs, and the sequence beyond 15 AAs was predicted as an extracellular domain (Fig. S1A and B). Signal P-4.1 tool was used to validate the DTU/Deep TMHMM predictions that identified a signal sequence in PfRON6 between AAs 1 and 15, but no signal sequence was detected in PbRON6. The unprocessed cleavage site was represented as C-score, whereas the presence of a signal peptide site was indicated as S-score, and the combination of both C- and S-scores was represented as Y-score. A cut-off value greater than 0.45 indicated the presence of a signal peptide in the PfRON6 (Fig. S1C and D). Phobious web server predicted PbRON6 and PfRON6 as non-cytosolic proteins (Fig. S1E and F). All the orthologs of RON6 had a signal peptide and a conserved C-terminal region. An additional C-terminal cysteine-rich region was present in the RON6 orthologs of human and primate species (Fig. S1G).
Sequence alignment of PbRON6 and PfRON6, and gene expression analysis of Pbron6 (A) Amino acid sequence alignment of P. berghei RON6 (PbRON6) and P. falciparum RON6 (PfRON6). Asterisk () indicates identical amino acid residues, colon (:) indicates the alignment has strongly similar amino acids and dot (.) indicates alignment has weakly similar amino acids. The sub-C-terminal conserved domain is shown in the red box. PfRON6 has an additional 217 amino acid sequence at its C-terminus. (B) Gene expression analysis of Pbron6 from different life cycle stages by quantitative real-time PCR. The cDNAs generated from different stages are indicated as—R: rings, Tr: trophozoites, Sch: schizonts, MG Spz: Midgut sporozoites, SG Spz: Salivary gland sporozoites, 12 h, 24 h, 36 h, 48 h, 65 h—time points of liver stages after sporozoite infection of HepG2 cells and Ms: Merosomes collected from the supernatants of liver stage cultures. Data normalization was performed by taking the ratio of absolute copy numbers of Pbron6 and Pbef1α.*
Pbron6 transcript is highly expressed in schizonts and SG sporozoites
To investigate the expression profile of ron6 across all the life cycle stages of P. berghei, we performed quantitative real-time PCR (qRT-PCR) by the absolute quantification method. The gene expression of Pbron6 was normalized by taking the ratio of Pbron6 and Pbef1α copy numbers. Normalized data showed maximal expression of Pbron6 in the schizonts and SG sporozoites, followed by the ring stage, while other stages showed detectable levels of expression (Fig. 1B).
PbRON6 is expressed in asexual blood stages, sporozoites, and liver stages
To study the stage-specific protein expression and cellular localization of PbRON6 throughout the parasite life cycle, a 3xHA (hemagglutinin) tag was translationally fused to Pbron6 orf at the C-terminus, excluding the stop codon, using standard genetic modification methods (Fig. 2A; Fig. S2A and B). Site-specific integration of the 3xHA localization construct in Pbron6::3xHA parasite genome was confirmed by integration-specific diagnostic PCRs (Fig. 2B). The presence of 3xHA in frame with Pbron6 was confirmed by PCR and Sanger sequencing (Fig. S2C). Indirect immunofluorescence assay (IFA) across the life cycle stages showed punctate staining of HA in the schizont stage, likely suggestive of a rhoptry compartmentalization of PbRON6 in individual merozoites. Gametocytes showed discrete patches of HA expression towards the periphery. Midgut sporozoites showed immunoreactivity in the apical region, indicative of a rhoptry localization of PbRON6, whereas SG sporozoites showed HA expression both in the rhoptries and on the sporozoite membrane. P. berghei PIC5 was used as a marker for schizonts, and SIMP (39) was used as a marker for gametocytes, midgut, and SG sporozoites (Fig. 2C). Next, we investigated the subcellular distribution of PbRON6 in the hepatic stages. We noted HA expression in the 6 h axenic (cell-free) cultures that continued in other stages of EEF development, corresponding to 12, 26, 36, 48, and 62 h in HepG2 cells. Interestingly, at 26 h and other later stages of EEF development, HA staining was observed on the EEF periphery, reminiscent of the staining pattern of PVM (Fig. 2D). We further investigated the 65 h EEFs in HepG2 cells, a point when hepatic merosomes are generated, and HA immunoreactivity was observed in individual hepatic merozoites, which points to the rhoptry localization of PbRON6::3xHA (Fig. 2E and F). Taken together, sporozoites and liver stages showed high expression of PbRON6::3XHA, which may hint at a likely role in maintaining the infectivity in both stages.
Generation of Pbron6::3xHA tagged line and analysis of HA expression across different life cycle stages. (A) Schematic showing the strategy for tagging 3xHA in frame with Pbron6 orf. The top panel shows the genomic locus of Pbron6. The middle panel shows the engineered Pbron6::3xHA targeting construct carrying hdhfr selectable marker cassette flanked by Pbron6 orf and 3′ utr to facilitate double crossover homologous recombination. The solid black lines indicate regions selected for homologous recombination. The lower panel shows Pbron6::3xHA recombined locus. Red triangles indicate the primer positions, and the black line indicates the expected PCR product size to confirm the integrations by diagnostic PCRs. (B) Agarose gel images showing amplicons of diagnostic PCRs from Pbron6::3xHA genomic DNA (gDNA) confirming correct 5′ and 3′ integrations. (C) Analysis of PbRON6::3xHA expression in schizont, gametocyte, midgut, and salivary gland sporozoites (Spz) by indirect immunofluorescence assay (IFA). Each stage (as labeled) was stained with anti-HA rabbit monoclonal antibody and stage-specific markers, as indicated. Immunoreactivity was revealed respectively with Alexa Fluor 488-conjugated anti-rabbit and Alexa Fluor 594-conjugated anti-mouse secondary antibodies. Nuclei were stained with DAPI. Scale bar: 5 µm. (D) Analysis of PbRON6::3xHA expression in developmental stages of EEFs. Axenic and intrahepatic EEFs at indicated time points were stained with anti-HA rabbit monoclonal antibody and anti-CSP (3D11) mouse monoclonal antibody. The immunoreactivity was revealed respectively with Alexa Fluor 594-conjugated anti-rabbit and Alexa Fluor 488-conjugated anti-mouse secondary antibodies. The last panel shows a 36-h WT EEF stained with the same combination of antibodies, confirming the specificity of HA signals in transgenic parasites. Nuclei were stained with DAPI. Scale bar: 10 µm. (E) Merosomes obtained from 65 h EEF cultures were fixed and stained with anti-HA rabbit monoclonal and anti-MSP1 mouse monoclonal antibody. Immunoreactivity was revealed respectively with Alexa Fluor 594-conjugated anti-rabbit and Alexa Fluor 488-conjugated anti-mouse secondary antibodies. Nuclei were stained with DAPI. Scale bar: 10 µm. (F) Enlarged image of merosome with individual merozoites showing RON6-HA immunoreactivity at the apical end. Scale bar: 10 µm. (G) Colocalization of PbRON6::3xHA with PVM marker UIS4. EEFs at 36 h were fixed and stained with anti-HA mouse monoclonal and anti-UIS4 (rabbit) primary antibody. Immunoreactivity was revealed with Alexa Fluor 488-conjugated anti-mouse and Alexa Fluor 594-conjugated anti-rabbit secondary antibodies. Nuclei were stained with DAPI. Scale bar: 10 µm.
PbRON6 colocalized with PVM marker UIS4 in liver stages
During parasite invasion, the proteins of the rhoptry compartment are utilized for two purposes viz., for making a MJ, and second to facilitate the formation of PVM (8). To reiterate our previous observation of PbRON6::3xHA association within the periphery of EEFs, we stained 36 h in vitro liver stages, with HA antibody and UIS4 antibody, a marker for PVM. At multiple foci, PbRON6::3xHA was colocalized with UIS4 (Fig. 2G) and the Pearson correlation coefficient for colocalization was close to 0.8 (Fig. S3A). These studies confirmed that the peripheral HA signals covering the EEF throughout development (Fig. 2D) were indeed from PVM.
The C-terminus of PbRON6 is extracellular
Our IFA studies showed an association of PbRON6 with the apical end and with the membrane of SG sporozoites. The possible orientation of the C-terminal HA tag was tested by performing IFA with and without permeabilization. Sporozoites were stained with 3D11, which binds to a GPI-anchored CSP (40) and HA antibodies (Fig. 3A). The immunoreactivities of CSP and HA showed colocalization, providing compelling evidence that the membrane-associated PbRON6 has an extracellular C-terminal domain. This observation was in agreement with the DTU/Deep TMHMM that predicted amino acids 16–694 to be extracellular.
PbRON6 is associated with the sporozoite membrane with an extracellular C-terminus. (A) Salivary gland sporozoites of PbRON6::3xHA were fixed and immunostained with either anti-HA rabbit polyclonal or anti-HA rabbit monoclonal antibodies along with anti-CSP mouse monoclonal antibody under permeabilized (top panel) and non-permeabilized (bottom panel) conditions. Immunoreactivity was revealed, respectively, with Alexa Fluor 594-conjugated goat anti-rabbit and Alexa Fluor 488-conjugated chicken anti-mouse secondary antibodies. The apical localization of PbRON6::3xHA is shown in white circles (top panel). Nuclei were stained with DAPI. Scale bar: 5 µm. (B) The levels of PbRON6::3xHA associated with the sporozoite membrane were assessed in three different conditions—immediately after isolation from salivary glands (top panel), after incubation of sporozoites at 37°C for 30 min (middle panel), and after incubation of sporozoites at 37°C for 30 min in the presence of HepG2 cells (bottom panel). The sporozoites were stained with anti-HA rabbit and anti-CSP mouse monoclonal antibodies. Immunoreactivity was revealed, respectively, with Alexa Fluor 594-conjugated goat anti-rabbit and Alexa Fluor 488-conjugated chicken anti-mouse secondary antibodies. Nuclei were stained with DAPI. An enlarged inset from the bottom panel shows the accumulation of PbRON6::3xHA at discrete foci on the sporozoite membrane. The right panels show the pixel intensity profile and colocalization of HA and CSP for all three conditions measured by cross-sectional imaging using NIS-element AR software. Scale bar: 5 µm.
PbRON6::3xHA appeared as discrete speckles on the sporozoite membrane following exposure to 37°C and HepG2 cells
The proteins of the rhoptry compartment have been implicated in both the formation of the MJ and PVM (8). For the formation of a MJ, the rhoptry protein accumulates at the apical end of the zoite and is secreted onto the host cell membrane, thereby establishing a connection with a preformed RON2-AMA1 complex (41). As these events are also conserved during the hepatic sporozoite invasion (36), we reasoned whether temperature shift and hepatocyte contact upregulated the sporozoite-specific expression of PbRON6::3XHA. To this end, we analyzed PbRON6::3xHA expression on sporozoites under three conditions, viz., immediately after isolation from SGs, 30 min after exposure to 37°C, and 30 min after exposure to 37°C in the presence of HepG2 cells. The PbRON6::3XHA levels were analyzed by IFA using HA antibody, and the sporozoites were counter-stained with 3D11 (Fig. 3B). We noted very meager levels of PbRON6::3xHA in immediately dissected sporozoites, while sporozoites exposed to 37°C had some appreciable levels of protein appearing on the sporozoite membrane. However, when incubated with host cells, we noted a dramatic accumulation of PbRON6::3xHA at several foci, as discrete spots on the sporozoite membrane. We conclude that PbRON6::3xHA accumulates on sporozoite membrane when exposed to 37°C and further, its levels increases in contact with hepatocytes. The levels of PbRON6::3xHA were confirmed by measuring fluorescence pixel intensity across the sporozoite membrane (Fig. 3B).
PbRON6::3xHA is not released during sporozoite exocytosis
As our studies showed an extracellular nature of the C-terminal domain of PbRON6, we next investigated the possible inactivation of PbRON6::3xHA tagged sporozoites, following their exposure to anti-HA antibodies. Sporozoite inactivation following exposure to 3D11 is well known owing to the binding of the antibody to CSP repeats present on the sporozoite membrane. The CSP-antibody complex is shed from the posterior end of the sporozoite in a characteristic “precipitin reaction” that can be visualized under a microscope. This complex gets sloughed off during sporozoite gliding movement (42), finally leading to their immobilization (43) (Fig. 4A). The shedding of the CSP-antibody complex is due to the exocytosis of CSP, following its proteolytic cleavage by a sporozoite membrane resident cysteine protease (44). Since we demonstrated that PbRON6 is localized on the sporozoite membrane, we asked if it is also secreted through exocytosis. In three independent experiments, we incubated 5 × 10^3^ PbRON6::3xHA sporozoites with 1 µg of anti-HA rabbit monoclonal or 3D11 at 37°C for 30 min and visualized under a microscope. As expected, the sporozoites treated with 3D11 exhibited precipitin reaction; however, no such activity was noted with the anti-HA antibodies (Fig. 4A). In fact, anti-HA antibody treatment did not arrest the motility of the PbRON6::3xHA transgenic sporozoites. To rule out the possibility of low or undetectable levels of PbRON6 released during exocytosis, we analyzed the levels of PbRON6::3xHA in media incubated with sporozoites for 30 and 60 min. The supernatant and pellet fractions were analyzed by immunoblotting to check the levels of CSP and PbRON6::3xHA (Fig. 4B). We noted a dose-dependent release of CSP in the supernatants, while PbRON6::3xHA was not released. However, in the pellet fraction, we noted PbRON6::3xHA expression, whose levels were much lower compared to CSP. We conclude that no detectable processing of PbRON6 likely happens on the surface of the sporozoite.
*PbRON6::3xHA is not released during sporozoite exocytosis. (A) Exocytosis of PbRON6::3xHA sporozoites. Representative images of PbRON6::3xHA sporozoites treated with 3D11 (top panel) and anti-HA rabbit monoclonal antibody (lower panel), in three independent experiments: 1, 2, and 3. Scale bar: 5 µm. (B) Immunoblots showing exocytosis of 5 × 10⁴ PbRON6::3xHA transgenic sporozoites in RPMI medium with 10% FBS, incubated for 30 and 60 min at 37°C. Supernatant (top panel) and pellet (bottom panel) fractions were subjected to SDS-PAGE followed by western blot analysis. The membranes were probed with 3D11, which recognizes the central repeat region of CSP, and anti-HA rabbit monoclonal antibodies. The immunoreactivity was revealed with anti-mouse and anti-rabbit secondary antibodies conjugated with HRP, and the bands were visualized by the ECL detection. A time-dependent exocytosis was noted in the supernatant only for CSP (black arrows) but not for PbRON6::3xHA. The sporozoite pellet showed immunoreactivity for both CSP (black arrow) and PbRON6::3xHA (blue arrow). (C) Fate of 3D11 and anti-HA rabbit monoclonal treated PbRON6::3xHA transgenic sporozoites in the mouse macrophage (RAW) cell line. PbRON6::3xHA sporozoites were incubated with either 3D11 or anti-HA rabbit monoclonal antibodies for 30 min at room temperature and added to the RAW cell line. After 7 h, indirect immunofluorescence assay was performed using 3D11 to visualize sporozoites and rabbit anti-Rab5 was used to stain macrophage endosomes. The immunoreactivity was revealed with Alexa Fluor 488-conjugated anti-mouse and Alexa Fluor 594-conjugated anti-rabbit secondary antibodies. Nuclei were stained with DAPI. Scale bar: 5 µm. (D) Bar graph showing quantification of extracellular sporozoites treated with 3D11 or anti-HA. Error bars represent mean with standard deviation (***P < 0.0001, Mann-Whitney test).
Anti-HA antibody-treated PbRON6::3xHA sporozoites are not opsonized
Opsonization is the most common outcome of antibody coating the pathogens and is mediated by a variety of Fc and complement receptors present on phagocytic cells (45, 46). We analyzed whether anti-HA treated sporozoites were subjected to phagocytosis in vitro. As a control, we treated sporozoites with 3D11. Both groups of treated sporozoites were added to the RAW, a mouse macrophage cell line. We noted that the majority of 3D11-coated sporozoites were taken up by the RAW cells as observed at 7 h post-addition (Fig. 4C, upper panel and Fig. 4D). These sporozoites were predominantly intracellular and appeared disintegrated as revealed by 3D11 staining. Interestingly, the CSP staining colocalized with Rab5, an early endosomal marker (Fig. 4C, middle panel). However, the anti-HA antibody-treated PbRON6::3xHA sporozoites were predominantly extracellular, indicating their lack of opsonization (Fig. 4C, lower panel and Fig. 4D).
PbRON6 interactome majorly included clients involved in host cell invasion and remodeling
To investigate the interacting partners of PbRON6, we performed co-immunoprecipitation (IP) followed by LC/MS-based protein identification. The HA antibody or pre-immune IgG was conjugated to protein A/G beads and incubated with schizont lysates prepared from PbRON6::3xHA line. The elute was analyzed on an immunoblot, which revealed the presence of PbRON6::3xHA protein only in IP with HA antibody and not in IgG control (Fig. 5A). The most probable interacting partners of PbRON6 for which more than two peptides were detected in LC/MS analysis are shown in Fig. 5B.
Identification of PbRON6 interactome by LC/MS analysis. (A) Western blot showing the presence of PbRON6 both in the schizont lysate (input) and proteins pulled down using anti-HA antibody. PbRON6 was not detected in immunoprecipitation (IP) performed with pre-immune IgG (negative control). (B) List of PbRON6 interacting partners identified by LC/MS analysis with significant sequestHT score. (C) Pie diagram showing the percentage of identified proteins categorized in individual clusters identified by functional gene ontology (GO). (D) Functional clusters showing the list of proteins interacting with RON6 detected in LC/MS analysis by co-IP using anti-HA antibody. (E) Schematic showing the probable novel invasion-related complex identified in this study.
The interactome study identified proteins involved in merozoite invasion, like apical complex proteins such as RON2, RON3, ROP14, and apical merozoite protein. The inner membrane complex protein CLAG and the merozoite surface proteins MSP1, MSP9, and MSRP2 were also identified (Fig. 5B). Relative percentage of protein clusters interacting with PbRON6 was indicated as invasion related (16%), metabolic enzymes (8%), chaperones (10%), others (37%), and unknown (8%) (Fig. 5C). A few representative candidates within each cluster are shown in Fig. 5D. Each cluster was assigned a GO term ID based on the fold enrichment (P value < 0.01) (Fig. S5). A model was generated to show known parasite proteins interacting with RBC and those identified in the current study (Fig. 5E).
The PbΔron6 parasites exhibited slow asexual growth and decreased virulence
To investigate the functional role of PbRON6 across all the life cycle stages of Plasmodium, a knockout mutant (PbΔron6) was generated by double homologous recombination. The Pbron6 orf was replaced with hdhfr::yfcu dual selectable marker (SM) cassette (Fig. 6A). The correct integration was confirmed by diagnostic PCRs that showed expected products of 1.6 and 1.2 kb that confirmed the 5′ and 3′ integrations, respectively (Fig. 6B left panel). The Pbron6 null mutants were cloned by limiting dilution, and clones from two independent transfections were isolated for further phenotypic characterization. Genotyping of the clonal population by PCRs confirmed the absence of Pbron6 orf in clonal lines. (Fig. 6B, right panel).
*Pbron6 is required for normal asexual propagation. (A) Strategy to generate PbΔron6 by double crossover homologous recombination. The top panel shows the genomic locus of Pbron6. The middle panel shows Pbron6 knockout targeting construct carrying hdhfr and yfcu selectable marker (SM) cassette, flanked by Pbron6 5′ and 3′ utr regions for double crossover homologous recombination. The solid black lines indicate regions selected for homologous recombination. The lower panel shows the recombined locus, where the Pbron6 open reading frame (orf) is replaced with a SM cassette. Red triangles indicate the primer position, and bottom black line indicates the expected PCR product sizes. (B) Agarose gel image showing the 5′ and 3′ integration (5′ int—5′ integration and 3’ int—3′ integration) specific diagnostic PCRs (left panel), confirming the replacement of Pbron6 orf with SM (middle panel). The drug-resistant population of PbΔron6 was subjected to cloning by limiting dilution from two independent transfections. Agarose gel image showing amplification of product only from the genomic DNA of wild type but not from PbΔron6 clones cl1 and cl2 (right panel). Primer sequences and expected PCR product sizes are shown in Table S1. (C) Asexual growth propagation of PbΔron6 cl1 and cl2 in BALB/c mice. 1 × 10³ infected RBCs of WT, PbΔron6 cl1, and cl2 were injected intravenously in all three groups of BALB/c mice (n = 5/group). Parasitemia was monitored by reading the Giemsa-stained blood smears. Error bars represent the mean with standard deviation (**P < 0.005, one-way ANOVA with Tukey’s multiple comparison test). (D) Reinvasion assay was performed in vivo by intravenous injection of 1 × 10⁹ purified schizonts of WT and PbΔron6 cl1 into two groups of BALB/c mice (n = 5). Parasitemia was monitored every 6 h post-infection by reading the Giemsa-stained blood smears. Error bars represent the mean with standard deviation (**P = 0.0045, Mann-Whitney test). (E) Kaplan-Meier plots, representing the duration of C57BL/6 mice survival, following infection with WT and PbΔron6 cl1 (n = 10, **P < 0.0001, Mantel-Cox test). (F) Strategy for complementation of PbΔron6 locus. The top panel shows hdhfr and yfcu cassettes at PbΔron6 locus. The middle panel shows an engineered complementation construct, carrying Pbron6 orf flanked by its native 5′ and 3′ utrs. The solid black lines indicate regions selected for homologous recombination. The lower panel shows complementation of the knockout locus with Pbron6 orf. Complemented parasites were enriched by negative selection with 5-fluorocytosine (5-FC). (G) Agarose gel image showing the presence of Pbron6 orf, 5′ and 3′ integration specific diagnostic PCRs confirming the replacement of SM cassette with Pbron6 orf (left panel). (H) Restoration of asexual propagation rate in Pbron6 complemented (Pbron6(c)) clones—cl1 and cl2. Pbron6 complemented (Pbron6(c)) parasites (cl1 and cl2) showing similar asexual propagation compared to WT (P = 0.9910, one-way ANOVA with Dunnett’s multiple comparison test). (I) Percentage of mice showing pre-patency. Pbron6 complemented line shows similar pre-patency compared to WT in C57BL/6 mice (n = 5) (P > 0.99, Mantel-Cox test).
Asexual propagation of PbΔron6 line in mice was determined by delivering 1 × 10^3^ mutant parasites intravenously. Mice receiving a similar number of wild-type (WT) parasites served as a control. We observed a gradual increase in parasitemia of the WT line from approximately 4.5% to 17% during days 5–8. However, the parasitemia of mice harboring PbΔron6 mutants did not exceed more than 1% during the same duration. The slow growth phenotype of the mutant was manifested identically in two null mutant clones derived from independent transfections (Fig. 6C). The data provided compelling evidence for the requirement of Pbron6 in normal propagation of asexual stages. Considering that Pbron6 showed high expression in the mixed blood stages, lack of expression may impact either the growth of the parasite or the reinvasion of freshly egressed merozoites, which accounted for its slow growth. To test this hypothesis, we injected intravenously 1 × 10^9^ synchronized schizonts of PbΔron6 or the WT line into Swiss mice. Parasitemia was monitored every 6 h for a duration of 48 h. This allowed capturing reinvasion of freshly egressed merozoites into RBC, thus enabling the analysis of any defect in this process. We noted a progressive increase in parasitemia from 0.4% to 1.5% in WT. During this time, the parasitemia of the mutant line increased only in an incremental manner from 0.2% to 0.5% (Fig. 6D). Our observation reiterated that the reduced asexual propagation noted in earlier experiments was indeed associated with reduced invasion efficiency of erythrocytic merozoites. A likely explanation for the observed phenotype is that PbRON6 may be required for the formation of the MJ, and its altered composition in the absence of PbRON6 may dramatically impact but not totally abrogate invasion.
Mice infected with PbΔron6 parasites showed an enhanced survival rate
As mutant parasites lagged in asexual propagation, we next assessed the survival rate of mice harboring these mutants. To this end, we injected intravenously 1 × 10^3^ PbΔron6 or WT parasites in female C57BL/6 mice (n = 10 per group). The survival duration of mice infected with WT parasites ranged from 8 to 16 days, while that of mice harboring Pbron6 null mutants was significantly prolonged and survived for 22–32 days post-infection (Fig. 6E). Taken together, PbRON6 depletion affected both the reinvasion capacity and overall virulence of the mutant parasite.
PbΔron6 complementation restored asexual propagation
To demonstrate that the observed phenotype in PbΔron6 mutant was indeed due to the lack of Pbron6 expression, we complemented the KO locus with Pbron6 orf. The complementation construct was generated by replacing the hdhfr::yfcu marker cassette in the PbΔron6 construct with Pbron6 orf. The complementation construct was transfected into the PbΔron6 mutant following standard transfection procedures, and the integrants were selected by providing 5-fluorocytosine (5-FC) in the drinking water of mice (Fig. 6F). The correct integrations were confirmed by diagnostic PCRs that showed expected products of 1.6 kb of both the 5′ and 3′ integrations (Fig. 6G). The Pbron6-complemented parasites (Pbron6(c)) were cloned by limiting dilution, and two clonal lines obtained from independent transfections were used for further phenotypic characterization. Genotyping of clonal population by PCRs using Pbron6 primers confirmed the presence of Pbron6 orf in clonal lines (Fig. 6G).
With the complemented parasites, we analyzed the asexual propagation in mice. We injected 1 × 10^3^ asexual parasites of either WT or Pbron6 complemented lines into Swiss mice by i.v. and monitored parasitemia from day 5 to 8. We noted that both complemented clones propagated at rates comparable to the WT (Fig. 6H) restoring the defect seen in the mutants. We also monitored the survival rate of mice in one of the complemented lines (clone 1). We noted that all five mice succumbed to mortality between 8 and 12 days, as noted for the WT line (Fig. 6I). Thus, complementation of Pbron6 orf in the KO line resulted in restoring the infectivity and virulence of the parasite.
The PbΔron6 parasites exhibited normal development in the mosquito vector
To investigate the effect of the Pbron6 depletion in the sexual stage of the parasite life cycle, female A. stephensi mosquitoes were infected with WT, PbΔron6 mutant, or Pbron6(c) line. On day 14, post-blood meal, the mosquito midguts were observed for the presence of oocysts (Fig. 7A). We noted the oocyst numbers (Fig. 7B), sporulation pattern (Fig. 7C), and midgut sporozoite numbers (Fig. 7D) in the PbΔron6 mutant line were comparable to both WT and Pbron6(c) lines. Since oocyst formation in the mutant is normal, this reiterated no discernible effect on ookinete formation. This observation concurred with the general notion that ookinetes that do not have rhoptries (15) remain unaffected when the composition of the rhoptry compartment is altered.
Phenotypic characterization of PbΔron6 and Pbron6 complemented (C) lines in mosquito. (A) Representative images of mosquito midguts, showing oocysts in WT, PbΔron6, and Pbron6(c) line. Scale bar: 200 µm. (B) The frequency of oocysts per mosquito in WT, PbΔron6, and Pbron6(c) lines. The horizontal lines indicate the median with 95% confidence interval (CI) (n = 35). Statistical differences were determined by one-way ANOVA with Holm-Šídák’s multiple comparisons test. ns: not significant. (C) Representative images of oocysts from WT, PbΔron6, and Pbron6(c) lines. Scale bar: 20 µm. (D) Bar graph showing the average number of oocyst sporozoites from WT, PbΔron6, and Pbron6(c) lines. Each bar represents the mean with standard deviation. n = 5 for WT, and PbΔron6, and n = 3 for Pbron6(c) line with 15–20 mosquitoes per experiment. Statistical differences were determined by one-way ANOVA with Tukey’s multiple comparisons test. ns: not significant. (E) Dissected salivary glands harboring sporozoites of WT, PbΔron6, and Pbron6(c) lines (top panel). Inset showing enlarged image of sporozoites (bottom panel). Scale bar: 200 µm. (F) Bar graph showing the average number of salivary gland sporozoites from WT, PbΔron6, and Pbron6(c) line. Each bar represents the mean with standard deviation. n = 5 for WT and PbΔron6, and n = 3 for Pbron6(c) line with 50–60 mosquitoes per experiment. Statistical differences were determined by one-way ANOVA with Tukey’s multiple comparisons test. ns: not significant.
We next analyzed the ability of the mutant sporozoites to colonize the SGs. We noted the presence of PbΔron6 sporozoites in mosquito SGs, whose morphology (Fig. 7E) and numbers (Fig. 7F) were indistinguishable from WT and Pbron6(c) lines. Taken together, the mosquito stages of PbΔron6 manifested no alteration in phenotype, revealing a dispensable role of PbRON6.
PbΔron6 mutant parasites showed delayed pre-patency
We next tested the effect of PbΔron6 sporozoite infectivity on pre-patency, which is defined as the time required for detection of blood stage infection following delivery of infectious sporozoites. In two independent experiments, female C57BL/6 mice were infected intravenously with 5 × 10^3^ sporozoites of either PbΔron6 or WT parasites. Parasitemia was monitored in all the animals from day 3 post-infection by making Giemsa-stained tail blood smears. Animals exposed to WT sporozoites exhibited pre-patency of day 3.5, whereas mice infected with PbΔron6 mutant sporozoites, became pre-patent by day 8 (Table 1). When the experiment was repeated with 1 × 10^4^ sporozoites, we noted a pre-patency of 7.5 days in PbΔron6 mutant, whereas WT-infected mice showed 3.5 days (Table 1).
The PbΔron6 mutant sporozoites exhibited normal gliding motility
PbΔron6 sporozoites exhibited delayed pre-patency compared to WT sporozoites, which is likely attributable either to a defect in gliding motility or hepatocyte invasion. Plasmodium sporozoites rely on substrate-dependent, actin-based gliding motility to penetrate host cells and traverse cellular barriers (47). The gliding motility of SG sporozoites was analyzed by observing the patterns of CSP trails. PbΔron6 sporozoites displayed CSP trails similar to WT sporozoites, indicating normal gliding motility (Fig. 8A).
*Assessing the in vivo infectivity of PbΔron6 sporozoites. (A) Trails of CSP shed by PbΔron6 sporozoites reveal normal gliding motility, comparable to WT. Scale bars: 10 µm. (B) Bar graph showing the invasion efficacy of PbΔron6 in HepG2 cells quantified by the sporozoite inside-out assay. Each bar represents the mean with standard deviation. n = 3 for WT and n = 4 for PbΔron6, and 20 representative fields were counted for each experiment. Statistical difference was determined by unpaired t-test. ***P < 0.0001. (C and D) Bar graphs showing P. berghei 18S rRNA liver burden in mice at 6 h (C), 12 h (D), and P. berghei MSP1 at 48 h (E). Mice were infected intravenously with 5 × 10³ sporozoites of the WT and PbΔron6 cl1 line. Mice from each group were sacrificed, respectively, at 12 and 48 h. Total RNA was extracted from the livers of infected mice, and cDNA was generated. Real-time PCR was used to quantify the P. berghei 18S rRNA and P. berghei MSP1 transcripts following 2−ΔΔCt method. Mouse gapdh was used for the normalization. Each bar represents the mean with standard deviation and n = 3, with each experiment performed in triplicate. Statistical difference was determined by an unpaired t-test.
PbRON6 is required for the host cell invasion
Since erythrocytic merozoites were compromised to invade RBCs under conditions of Pbron6 depletion, we next investigated if other invasive stages, like the SG sporozoites, had any discernible deficiency in hepatocyte invasion. To test this, we added 2 × 10^4^ sporozoites of either WT or PbΔron6 mutants to HepG2 monolayer and maintained for 1 h at 37°C, prior to fixation. A dual sporozoite staining assay using 3D11 (anti-CSP) monoclonal antibody under permeabilized and non-permeabilized conditions, called the “inside-out assay,” was performed (48). The assay allowed quantification of invaded and extracellular sporozoites that revealed 60% invasion of the WT sporozoites, while the PbΔron6 sporozoites exhibited invasion efficiency of nearly 20% (Fig. 8B). We conclude that the mutant sporozoites failed to invade HepG2 cells efficiently in the absence of PbRON6.
Pbron6 depletion altered sporozoite infectivity and EEF development
To investigate the in vivo hepatocyte invasion efficiency, the parasite liver burden was estimated in mice infected with PbΔron6 or WT parasites. C57BL/6 mice were injected with 5 × 10^3^ sporozoites intravenously, and livers were isolated at 6, 12, and 48 h post-infection (hpi). Total RNA was isolated from the livers, and approximately 2 µg was reverse transcribed. cDNA samples were used to quantify the expression of Pb18S rRNA at 6 and 12 h, and msp1 at 48 h by qRT-PCR. Mouse gapdh was used as an internal control. The mutants manifested nearly 99-fold and 5-fold reduction in sporozoite commitment to hepatocytes as inferred from the Pb18S rRNA quantification at 6 and 12 h, respectively (Fig. 8C and D). We also noted a 65-fold reduction in liver burden quantified from msp1 expression at 48 hpi (Fig. 8E). Taken together, Pbron6 depletion resulted in reduced efficiency of sporozoite invasion and also developmental arrest in mutant EEFs. The developmental arrest in the liver may likely be attributed to the lack of association of PbRON6 with PVM in the developing EEFs in mutants.
Owing to the delay in pre-patency and reduced msp1 levels in mice exposed to PbΔron6 sporozoites, we next analyzed if there was any developmental defect associated with EEF maturation. To test this, the HepG2 monolayers were infected with 1.5 × 10^4^ sporozoites of either WT or PbΔron6 sporozoites, and the cultures were fixed at different time points of EEF maturation. The liver stage cultures were stained with a PVM marker, UIS4, and EEF marker CSP (Fig. 9A) at 12, 36, and 48 h. The 60 and 65 h EEFs were stained with MSP1 and UIS4 (Fig. 9A). While no detectable size difference was observed at 12 h in PbΔron6 mutant EEFs as compared to WT, in all the other developmental stages, we found that EEFs derived from mutant sporozoites were smaller than WT (Fig. 9B and C). We also observed a notable reduction in hepatic schizogony at the 65-h time point (Fig. 9D). Interestingly, the cytomeres within the PbΔron6 mutant EEFs were larger as compared to WT at 48 and 60 h, indicating a developmental defect (Fig. 9A). A small fraction of mutant EEFs appeared similar in size to WT EEFs; however, they were still in the cytomere stage, indicating a lag in the development (Fig. S3B and C).
*EEF development of PbΔron6 mutants in HepG2 cells. (A) Growth of EEFs was monitored at 12, 36, 48, 60, and 65 h post-invasion, by performing an immunofluorescence assay. The 12, 36, and 48 h cultures were stained with rabbit anti-UIS4 (PVM marker) and mouse anti-CSP (3D11). Immunoreactivity was revealed, respectively, with Alexa Fluor 594-conjugated anti-rabbit and Alexa Fluor 488-conjugated anti-mouse secondary antibodies. The 60 and 65 h cultures were stained with rabbit anti-UIS4 antibody and mouse anti-MSP1 antibodies. Immunoreactivity was revealed, respectively, with Alexa Fluor 594-conjugated anti-rabbit and Alexa Fluor 488-conjugated anti-mouse secondary antibodies. DAPI was used to visualize host and parasite nuclei. Scale bar: 10 µm. (B and C) Dot plots showing the quantification of EEF area at 36 and 65 h post-infection using NIS-Elements AR software. Error bars represent the mean with the standard deviation. Statistical difference was determined by Mann-Whitney test. ****P < 0.0001. (D) Dot plot showing the quantification of hepatic merozoites in 65 h EEFs. Error bars represent the mean with the standard deviation. Statistical difference was determined by Mann-Whitney test. ***P < 0.0001.
PbΔron6 parasites induced hyper-reactive malarial splenomegaly
Splenomegaly is a frequent clinical manifestation of malaria infection (49). We observed an increase in size (Fig. 10A), weight (Fig. 10B), and length (Fig. 10C) of spleens taken from the mice infected with PbΔron6 compared to WT. The average weight of the uninfected spleens was nearly 89 mg, while spleens taken from WT-infected mice weighed nearly 260 mg. Interestingly, the spleen from mice infected with the PbΔron6 mutant weighed approximately 960 mg. The increased weight of spleens in mice infected with PbΔron6 mutants was reminiscent of hyper-reactive malarial splenomegaly (HMS) that appears sporadically in humans subjected to chronic malaria infections. We noted that the ability to induce HMS in C57BL/6 mice was independent of the sporozoite inoculum used to induce infection (Fig. 10A through C).
Histopathology of spleens taken from PbΔron6-infected mice reveals hyper-reactive malarial splenomegaly. (A) Representative images of spleens isolated from uninfected (U), P. berghei wild-type (WT), and PbΔron6-infected mice. The upper panel and lower panel show images of spleens taken from C57BL/6 mice exposed to an intravenous dose of 5 × 10³ and 1 × 10⁴ sporozoites, respectively. (B) Bar graph showing the weight of spleens measured in grams from uninfected (U), P. berghei WT, and PbΔron6-infected mice. Statistical differences were determined by one-way ANOVA with Tukey’s multiple comparisons test (n = 5). (C) Bar graph showing the lengths of spleens measured in cm from uninfected (U), P. berghei WT, and PbΔron6-infected mice. Statistical differences were determined by the Kruskal-Wallis test with Dunn’s multiple comparisons test (n = 5). (D) H&E staining of spleen sections from uninfected, P. berghei WT and PbΔron6-infected mice. The black circles indicate intact lymphoid follicles in the spleens. No lymphoid follicles were noted in the spleens of PbΔron6-infected mice. Scale bar: 2 mm. (E) Sections of spleen showing hemosiderophages in uninfected, P. berghei WT, and PbΔron6-infected mice. Scale bar: 30 µm. (F) Bar graph showing the B and T cell quantification by flow cytometry. The splenocytes obtained from uninfected, P. berghei WT, and PbΔron6-infected mice were stained with anti-CD3 and anti-CD20 and quantified by flow cytometry.
To investigate the histopathological changes in the spleens of mice infected with PbΔron6 mutants, H&E staining was performed. A clear demarcation between the white pulp and red pulp, with prominent marginal zones and resting follicles, was observed in the spleens of uninfected mice. However, in the spleens of WT-infected mice, an enhanced cellularity in red pulp and an increased size of white pulp were observed. Interestingly, in the spleens of mice infected with PbΔron6 mutants, there was an obliteration of the white pulp region with predominance of red pulp and indistinct demarcation of marginal zones (Fig. 10D). An increased number of hemosiderophages in spleens obtained from mutant-infected mice indicated the over-destruction of iRBC (Fig. 10E). Immunophenotypic analysis of spleens was performed by analyzing the levels of CD20, a B-cell marker, and CD3, a T-cell marker, by flow cytometry. We noted that in PbΔron6-infected mice, both CD20 and CD3 expressing cells were low as compared to mice infected with WT or no infection (Fig. 10F). This concurred with the loss of lymphoid follicular patterns in PbΔron6-infected mice. Taken together, hyper-reactive malarial splenomegaly induced by PbΔron6 mutants dramatically reduced the population of B and T lymphocytes in the spleen, which hints at an altered immunological niche.
DISCUSSION
In the current study, an in-depth functional investigation of PbRON6, a putative orthologue of P. falciparum RON6, was performed across all life cycle stages using a genetic approach. These studies revealed novel and previously unappreciated roles of PbRON6 in cellular redistribution, host cell invasion, and maintenance of virulence. Structurally, PbRON6 lacks the C-terminal Cys-rich domain, previously implicated in host cell invasion and correct protein trafficking in P. falciparum (50). Further, in striking contrast to the indispensable nature of the Pfron6 locus and its C-terminal Cys-rich domain (50), we demonstrate the feasibility of successfully targeting the Pbron6 locus.
Bioinformatics and biochemical approaches revealed localization of PfRON6 to rhoptries in schizonts and rings and to PVM in maturing intra-erythrocytic forms (50). However, not much is known about the localization of PfRON6 in the sporozoite and EEFs. The only studies available for RON6 localization are from the rodent malaria model of P. berghei, using an immunoelectron microscopy approach, where it was shown to reside in rhoptries of sporozoite (51). However, the cellular distribution of PbRON6, especially in the developing liver stages and merosomes, is yet to be characterized. We used online prediction tools to assess the cellular probability of RON6. DTU/Deep TMHMM predicted both P. falciparum and P. berghei RON6 as globular proteins. Both orthologs lack a transmembrane domain but possess a large extracellular domain. Phobious server predicted both PfRON6 and PbRON6 as non-cytosolic proteins. Consistent with these predictions, we noted an association of PbRON6::3xHA with the sporozoite and PVM membrane, colocalizing with CSP and UIS4, respectively. Interestingly, the extracellular nature of PbRON6 C-terminal domain could also be confirmed by HA immunoreactivity on sporozoites under non-permeabilized conditions. Previous studies reported the immunoreactivity of malarial antisera from Vietnam and Papua New Guinea to the N, C, and Cys-rich repeat regions of recombinantly expressed PfRON6 (50), likely implying that all three domains are targets for antibodies in the merozoite stage. The positive immunoreactivity towards PfRON6 may possibly be explained, owing to the presence of a signal peptide that allows its trafficking to the secretory compartment, as demonstrated earlier (50). Though DeepTMHMM predicted a signal peptide in PbRON6, N-terminal antisera from PbRON6 (110–281 AAs) failed to show immunoreactivity on sporozoite membrane under non-permeabilized condition. Rather, we noted an intracellular localization, most prominently in proximity to the nucleus, likely hinting to an ER association that needs further confirmation. It is speculative if PbRON6 targets to ER and only processed form translocates to the sporozoite membrane, with a possible C-terminus positioned extracellularly.
The punctate staining pattern of PbRON6 in daughter cells of schizonts and hepatic merozoites, characteristic of the rhoptries, is by and large, expected. This may explain the lack of optimal invasion of Pbron6 mutants into RBC, given that rhoptry neck proteins have been implicated in the formation of MJ (52), though a definitive role of PbRON6 in the complex has not been demonstrated in this study. Our study also provides additional evidence for the role of PbRON6 in the invasion of hepatocytes, both under in vitro and in vivo conditions. Following sporozoite inoculation into a mammalian host, and prior to its hepatocyte entry, several transcripts implicated in invasion and subsequent intrahepatic development are upregulated, as demonstrated in a model of co-culture of P. falciparum sporozoites with primary human hepatocytes (53). This concurs with the “just in time” model of gene expression, preparing invasive stages for host cell entry, characterized by enhanced synthesis of apical secretory and parasite surface proteins (54). The maximal gene expression of Pbron6 in schizonts and SG sporozoites may imply two bursts of transcriptional activities, coinciding with the need to invade RBC and hepatocytes respectively.
Interestingly, we noted aggregates of PbRON6::3xHA at multiple foci over the membrane when sporozoites contacted with host cells maintained at 37°C. This hinted at its role in hepatocyte commitment, though no secreted form of PbRON6::3xHA was detected in sporozoite incubated supernatants. In comparison to the rhoptry discharge that occurs only once during the RBC invasion of merozoites, sporozoites may have to release the rhoptry contents, possibly during SG invasion, hepatocyte invasion, and also export to the EEF membrane. Therefore, PbRON6 secretion may be programmed for release in multiple bouts to meet the aforementioned invasion and EEF development-related functions.
A conditional depletion of RON 2, 4, and 5 complexes affects normal substrate attachment in sporozoites, resulting in reduced gliding (36). A similar function was also noted for PbRON11 (35). Contrastingly, we noted no effect of PbRON6 depletion on the colonization of sporozoites in the SGs, substrate attachment, and gliding. However, mutant sporozoites showed a seven fold reduction in HepG2 cell invasion as compared to WT, which was also reiterated in vivo, as noted from reduced levels of Pb18S rRNA at 6 and 12 hpi, following exposure of mice to mutants. Taken together, these observations point to the role of PbRON6 in hepatocyte invasion.
A reduction in hepatic schizogony was another important observation noted in PbΔron6 mutants. It is speculative whether the reduction in hepatic schizogony is due to a lack of recruitment of PbRON6 on PVM. In fact, other proteins like RAP2/3 that localize to rhoptries of midgut and SG sporozoites are recruited to PVM (55). Another rhoptry protein, ICP, which has a role in the inhibition of host proteases and egress of hepatic merozoites (56), also continues to be expressed in P. yoelii sporozoite cytoplasm and in PVM of P. yoelii and P. falciparum. While the precise role of PbRON6 in PVM maintenance is yet to be deciphered, decreased schizogony, reduction in the msp1 expression at 48 h, and delay in pre-patency reiterated a growth defect during late EEF development.
The IP and mass spectrometric analysis with C-terminal HA-tagged PbRON6 parasites revealed PbRON6 interaction with a diverse range of putative proteins involved in erythrocyte invasion and host cell remodeling. This may explain the delay in asexual propagation and RBC reinvasion associated with the mutant. Of particular interest were proteins like MSP1, MSP9, RON3, RAP1, and Apical merozoite protein, an ortholog of Pf34, that were detected only in pulldown with PbRON6::3xHA parasite lysates. MSP1 forms a complex with other merozoite surface proteins such as MSP3, MSP6, MSP7, and MSP9 (57) to facilitate anchoring to the erythrocyte membrane via band3 protein (58). Paradoxically, however, merozoites lacking MSP1 expression can still invade RBCs (59), and a likely mechanism may be by utilizing peripheral invasins, which may mediate tight attachment to the RBC surface. Though not demonstrated in merozoites, our study shows an association of the PbRON6 C-terminal extracellular domain with the sporozoite membrane that may act as an invasin in the invasion complex. Another novel rhoptry bulb protein detected in LC/MS analysis with a high confidence score was RON3. A recent work claimed that knockdown of PfRON3 C-terminal fragment expression in the early schizont stage induced a defect in erythrocyte invasion and resulted in developmental arrest at the ring stage (60, 61). We observed a similar phenotype where reinvasion was compromised in PbRON6 mutants. Further, two independent studies elucidating colocalization of PfRON6 with Pf34 in the rhoptry neck (50) and interaction of C-terminus of PfRON6 with Pf34 (62), aligns with our findings from LC/MS-based interactome studies.
A massive increase in spleen size during malaria infection, referred to as hyper-reactive malarial splenomegaly (HMS) (63), occurs due to chronic antigenic stimulation in subjects having long-term exposure to malaria parasites (64). Although a triad of symptoms characterized by enlarged spleen, raised IgM levels, and the presence of malaria antigens are hallmarks of HMS, the condition is highly variable (65). The PbΔron6 mutant induces HGM and offers a model to investigate the pathological insights of the condition. Our preliminary studies revealed reduced numbers of B and T lymphocytes in spleens obtained from mice infected with PbΔron6 mutants. It is speculative if the excess hemozoin associated with hemosiderophages, as seen in this study, alters the expression of MHC class II, costimulatory, and adhesion molecules together with inhibition of dendritic cell maturation (66–68). This may explain why the parasites fail to get cleared in spite of their slow progression in mice.
Two independent studies employing conditional silencing of PfRON6 have shown their role in asexual propagation (62, 69), mirroring our current observations. In the first study, a knock-sideways approach was successfully used to inactivate PfRON6 within the ER through fusion of the KDEL-ER retrieval sequence (69). In a second study, an AVEXIS assay was employed to characterize the interactions of human and P. falciparum sporozoite proteins, involved in host cell invasion (62). This study reiterated the interaction of the C-terminus of PfRON6 with Pf34, which concurs with earlier demonstrations of their colocalization in the rhoptry neck (50). Interestingly, no interaction of Pf34 was noted with the N-terminal domain of PfRON6 (62). This coincides with our observation where the antisera raised against recombinant PbRON6^110–281^ showed intracellular localization around the nucleus, likely in the ER compartment (Fig. S4A through E).
An invasion and developmental defect associated with PbRON6 depletion was indeed a locus-specific effect, as complementation restored asexual propagation, pre-patency, and virulence. With the advancement in our understanding of the secretory pathways and invasion mechanisms of apicomplexan parasites, it is becoming increasingly clear that some components of the invasion machinery are conserved between erythrocytic and sporozoite stages. Given that rhoptry protein secretion critically regulates cell traversal, host cell invasion, PVM formation, and proliferation of parasites within the PV, targeting the secretory effectors may prevent malaria transmission at multiple life cycle stages. In line with this idea, we demonstrate the role of PbRON6 in the parasite invasion of RBC, hepatocytes, and its association with sporozoite and PV membranes. Thus, targeting PbRON6 may enhance the breadth of beating the parasite at multiple life cycle stages for efficient control of malaria.
MATERIALS AND METHODS
Experimental animals
Female Swiss albino, BALB/c, and C57BL/6 mice aged 6–8 weeks old were used. The animals were procured from the National Centre for Laboratory Animal Sciences, National Institute of Nutrition, Hyderabad, and Hylasco Bio-Technology (India) Pvt. Ltd., Hyderabad. The experimental animals were housed in a controlled environment at the animal facility of the University of Hyderabad. The animals were maintained at 22°C, with a relative humidity of 50–60%, and 12-h dark-light cycle. A standard diet as prescribed for rodents was provided ad libitum. All the animal protocols conducted in this study were approved by the Institutional Animal Ethics Committee of the University of Hyderabad.
Parasite lines
A rodent species of Plasmodium berghei ANKA (P. berghei), well adapted to the laboratory conditions, was used in this study. The WT P. berghei line is highly amenable to genetic modification and was used as a parental line to perform gene manipulations.
Bioinformatic analysis
A Plasmodium database, PlasmoDB (https://plasmodb.org/plasmo/app) was used to retrieve the gene and AA sequences. The retrieval of gene identities and orthologs for other Plasmodium species was also from the same database.
The gene and protein sequences of P. berghei ron6 (Pbron6, PBANKA_0311700), P. falciparum ron6 (Pfron6, PF3D7_0214900), and from other Plasmodium species were retrieved from PlasmoDB. PbRON6 and PfRON6 were analyzed using the Deep TMHMM tool (https://dtu.biolib.com/DeepTMHMM) to predict the transmembrane topology of RON6. Similarly, Phobius web server was used for predicting the cellular distribution of the protein (https://phobius.sbc.su.se/). Signal P-4.1 was used to identify signal peptide sequences (https://services.healthtech.dtu.dk/services/SignalP-4.1/). The sequence alignment of RON6 orthologs from Plasmodium species was performed using Clustal Omega (https://www.ebi.ac.uk/jdispatcher/msa/clustalo) to identify conserved motifs.
The expression analysis of Pbron6
Expression of Pbron6 across the life cycle stages was analyzed by qRT-PCR following absolute quantification. Total RNA was isolated from rings, trophozoites, schizonts, midgut sporozoites, SG sporozoites, and in vitro liver stages at 12, 24, 36, 48, and 60 h post-infection (hpi), and merosomes of P. berghei using Ambion PureLink RNA Mini Kit (Thermo Scientific, Cat #12183020) following the manufacturer’s instructions. Pbron6 gene-specific standards were generated by amplifying a 136 bp fragment that was ligated into a pTZ57R/T vector (Thermo Scientific, Cat #K1214). Similarly, a 154 bp product of Pbef1α ligated into the pTZ57R/T vector was used as an internal control. Primers used for qRT-PCR are shown in Table S1. Gene-specific standards were generated in log scale dilution of plasmid copy numbers ranging from 10^8^ to 10^2^. The RNA was subjected to DNase I treatment (NEB Cat #M0303S), and cDNA was synthesized from 2 µg of total RNA isolated from different stages of P. berghei using the PrimeScript 1st strand cDNA Synthesis Kit (Takara, Cat #61100A), following the manufacturer’s instructions. SYBR Green master mix (TAKARA TB Green Premix Ex TaqTM II Tli RNase H Plus, Cat #RR82R) was used for qRT-PCR. Real-time PCR was performed using Eppendorf RealPlex 2 (Cat #2894). Pbron6 absolute transcript numbers were quantified at the selected life cycle stages by qRT-PCR using gene-specific primers run along with the gene-specific standards and normalized with the absolute transcript numbers of Pbef1α.
Generation and genotyping of PbRON6 HA transgenic and mutant lines
To localize Pbron6 throughout the life cycle stages, a C-terminal hemagglutinin (3xHA) epitope-tagged Pbron6::3xHA line was generated. To achieve this, 455 bp 3′ part of Pbron6 orf eliminating the stop codon and 507 bp of Pbron6 3′ utr (un-translated region) were amplified from P. berghei genomic DNA using the primers P1/P2 and P3/P4, respectively (Fig. 2A; Fig. S2A; Table S1 for details of the primers). The amplified partial orf and 3′ utr were introduced into the XhoI/BglII and NotI/AscI restriction sites of pBC-3xHA-hDHFR plasmid (Fig. S2B) (70), respectively, to obtain the Pbron6::3xHA construct. Pbron6::3xHA plasmid contains hdhfr SM under the control of the constitutive Pbeef1a promoter. Pbron6::3xHA plasmid was linearized with restriction enzymes XhoI and AscI and transfected into P. berghei parasite line following standard transfection procedure (71). DNA-integrated parasites were selected by providing pyrimethamine in the drinking water of mice, resulting in the enrichment of the Pbron6::3xHA tagged line (Fig. 2A). The recombined locus having 3xHA in frame with Pbron6 orf was confirmed by Sanger sequencing (Fig. S2C) following PCR amplification using diagnostic primers P24/P11 (see Table S1 for details of the primers). The drug-resistant parasites were cloned by limiting dilution (72), and correct integration of the Pbron6::3xHA construct was confirmed by diagnostic PCR analysis from the genomic DNA of the cloned parasite lines (Fig. 2A). Details of the primers used for genotyping and expected PCR product sizes are listed in Table S1. Two clones that were generated from independent transfections were used for further analysis.
The Pbron6 deletion (PbΔron6) construct was generated using the plasmid pSKC-hDHFR::yFCU, which carries a hdhfr::yfcu positive-negative SM under a constitutive Pbeef1α promoter (39). The Pbron6 locus was targeted by the double-crossover homologous recombination method. To achieve this, the 5’ and 3’ untranslated regions (utrs) of Pbron6 were amplified from P. berghei genomic DNA using the primer pairs P5/P6 and P3/P7, respectively (see Table S1 for details of the primers) and introduced into XhoI/HindIII and NotI/AscI restriction sites, respectively, to obtain PbΔron6 construct. The PbΔron6 construct was linearized with XhoI and AscI restriction enzymes and transfected into P. berghei parasite line following the standard transfection procedure (71). DNA-integrated parasites were selected by providing pyrimethamine in the drinking water of mice, resulting in the enrichment of PbΔron6 line. The drug-resistant parasites were cloned by limiting dilution (72), and correct integration of the PbΔron6 construct was confirmed by diagnostic PCR analysis from genomic DNA of the cloned parasite lines (Fig. 6A). Details of the primers used for genotyping and expected PCR product sizes are listed in Table S1. Two clones that were generated from independent transfections were used for further analysis.
For complementation of the PbΔron6 locus, Pbron6 orf was amplified from P. berghei genomic DNA using the primer pairs P8/P9. Pbron6 orf was used to replace the hdhfr::yfcu cassette in PbΔron6 construct using the restriction sites HindIII/NotI. Pbron6 complementation construct was linearized with XhoI and AscI restriction enzymes and transfected into PbΔron6 parasite line following standard transfection procedure (71). The complemented parasites were subjected to negative selection by providing 5-FC in the drinking water of mice. The drug-resistant parasites were cloned by limiting dilution (72), and correct integration of the Pbron6 complementation construct was confirmed by diagnostic PCR analysis from genomic DNA of the cloned parasite lines (Fig. 6F). Details of the primers used for genotyping and expected PCR product sizes are listed in Table S1. Two clones generated from independent transfections were used for further analysis.
Analysis of the PbRON6 KO phenotype in the mixed blood stages
Cloned PbΔron6 lines were injected into mice to monitor their asexual propagation rate. Approximately 1 × 10^3^ PbΔron6 or WT parasites (control) were intravenously injected into five Swiss mice. The parasitemia was monitored by Giemsa-stained smears from day 3 of post-infection until day 8. The data was recorded from 25 fields/mouse on a daily basis, and the average percentage of parasitemia was calculated.
Transmission of Pbron6 mutant parasites to Anopheles stephensi
For mosquito transmission experiments, nearly 150–200 female Anopheles mosquitoes were fed on the anesthetized mice with circulating gametocytes of Pbron6 mutants or WT parasites. The infected mosquitoes were maintained at 21°C with relative humidity of 75–80% and were supplemented with 5% sucrose.
Analysis of oocyst development inside the mosquito
To study the phenotype of the Pbron6 mutants, infected mosquito mid-guts were manually dissected using a dissection microscope (Lawerence & Mayo, Cat #NSZ-606) on day 14 post-infection. The number of oocysts were quantified, and sporulation patterns inside the oocysts were observed. For quantification of the oocyst sporozoite load, the dissected mosquito midguts were collected in a 1.5 mL tube and manually disrupted using a plastic pestle to release sporozoites. The released sporozoites were counted using a hemocytometer.
Isolation of SG sporozoites
To isolate the SG sporozoites, the infected mosquitoes were dissected between days 18 and 21, post-infection. Mosquito SGs were manually dissected and collected in RPMI-1640 in a 1.5 mL tube. The SGs were disrupted using a plastic pestle, and the sporozoites were counted using a hemocytometer.
HepG2 cell cultures for assessing in vitro EEF development
To investigate the developmental progression of the Pbron6 mutant liver stages in vitro, parasite growth was assessed in HepG2 cells. Collagen-coated coverslips were seeded with HepG2 cells at a density of 1 × 10^5^ in a four-well plate (Thermo Scientific, Cat #144444), 1 day prior to the addition of sporozoites. On days 18–21 post-infection of mosquitoes, the Pbron6 mutant sporozoites were isolated and approximately 2 × 10^4^ sporozoites were added to HepG2 monolayers and incubated at 37°C in a CO_2_ incubator. Infected cultures were fixed at 12, 24, 48, 60, and 65 hpi with 4% paraformaldehyde (PFA) (Thermo Scientific, Cat #043368.9M). For producing axenic EEFs, sporozoites were added to cover slips placed in four-well plates containing DMEM (Gibco, Cat #11965-092) supplemented with 10% fetal bovine serum (Gibco, Cat #10270-106). Six hours post-addition of sporozoites, the cultures were fixed with 4% PFA and processed for indirect IFA.
IFA
The schizonts, gametocytes, midgut sporozoites, SG sporozoites, and developing in vitro liver stages (6, 12, 26, 36, 48, and 62 h) of Pbron6::3xHA line were fixed with 4% PFA, permeabilized with cold acetone and methanol (1:3), and washed with PBS. All samples were blocked with 3% BSA solution. For schizonts, gametocytes, midgut sporozoites, SG sporozoites, and EEFs at 36 hpi, primary antibody incubations were done with mouse anti-HA monoclonal antibody (Abcam, Cat #AB18181) at 1:100 dilution, along with respective stage-specific markers. The marker used for schizonts was rabbit anti-PIC5 antibody (Dey S et al., manuscript under preparation) at 1:100 dilution. Rabbit anti-SIMP (39) was used as a marker for gametocytes, midgut, and SG sporozoites at 1:100 dilution. Rabbit anti-UIS4 antibody (kind gift from P. Sinnis, JHU) was used as a marker for EEFs used at 1:1,000 dilution. Primary antibodies were removed after 1 h incubation, washed three times with PBS followed by incubation with Alexa Fluor 488-conjugated goat anti-mouse secondary antibody (Thermo Scientific, Cat #A11017) and Alexa Fluor 594-conjugated chicken anti-rabbit secondary antibody (Thermo Scientific, Cat #A21442) at 1:1,000 dilution. Nuclei were stained with DAPI (Sigma, Cat #D9564) along with secondary antibodies. 6 h axenic culture, in vitro liver stages at 12, 26, 36, 48, and 62 hpi, and merosomes were stained with rabbit anti-HA monoclonal (Abcam, Cat #AB236632), 3D11, or MSP1 antibodies. The anti-HA monoclonal antibody, 3D11 (73), and anti-MSP1 were used at 1:100, 1:1,000, and 1:5,000 dilutions, respectively. Primary antibodies were removed after 1 h incubation, washed three times with PBS. Immunoreactivity was revealed with Alexa Fluor 594-conjugated chicken anti-rabbit secondary antibody, and Alexa Fluor 488-conjugated goat anti-mouse secondary antibody at 1:1,000 dilution. Nuclei were stained with DAPI. The slides were mounted with a coverslip using ProLong Gold Anti-Fade Reagent (Thermo Scientific, Cat #P10144) and sealed with nail polish. The slides were visualized under a Nikon Eclipse upright fluorescence microscope, and images were captured using the NIS-Elements AR software.
To confirm the localization of PbRON6 on the surface of the sporozoite, an IFA was performed with and without permeabilization. As described previously, Pbron6::3XHA sporozoites were blocked with 3% BSA solution. Two commercially procured anti-HA antibodies, namely anti-HA rabbit monoclonal (Abcam, Cat #AB236632) and anti-HA rabbit polyclonal (Abcam, Cat #AB9110), were used for IFA at 1:100 dilution. The 3D11 monoclonal antibody (73) used at 1:1,000 dilution served as a marker for staining the sporozoite membrane. The immunoreactivity of 3D11 and HA was revealed with Alexa Fluor 488-conjugated goat anti-mouse and Alexa Fluor 594-conjugated chicken anti-rabbit secondary antibodies at 1:1,000 dilution, respectively. The immunoreactivity was visualized under a Nikon Eclipse upright fluorescence microscope, and images were acquired and analyzed using NIS-Elements AR software.
The development of PbΔron6 EEFs was studied in HepG2 cells on collagen-coated cover slips in a four-well plate as described above. Infected cultures were fixed at 12, 24, 48, 60, and 65 hpi with 4% PFA. The 12, 36, and 48 h EEFs were stained with anti-CSP mouse monoclonal (3D11) and rabbit anti-UIS4 antibody that stained the EEF and PVM, respectively. The immunoreactivity was revealed with Alexa Fluor 488-conjugated goat anti-mouse and Alexa Fluor 594-conjugated chicken anti-rabbit secondary antibodies at 1:1,000 dilution, respectively. The 60 and 65 h EEFs were stained with MSP1 mouse monoclonal and rabbit anti-UIS4 antibody that stained the hepatic merozoites and PVM, respectively. To reveal the immunoreactivity, Alexa Fluor 488-conjugated goat anti-mouse secondary antibody and Alexa Fluor 594-conjugated chicken anti-rabbit secondary antibody at 1:1,000 dilution were used. Nuclei were stained with DAPI, and coverslips were mounted using ProLong Gold Anti-Fade Reagent and sealed with nail polish. The slide was visualized under a Nikon Eclipse upright fluorescence microscope, and images were captured using the NIS-Elements AR software.
To analyze the fate of anti-HA or 3D11 antibody-treated PbRON6::3xHA transgenic sporozoites in the mouse macrophage (RAW) cell line, the cultures were fixed at 7 hpi. The sporozoites were stained with 3D11 (1:1,000 dilution), and macrophage endosomes were stained with rabbit anti-Rab5 antibody (1:100 dilution). Primary antibodies were removed after 1 h incubation, washed three times with PBS followed by incubation with Alexa Fluor 488-conjugated goat anti-mouse secondary antibody and Alexa Fluor 594-conjugated chicken anti-rabbit secondary antibody at 1:1,000 dilution. Nuclei were stained with DAPI. Coverslips were mounted using ProLong Gold Anti-Fade Reagent and sealed with nail polish. The slide was visualized under a Nikon Eclipse upright fluorescence microscope, and images were captured using the NIS-Elements AR software. The number of antibody-treated PbRON6::3xHA transgenic sporozoites present inside and outside the RAW cells was quantified.
To test the antisera raised against 110–281 AAs of PbRON6, an indirect IFA was performed using schizonts and free merozoites of the Pbron6::3xHA line. The schizont and free merozoites were fixed with 4% PFA, blocked with 3% BSA solution, and stained with anti-HA rabbit monoclonal antibody at 1:100 dilution and mouse antisera specific for rPbRON6^110–281^ at 1:100 dilution. The immunoreactivity was revealed using Alexa Fluor 488-conjugated goat anti-mouse secondary antibody and Alexa Fluor 594-conjugated chicken anti-rabbit secondary antibody at 1:1,000 dilution. Nuclei were stained with DAPI. To test the immunoreactivity of antisera raised against 110–281 AAs, sporozoites were fixed with 4% PFA, and staining was done under non-permeabilized and permeabilized conditions as mentioned above. Anti-SIMP antibody was used as a sporozoite-specific marker.
Quantification of PbRON6::3xHA levels in sporozoite membrane
To determine the levels of PbRON6 protein in sporozoite membrane, 3,000 freshly dissected PbRON6::3xHA transgenic sporozoites were added per well on a spotted slide (Fisher Scientific, Cat #9991090) and immediately fixed at room temperature, or alternatively, sporozoites were maintained at 37°C for 30 min in the presence or absence of HepG2 cells in a Nunc Lab-Tek II Chamber Slide (Thermo Scientific, Cat #154453). After incubation, cells were fixed with 4% PFA, followed by staining with 1:1,000 dilution of 3D11 and 1:100 dilution of anti-HA rabbit monoclonal antibody (Abcam, Cat #AB18181). The immunoreactivity of 3D11 and anti-HA antibody was revealed with Alexa Fluor 488-conjugated goat anti-mouse and Alexa Fluor 594-conjugated chicken anti-rabbit secondary antibodies used at 1:1,000 dilution, respectively. The sporozoites were visualized under a Nikon Eclipse upright fluorescent microscope. The intensity of 3xHA on the sporozoite membrane was quantified by using NIS Elements AR software.
Analysis of in vivo sporozoite infectivity of PbΔron6
To determine the in vivo infectivity of PbΔron6 sporozoites, two groups containing 6 and 7 C57BL/6 mice were exposed to either 5 × 10^3^ or 1 × 10^4^ mutant or WT sporozoites, by an intravenous route. The sporozoite infectivity was monitored by the Giemsa-stained tail blood smears for determining pre-patency, which is defined as the time required for the appearance of blood stage infection in mice following sporozoite exposure. A delay in pre-patency compared to WT was considered as reduced infectivity. Spleens were collected prior to terminally euthanizing the animals. Length and weight of the isolated spleens were measured, and the samples were used for histopathological analysis.
Sporozoite inside-out assay
To investigate the efficiency of hepatocyte invasion, 2 × 10^4^ PbΔron6 or WT sporozoites were added to HepG2 monolayers cultured on collagen (Corning, Cat #354236) coated coverslips, in a four-well plate. The cultures were incubated for 1 h at 37°C in a CO_2_ incubator, followed by fixing with 4% PFA. Sporozoite invasion was assessed by a dual staining method as described previously (48). Briefly, following non-specific blocking with 3% BSA, the extracellular sporozoites were first stained under non-permeabilized conditions with anti-CSP (3D11) monoclonal antibody, and immunoreactivity was revealed with anti-mouse Alexa Fluor 488-conjugated goat secondary antibody. In the next step, the cultures were permeabilized with a 1:3 ratio of cold acetone-methanol solution, followed by non-specific blocking. The permeabilized cultures were stained for a second time with 3D11 monoclonal antibody, and immunoreactivity was revealed using Alexa Fluor 594-conjugated goat anti-mouse secondary antibody (Thermo Scientific, Cat #A11032). Nuclei were stained with DAPI. The slide was mounted with a coverslip using ProLong Gold Anti-Fade Reagent and sealed with nail polish. The slide was visualized under a Nikon Eclipse upright fluorescent microscope, and images were captured and analyzed using the NIS-Elements AR software. The number of green and red sporozoites was scored from 20 random fields, which represented the extracellular and total sporozoites, respectively. The percentage of sporozoite invasion was assessed by the following formula:
Percentage invasion = ([Red parasites − Green parasites]/Red parasites) × 100
Exocytosis assay for PbRON6
To assess whether PbRON6 is secreted by sporozoites during exocytosis, approximately 5 × 10^4^ Pbron6::3xHA transgenic sporozoites adjusted to 20 µL of complete RPMI medium were incubated at 37°C for either 30 or 60 min. The sporozoite samples were centrifuged at 10,000 × g for 10 min at 4°C. Supernatants and pellets were collected separately, and the samples were denatured with Laemmli Sample Buffer, resolved on a 12% SDS-PAGE gel, and immunoblotted. CSP and RON6 levels were analyzed in the supernatant and the pellet fractions by probing with 3D11 and anti-HA rabbit polyclonal antibodies, respectively. The immunoreactivity was revealed using HRP-conjugated horse anti-mouse (Cell Signaling Technology, Cat #7076) and goat anti-rabbit secondary antibodies (Cell Signaling Technology, Cat #7074) in the presence of chemiluminescence reagent (G-Biosciences, ECL #786-003), and visualized using ChemiDoc Imaging System (Bio-Rad).
To analyze the sporozoite precipitin reaction in the presence of antibodies, 5 × 10^3^ Pbron6::3xHA transgenic sporozoites were incubated with either 3D11 or anti-HA rabbit monoclonal antibody for 30 min at 37°C. After incubation, the sporozoite suspension was placed on a microscope glass slide (Corning, Cat #2948) and visualized under a Nikon Eclipse upright fluorescent microscope, and images were captured using the NIS-Elements AR software.
Sporozoite in vivo invasion efficiency and estimation of parasite burden in the liver
Two groups of C57BL/6 mice (n = 9/group) were intravenously infected with 5 × 10^3^ sporozoites of PbΔron6 or WT P. berghei. Three animals from each group were sacrificed, and livers were isolated at 6, 12, and 48 hpi. Total RNA was isolated from infected livers using the guanidinium thiocyanate-phenol-chloroform extraction method (74). cDNA was generated from 2 µg of total RNA from each liver sample. qRT-PCR was performed, and the Ct values were determined for P. berghei 18S rRNA for livers isolated at 6 and 12 h and msp1 for the livers isolated at 48 hpi. Mouse gapdh was used to normalize the Ct values of parasite genes following 2^−ΔΔCt^ method. Table S1 shows the details of primers used for qRT-PCR.
RBC invasion assay
To quantify merozoite invasion of RBC, in vitro cultures of PbΔron6 mutant and WT P. berghei asexual stages were set up, and schizonts were enriched by density gradient centrifugation using Histodenz (Sigma, Cat #D2158). Twenty-five milliliters of overnight in vitro schizont culture was topped on 10 mL of 60% histodenz solution and centrifuged at 380 × g for 20 min without a break. The brown interphase of the schizonts was collected and washed two times with culture medium. The purified schizonts were quantified by using a hemocytometer, and nearly 10^9^ parasites of WT or PbΔron6 were injected into two groups of Swiss Albino mice (n = 5/group). To capture the early snapshots of merozoite invasion and propagation, blood smears were done at 6-h intervals till 48 h and parasitemia was determined by Giemsa staining.
Generation of antisera against PbRON6110–281
To generate antisera against PbRON6, nucleotide sequence encoding AAs 110–281 of Pbron6 was PCR amplified using the primers P35/P36 (See Table S1 for primer details) and cloned into EcoRI and HindIII restriction sites of pET21a vector (Millipore-Sigma, Cat #69740). The nucleotide sequence of ron6 in the plasmid was confirmed by Sanger sequencing and was transformed into Rosetta 2(DE3) competent cells (Millipore-Sigma, Cat #71397). Recombinant PbRON6 (rPbRON6) was induced with 0.7 mM IPTG at 37°C. Protein was affinity purified using Ni-NTA agarose beads (G Biosciences, Cat #786-1547) and eluted at 10 mM imidazole. Purified rPbRON6 was concentrated by dialysis, and the protein purity was assessed by 15% SDS-PAGE.
Seven female BALB/c mice (5–7 weeks old) were immunized with rPbRON6 with Freund’s complete adjuvant (Sigma, Cat #F5881). Ten days post-priming, four booster doses were given at every 14-day interval with rPbRON6 in Freund’s incomplete adjuvant (Sigma, Cat #F5506). Immune sera were collected 2 weeks after the final booster dose. The immune sera were used to perform an indirect IFA.
IP and LC/MS analysis
IP was performed using the Pierce crosslink IP kit (Thermo Scientific, Cat #26147) as per the manufacturer’s instructions. Briefly, PbRON6::3xHA transgenic schizonts were cultured overnight in vitro. Schizonts were purified using a 60% Histodenz gradient as described earlier. Parasites were lysed with 0.15% saponin (Sigma, Cat #47036), and the sample for immuno-precipitation was prepared in IP lysis buffer. Rabbit monoclonal anti-HA antibody was cross-linked to protein A/G plus agarose beads and subsequently incubated with parasite lysate (>1 mg) overnight at 4°C. After overnight incubation, the protein A/G beads were washed with IP lysis buffer, and the proteins bound to the beads were eluted in elution buffer (Tris-glycine, pH 2.8) provided with the kit. Rabbit IgG was used as a control for pulldown. The successful immune precipitation was confirmed by Western blot using anti-HA rabbit monoclonal antibody.
For LC/MS analysis, the proteins present in the elution fraction after IP were digested by in-solution trypsin digestion. The samples were reduced using 20 mM DTT followed by treatment with 40 mM iodoacetamide at room temperature in the dark. For in-solution trypsin digestion, a 1:50 (wt/wt) trypsin to protein ratio was used. Proteins in each elution sample were digested by trypsin (New England Biolabs, Cat #P8101S) and incubated at 37°C for 16 h with shaking. After trypsin digestion, the sample was acidified with formic acid to a final concentration of 0.1% (Thermo Scientific, Cat #28905). The acidified peptides were desalted using Pierce C-18 spin column (Thermo Scientific, Cat #89870). Briefly, the C18 columns were activated with 1 mL of 2× acetonitrile (ACN) (Merck, Cat #AX0156) prepared in LC-MS grade water. The columns were equilibrated in 0.5% trifluoroacetic acid (TFA) (Merck, Cat #80457) and 0.5% acetonitrile solution. The acidified peptides were bound to the equilibrated columns and washed twice with 1 mL of 0.5% ACN and 0.5% TFA solution. The peptide elution was done in 50 µL of elution buffer (70% ACN and 0.1% TFA) in LC-MS grade water (Thermo Scientific, Cat #W6212). The eluted peptide samples were dried in a SpeedVac vacuum concentrator and stored at −80^ο^C till further use.
The LC/MS analysis was executed on an Orbitrap Q-Exactive HF mass spectrometer, coupled with a Nano LC 1000 instrument (Thermo Fisher Scientific, USA), supported with Thermo Scientific Xcalibur software. The eluted peptides were reconstituted with 0.1% formic acid, and approximately 2 µg of peptide sample was resolved on a PepMap RSLC C18 column (2 µm particle size, 100 Å pore size, and 75 µm × 50 cm). The raw data files from Orbitrap Q-Exactive HF were acquired on Proteome Discoverer, version 2.2, using the SEQUEST algorithm. The predicted peptides were searched against the UniProt database of P. berghei. The data were normalized with peptides detected in control IgG IP. The GO term analysis was carried out via PlasmoDB GO term analysis tool. The data were clustered according to the fold enrichment, and the number of proteins involved in a particular pathway was detected in IP/MS results.
Tissue sectioning for analysis of histopathological changes
The isolated spleen tissues were frozen, and optimal cutting temperature compound (OCT compound, Scigen, Cat #23-730-625) was used to embed tissue samples prior to sectioning on a cryostat. The block was incubated at −80°C for 2–3 h, and the cryostat (LEICA CM 1850 UV-1-1) temperature was adjusted to −20°C. After the 3-hour incubation, the block was placed on the chuck associated with the rotatory microtome, and 2 mm thick sections were sliced and transferred onto positively charged microscopy slides (PathnSitu Biotechnologies, Cat #PS-011-72).
Hematoxylin and eosin staining (H&E staining)
Prior to H&E staining, the sections were deparaffinized by immersing the slide in xylene solution (Sigma, Cat #296333) for 5 min. The sections were dehydrated sequentially using 100%, 90%, 70%, 50%, and 30% alcohol, each for 10 min, followed by an additional wash with double distilled water for 5 min. The tissue sections were incubated with hematoxylin (Sigma, Cat #H9627) for 20 min. The sections were washed with double-distilled water for 10 min followed by treatment with 1% eosin (Sigma, Cat #E4009) for 5 min, and finally washed with double-distilled water for 2 min. Sections were rehydrated sequentially using 30%, 50%, 70%, and 90% alcohol for 5 min each, and cleared with xylene for 5 min. The sections were dried by gently pressing on filter paper and mounted with DPX (Sigma, Cat #100579).
Flow cytometry of splenocytes
Spleens were isolated from WT infected, PbΔron6 infected, and age-matched uninfected C57BL/6 mice (n = 5 per group). Splenocyte suspensions were obtained by crushing the spleens between two clean glass slides, and the suspension was passed through a 70 µm cell strainer (SPL Lifesciences, Cat #93070). The single-cell suspensions were centrifuged at 1,500 rpm for 3 min at 4°C. The pellets were washed with sterile PBS. A hemocytometer was used to observe cell viability following trypan blue staining, and viable cells were quantified. For flow cytometry analysis, 2 × 10⁶ cells were resuspended in 100 µL FACS buffer (BD Biosciences, Cat #554657) in a 1.5 mL microcentrifuge tube and stained with 1 µL each of anti-mouse CD3-FITC (BD Biosciences, Cat #553081) and anti-mouse CD20-PE (BD Biosciences, Cat #567250). Samples were incubated for 45 mins on ice and centrifuged at 1,500 rpm for 3 min at 4°C. The cells were then washed with PBS, centrifuged again, and the pellet was resuspended in 200 µL FACS buffer for analysis. The lymphocyte data were acquired by flow cytometry (LSR Fortessa, BD Biosciences, USA), and the cells were gated broadly on FSC-A Vs SSC-A and analyzed using FlowJo software (https://www.flowjo.com, FlowJo Version 10.8.1).
Statistical analysis
GraphPad Prism v9.0 and above was used for statistical analysis. Normality was tested for all data using the Shapiro-Wilk test and Anderson-Darling test before analysis. Statistical analyses were performed using Mantel-Cox tests for survival analysis, Mann-Whitney test for extracellular sporozoite counting in Raw cell line, for measuring EEF area at 36 and 65 h post-infection, for measuring number of hepatic merozoites at 60 h post-infection, and for determining percentage frequency of larger EEFs at 65 h post infection. An unpaired t-test was used to calculate the statistical differences for the sporozoite inside-out assay and for the quantification of Pb18S rRNA and MSP1 from infected mice livers. One-way ANOVA with Tukey’s multiple comparison test was performed to determine the significance for blood stage propagation of WT and PbΔron6 mutant parasites in mice, for quantification of midgut and SG sporozoites and also for the assessment of spleen weights from mice infected with WT and PbΔron6 mutant sporozoites, and Dunnett’s multiple comparison test for blood stage propagation of WT and Pbron6 complemented parasites in mice. Kruskal-Wallis test with Dunn’s multiple comparisons test was used for the assessment of spleen lengths from mice infected with WT and PbΔron6 mutant sporozoites. One-way ANOVA with Holm-Šídák’s multiple comparisons test was performed to determine statistical significance for oocyst burden in mosquitoes.
The reference list from the paper itself. Each links out to its DOI / PubMed record.
- 1WHO. 2023. World malaria report
- 2Amino R, Thiberge S, Martin B, Celli S, Shorte S, Frischknecht F, Ménard R. 2006. Quantitative imaging of Plasmodium transmission from mosquito to mammal. Nat Med 12:220–224. doi:10.1038/nm 135016429144 · doi ↗ · pubmed ↗
- 3Kappe SHI, Kaiser K, Matuschewski K. 2003. The Plasmodium sporozoite journey: a rite of passage. Trends Parasitol 19:135–143. doi:10.1016/s 1471-4922(03)00007-212643997 · doi ↗ · pubmed ↗
- 4Prudêncio M, Rodriguez A, Mota MM. 2006. The silent path to thousands of merozoites: the Plasmodium liver stage. Nat Rev Microbiol 4:849–856. doi:10.1038/nrmicro 152917041632 · doi ↗ · pubmed ↗
- 5Sturm A, Amino R, van de Sand C, Regen T, Retzlaff S, Rennenberg A, Krueger A, Pollok J-M, Menard R, Heussler VT. 2006. Manipulation of host hepatocytes by the malaria parasite for delivery into liver sinusoids. Science 313:1287–1290. doi:10.1126/science.112972016888102 · doi ↗ · pubmed ↗
- 6Aly ASI, Vaughan AM, Kappe SHI. 2009. Malaria parasite development in the mosquito and infection of the mammalian host. Annu Rev Microbiol 63:195–221. doi:10.1146/annurev.micro.091208.07340319575563 PMC 2841446 · doi ↗ · pubmed ↗
- 7Ngô HM, Hoppe HC, Joiner KA. 2000. Differential sorting and post-secretory targeting of proteins in parasitic invasion. Trends Cell Biol 10:67–72. doi:10.1016/s 0962-8924(99)01698-010652517 · doi ↗ · pubmed ↗
- 8Arredondo SA, Schepis A, Reynolds L, Kappe SHI. 2021. Secretory organelle function in the plasmodium sporozoite. Trends Parasitol 37:651–663. doi:10.1016/j.pt.2021.01.00833589364 · doi ↗ · pubmed ↗