Sex-specific machine learning classification models improve outcome prediction for abdominal aortic aneurysms
Katherine E. Kerr, Indrani Sen, Pete H. Gueldner, Tiziano Tallarita, Joseph C. Wildenberg, Nathan L. Liang, David A. Vorp, Timothy K. Chung

TL;DR
This study shows that machine learning models tailored to male and female patients separately predict abdominal aortic aneurysm outcomes better than general models, addressing gender disparities in medical predictions.
Contribution
The novelty lies in demonstrating that sex-specific ML models improve outcome prediction for abdominal aortic aneurysms compared to a general model.
Findings
Sex-specific ML models outperformed general models in predicting patient outcomes for abdominal aortic aneurysms.
Equalizing sample sizes improved predictions for female patients without reducing model performance for males.
Sex-specific models revealed differences in feature importance, suggesting the need for sex-based grouping in ML models for AAA prediction.
Abstract
Abdominal aortic aneurysm (AAA) is an abnormal dilation of the abdominal aorta that carries up to a 90% mortality rate when ruptured. Although male patients experience AAA at a higher rate than females, female patients experience AAA rupture at a rate three- to four-fold higher that of their male counterparts. The current standard clinicians use for determining when to surgically intervene is maximum transverse diameter of the AAA perpendicular to the axis of flow. However, some aneurysms below these diameter thresholds rupture. Machine learning (ML) classification models have been previously shown to predict patient outcomes with more discriminability than the diameter criterion. However, these models do not consider sex-based differences. In this proof-of-concept study, we investigate how creating sex-specific ML models impacts patient outcome prediction as compared to a general model…
Genes, proteins, chemicals, diseases, species, mutations and cell lines named across the full text — each resolved to its canonical identifier and authoritative record.
Click any figure to enlarge with its caption.
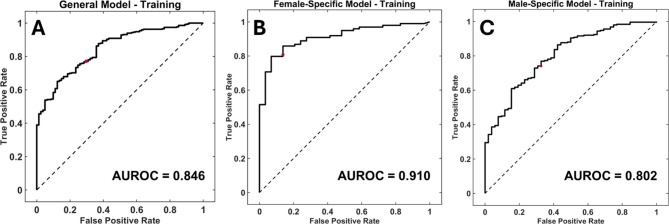 Figure 1
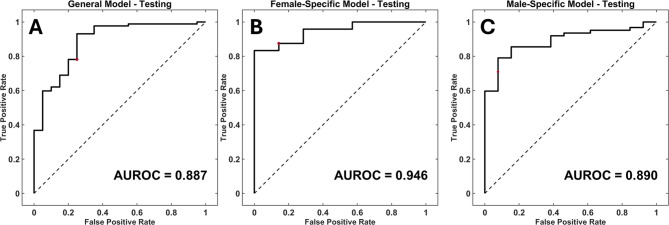 Figure 2
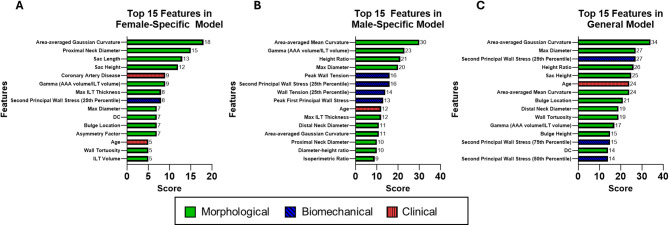 Figure 3
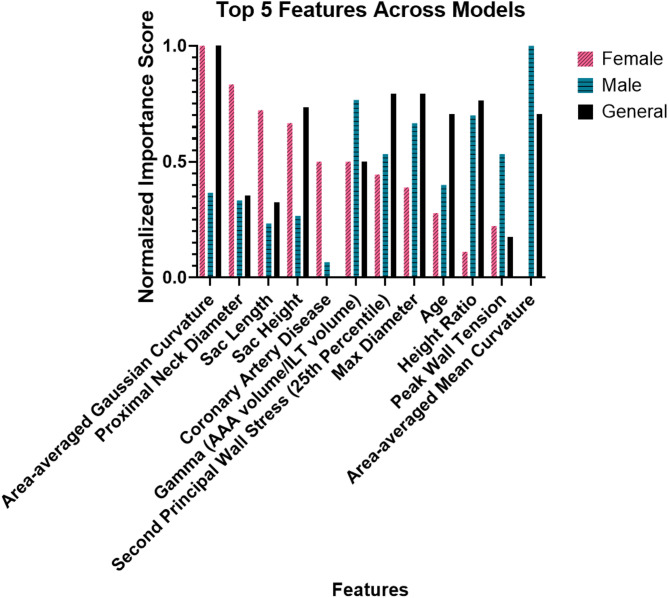 Figure 4
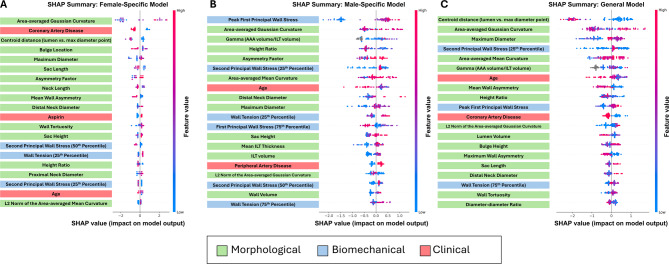 Figure 5
- —International Society of Women Vascular Surgeons
- —https://doi.org/10.13039/100023581National Science Foundation Graduate Research Fellowship Program
- —https://doi.org/10.13039/100000070National Institute of Biomedical Imaging and Bioengineering
- —https://doi.org/10.13039/100000968American Heart Association
- —Pittsburgh Health Data Alliance
- —Institute for Precision Medicine - University of Pittsburgh
- —University of Pittsburgh Chancellor's Gap Fund
- —University of Pittsburgh's Clinical and Translational Science Institute University of Pittsburgh Innovation Challenge
- —https://doi.org/10.13039/100000050National Heart, Lung, and Blood Institute
- —NVIDIA Academic Hardware Grant
- —https://doi.org/10.13039/100010379Jewish Healthcare Foundation
Peer Reviews
No public reviews on file for this paper yet. If you reviewed it on a platform where reviews are public (OpenReview, ICLR, NeurIPS, ICML), you can paste yours below so the community can read it here.
Videos
No videos yet. Explain this paper in a talk, walkthrough, or lecture? Add one.
Taxonomy
TopicsAortic aneurysm repair treatments · Aortic Disease and Treatment Approaches · Connective tissue disorders research
Introduction
Abdominal aortic aneurysm (AAA) is an abnormal focal dilation of the infrarenal aorta to at least 50% of its normal size. Rupture of AAA can be devastating as it carries a mortality rate of up to 90% [1, 2]. Although men experience a higher prevalence of AAA [3], women experience higher AAA rupture rates, with literature reporting a rupture rate 3 to 4 times higher for females than that of males [1, 4–6]. It has also been reported that female patients experience higher growth rates [7] as well as experience AAA rupture at smaller diameters [8]. Additionally, female patients who have undergone surgical repair for their AAA experience longer intensive care unit stays after intervention, higher surgical and postoperative mortality, and higher 5-year endovascular repair mortality and reintervention rates [9–11].
Due to its associated high mortality rate, it is important to accurately determine which patients are at risk of AAA rupture. Currently, clinicians primarily rely on the maximum transverse diameter of the AAA, with the current recommendations for surgical intervention being 5.0 cm for female patients and 5.5 cm for male patients [12]. However, studies have previously reported that between 7 and 23.4% of aneurysms between 4.1 and 5.5 cm rupture [13–15]. Additionally, it has been previously shown that diameter predicts AAA rupture with an accuracy of 73% [16].
The shortcomings of AAA maximum transverse diameter as a diagnostic criterion have led to investigation into multiple biomechanical and morphological indices to predict AAA outcome. Peak wall stress was previously proposed as a predictor of AAA outcome (stable vs. surgical intervention) [16], however heterogeneity in wall strength both within a given aneurysm and between patients make using peak wall stress alone to predict outcome unreliable [14]. Morphological indices such as the aortic size index (the ratio of patient AAA diameter to patient body surface area) [17] have shown improved outcome prediction potential for female patients [18], but is not a better predictor than diameter in all cases [19]. The ratio of locally acting wall stress to strength, or rupture potential index (RPI) [20], showed promise in predicting AAA outcome [16, 20–22] but clinical adoption was limited due to the time and expertise required to perform reconstructions and finite element stress analyses. Using automated image-based analyses to acquire biomechanical and morphological parameters no longer requires time intensive segmentation, however, making clinical adoption more feasible.
Machine learning (ML) classification models have shown promise in predicting AAA outcomes [23, 24]. Previous work from our group has demonstrated that ML models incorporating clinical, morphological, and biomechanical factors outperform diameter alone in discriminability of AAA outcomes [24]. However, these models did not account for any sex-based factors in their predictions, such as the natural overrepresentation in the number of male patients in AAA datasets due to higher AAA prevalence rates among male patients compared to female patients.
In this work, we create sex-based ML models and compare their ability to predict outcomes to a general model agnostic of sex. This includes training models exclusively using data from female or male patients as well as equalizing the sample sizes of male and female patients. We then explore how incorporation of these sex-based differences impacts patient-specific prediction of AAA outcomes.
Methods
Data acquisition
Data were acquired from patients seen at the University of Pittsburgh Medical Center (UPMC) and the Mayo Clinic Health System. AAA patients were identified using international classification of disease (ICD) 9/10 and current procedural terminology (CPT) codes with chart review to confirm diagnosis. Patients from UPMC were obtained from a retrospective database from the Health Record Research Request, a service of the University of Pittsburgh Department of Bioinformatics in partnership with UPMC, for cases between 2004 and 2019. Deidentified patient computed tomography (CT) images within the Mayo Health system between 2021 and 2023 were extracted and delivered through a data use agreement #DUA00004445 to the University of Pittsburgh for analysis. This proof-of-concept study consisted of a total of 537 patients, of which 159 (29.6%) were female and 378 (70.3%) were male. Patients had CT scans over a duration of 5.69 ± 3.37 years. AAAs that were in the “repair” or “rupture” groups either were deemed at risk of rupture and underwent interventional repair or experienced rupture, respectively, within their follow-up duration. All others were put in the “stable” group, meaning that they did not result in repair or rupture within their follow up timeframe. The male cohort included 313 stable patients, 55 repair, and 10 rupture. The female patient groups consisted of 123 stable patients, 31 repair, and 5 rupture. To mitigate the class imbalance between the repair and the rupture group compared to the stable group, we pooled the repair and rupture groups together into one “unstable” group per sex (65 male, 36 female).
Image segmentation, reconstruction, and morphological analysis
Our image segmentation pipeline has been previously published [24–26]. Briefly, Digital Imaging and Communications in Medicine (DICOM) image stacks were automatically segmented using a U-NET image classifier. This U-NET image classifier was previously trained by our group using Amazon Web Service’s (Amazon, Seattle, WA, USA) Elastic Compute Cloud [25]. Semi-automatic methods were utilized for image sets that failed to be segmented using automatic methods. A binary mask was created for the wall, lumen, and intraluminal thrombus (ILT) regions from the segmented image. A point cloud was then created of each axial slice and the original spacing of the CT image was registered and scaled. The point cloud was then converted into a mesh using Poisson 3D surface reconstruction [24, 27]. From there, post-processing including smoothing of the meshes was performed before morphological analysis was completed [24, 26].
Morphological indices were extracted using a previously described custom in-house MATLAB (MathWorks Inc., Natick, MA, USA) script (one-, two-, three-, and higher dimensional indices) [24, 26]. A table of morphological indices that were extracted has been previously published [24].
Biomechanical analysis
The stress analysis performed used a well-established computational pipeline to automatically assign material properties to the AAA wall and any intraluminal thrombus (ILT) that was present [24, 26]. Briefly, the wall stress analysis was performed by constraining the proximal and distal boundaries of the AAA and pressurizing to an ideal systolic pressure of 120 mmHg. A uniform wall thickness of 1.9 mm was assumed [24]. Models previously validated for ILT (hyperelastic and isotropic) [28, 29] and AAA wall (hyperelastic and anisotropic) [30] were utilized. After performing the simulation in Abaqus Standard (implicit mode) (ABAQUS Inc., Providence, Rhode Island, United States), the mean and peak von Mises wall stresses were calculated from the isolated aneurysm sac regions [26].
Statistical tests
Clinical, biomechanical, and morphological data were checked for normality using the Kolmogorov–Smirnov test. The only normal dataset was the age at outcome, so age was therefore compared using a two-tailed t-test. As all other data were not normal, statistical comparisons of various clinical, biomechanical, and morphological indices between female and male cohorts were performed using a two-tailed Mann-Whitney non-parametric test. Clinical variables with binary outcomes were compared between female and male groups using a Fisher’s exact test.
Machine learning models
The dataset was split 80%−20% randomly a priori, controlling for stable and unstable cases, to use 20% for holdout testing. The dataset was split 5 separate times to control whether data splitting had any impact on model performance (i.e., to investigate the dataset stability). A ML classification model was trained in MATLAB as well as in Python using XGBoost. Based on the imbalance between the number of stable and unstable cases in the cohort, an ensemble boosted model (Random Under Sampling (RUS) Boost) was used. A “general” model was trained using all patients in the cohort (both sexes) while the sex-specific models were trained using “female” and “male” data separately. The performance of female patients and male patients in the general model was found by extracting the results of female and male patients separately from the general model. Receiver operating characteristic (ROC) curves and confusion matrices were used to visualize the model’s ability to predict unstable vs. stable AAA cases. Feature importance between the models was compared using Gini feature importance within XGBoost. Feature importance values are normalized to all values within a specific model. Each value represents the amount of node impurity that is reduced within a tree based on a given parameter. For further local and global explainability, Shapley Additive Explanations (SHAP) values were created for each model [31]. SHAP values are calculated for all clinical, biomechanical, and morphological indices based on the relative impacton individual predictions compared to all other features [32]. Additionally, a model was trained and tested with an equal number of female and male patients that were matched based on diameter and compared to the general model results.
Results
Comparisons of clinical, morphological, and biomechanical parameters
There were no significant differences in clinical indices between male and female patients (Table 1A). The race of two male patients was missing from the dataset and is therefore not included in the table. However, we did see significant differences in some morphological parameter values, including lumen and wall surface area, maximum diameter, and both the mean and maximum values for both lumen and wall asymmetry being lower in females vs. males (Table 1B). Female patients also had lower mean and peak wall stress, as well as lower mean and peak tension, compared with male patients (see Table 1C).
Model training results for general and sex-specific models
Models were trained 5 separate times on 5 different splits of the dataset to ensure the split of the data was not skewing results. The general, female-specific, and male-specific accuracies and area under the ROC curve (AUROC) (Fig. 1) can be seen in Table 2. All accuracies and AUROC values for the training set were above 66.3% and 0.715, respectively. We chose to proceed with testing our models based on these results.
Fig. 1. Model Training Receiver-Operating Characteristic Curves. Receiver-operating characteristic (ROC) curves for the model training dataset. (A) General model (a sex-agnostic model including all patients) training ROC with an area under the ROC curve (AUROC) value of 0.846. (B) Female-specific model training ROC with an AUROC value of 0.910. (C) Male-specific model training ROC with an AUROC value of 0.802
Table 1. Clinical, Morphological, and Biomechanical dataFemale(n = 159)Male(n = 378)P value A. Clinical Data Age at Diagnosis (years)69.43 ± 10.4969.85 ± 8.730.97 Age at Event (years)74.70 ± 9.7075.58 ± 8.920.31 Time to Outcome or Follow Up (years)5.58 ± 3.405.73 ± 3.290.64 Chronic Kidney Disease37.11% (n = 59)35.19% (n = 133)0.69 Coronary Artery Disease62.26% (n = 99)69.84% (n = 264)0.11 Diabetes35.22% (n = 56)39.95% (n = 151)0.33 Hyperlipidemia78.62% (n = 125)80.16% (n = 303)0.72 Hypertension90.57% (n = 144)90.48% (n = 342)1.00 Peripheral Artery Disease41.51% (n = 66)46.56% (n = 176)0.30 Race (n = 159 female, n = 376 male, 2 males with race unavailable)White (n = 491)89.31% (n = 142)92.82% (n = 349)0.22Black (n = 42)10.06% (n = 16)6.91% (n = 26)Asian (n = 1)0.00% (n = 0)0.27% (n = 1)Hispanic (n = 1)0.63% (n = 1)0.00% (n = 0) Aspirin62.89% (n = 100)61.38% (n = 232)0.77 Plavix36.00% (n = 54, 150 total)38.36% (n = 145)0.69 Statin47.80% (n = 76)55.56% (n = 210)0.11 B. Morphological Data Max Diameter (cm)4.36 ± 1.594.80 ± 1.25< 0.001 Max Intraluminal Thrombus Thickness (mm)14.68 ± 13.0717.31 ± 13.000.029 Lumen Surface Area (cm^2^)77.75 ± 30.8292.06 ± 30.93< 0.001 Wall Surface Area (cm^2^)104.64 ± 50.53120.42 ± 47.37< 0.001 Max Lumen Asymmetry47.00 ± 46.8858.47 ± 53.050.019 Max Wall Asymmetry44.88 ± 46.9658.73 ± 52.580.003 Mean Lumen Asymmetry24.64 ± 23.9930.14 ± 26.730.046 Mean Wall Asymmetry23.85 ± 24.0030.37 ± 26.420.009 Lumen Volume (ml)36.87 ± 24.9747.31 ± 28.61< 0.001 Wall Volume (ml)66.41 ± 56.5378.70 ± 58.12< 0.001 Neck Height (cm)5.66 ± 3.006.27 ± 3.290.044 Sac Height (cm)18.95 ± 5.0220.99 ± 5.07< 0.001 C. Biomechanical Data Mean Wall Stress (N/cm^2^)8.71 ± 2.9510.00 ± 2.83< 0.001 Peak Wall Stress (N/cm^2^)17.47 ± 6.3320.65 ± 6.43< 0.001 Peak Wall Tension (N/cm)26.54 ± 12.0030.56 ± 11.70< 0.001 Mean Wall Tension (N/cm)12.93 ± 4.8714.62 ± 4.83< 0.001Comparisons of selected model metrics between female and male patients (A) Clinical data for the cohort striated by female and male patients. The race of two male patients was not included in the clinical data and is not represented in this table. (B) Morphological data for the cohort striated by female and male patients. (C) Mean and peak wall tensions and wall stresses for female and male patients
Table 2. Model training resultsGeneralFemale-SpecificMale-SpecificAUROCAccuracyAUROCAccuracyAUROCAccuracy0.81074.2%0.84781.2%0.76067.7%0.84675.8%0.91082.0%0.71566.3%0.82475.3%0.88780.5%0.78271.9%0.79472.8%0.86879.7%0.76569.0%0.79872.8%0.83178.9%0.80272.9%Model training results for the general (a sex-agnostic model including all patients), female-specific, and male-specific model. Area under the ROC curve (AUROC) and accuracy are provided for five different splits of the dataset
Model testing results for general and sex-specific models
Each model was tested using a holdout dataset consisting of 20% of the cohort for each separate model. The AUROCs and accuracies are reported in Table 3; Fig. 2. The female-specific model outperformed the female patients in the general model with a maximum AUROC of 0.946 and an accompanying accuracy of 87.1% compared to a maximum AUROC of 0.838 and an accompanying accuracy of 86.2%. The male-specific model (maximum AUROC 0.890, accompanying accuracy 80.0%) also had a higher AUROC and accuracy than the male patients in the general model (maximum AUROC 0.775, accompanying accuracy 73.6%).
Table 3. Testing results for general and Sex-Specific modelsGeneral ModelFemale-Specific ModelMale-Specific ModelGeneral Model – Female PatientsGeneral Model – Male PatientsAUROCAccuracyAUROCAccuracyAUROCAccuracyAUROCAccuracyAUROCAccuracy0.88777.6%0.94687.1%0.89074.7%0.81785.3%0.69565.8%0.87878.5%0.88787.1%0.83980.0%0.83886.2%0.69871.8%0.87172.0%0.86083.9%0.82374.7%0.79488.6%0.77573.6%0.84077.6%0.82777.4%0.80968.0%0.80081.1%0.74575.7%0.81675.7%0.82174.2%0.75066.7%0.76086.7%0.68774.0%Model testing results for the general (a sex-agnostic model including all patients), female-specific, and male-specific model as well as the female and male patients within the general model. AUROC and accuracy are provided for five different splits of the dataset
Fig. 2. Model Testing Receiver-Operating Characteristic Curves. Receiver-operating characteristic (ROC) curves for the model testing dataset. (A) General model training ROC with an area under the ROC curve (AUROC) value of 0.887. (B) Female-specific model training ROC with an AUROC value of 0.946. (C) Male-specific model training ROC with an AUROC value of 0.890
Gini feature importance
Gini feature importance for the top 15 most important input parameters in terms of impact on the model’s prediction of stable vs. unstable AAA can be seen in Fig. 3A and C. For both the general and female-specific model, area-averaged Gaussian curvature was the top metric, while area-averaged mean curvature was the top metric for the male-specific model. Biomechanical predictors were more prevalent in the top 15 for both the male-specific and general model, with 4 and 3 out of the top 15 most important features being biomechanical predictors for the male and general model respectively, compared to only 1 biomechanical variable out of the top 15 for the female-specific model. The female-specific model included 2 clinical variables (age and coronary artery disease) compared to only 1 clinical variable (age) in the top 15 features in the male-specific and general model. A comparison of the top 5 features for each model can be found in Fig. 4.
Fig. 3. Feature Importance – Gini Feature Importance.The top 15 features for each model using Gini feature importance (A) Gini feature importance for the female-specific model. One out of the top 15 features was biomechanical (second principal wall stress (25th percentile)) and two were clinical (coronary artery disease and age). (B) Gini feature importance for the male-specific model. Four out of the top 15 features were biomechanical (peak wall tension, second principal wall stress (25th percentile), wall tension (25th percentile), peak first principal wall stress) and one was clinical (age). (C) Gini feature importance for the general model. Three out of the top 15 features were biomechanical (second principal wall stress (25th percentile), second principal wall stress (50th percentile), second principal wall stress (75th percentile)) and one was clinical (age)
Fig. 4. Comparing Feature Importance Across Models. A comparison of the top 5 features for the female-specific, male-specific, and general models. Feature importance values were normalized to the highest score for each model
SHAP values
A beehive plot of the SHAP values for the top 20 features in each model can be seen in Fig. 5A and C, ranked top to bottom by impact on the model. Similar to the Gini feature importance, the female-specific model placed the most importance on morphological parameters, with the area-averaged Gaussian curvature being the top metric. The male model had a biomechanical parameter as its top metric, with peak first principal wall stress having the largest SHAP values. For the general model, the most importance was the centroid distance followed by the area-averaged Gaussian curvature. Biomechanical parameters played the largest role in the male-specific model, with six of the top 20 indices, compared to three for both the general and female-specific models.
Fig. 5SHAP values for each model. The top 20 indices for each model using SHAP values (A) SHAP values for the female-specific model. Three out of the top 20 features were biomechanical (second principal wall stress (25th percentile), wall tension (25th percentile), and second principal wall stress (50th percentile)) and three were clinical (coronary artery disease, aspirin, and age). (B) SHAP values for the male-specific model. Six out of the top 20 features were biomechanical (peak first principal wall stress, second principal wall stress (25th percentile), wall tension (25th percentile), first principal wall stress (75th percentile), second principal wall stress (50th percentile), wall tension (25th percentile)) and two were clinical (age and peripheral artery disease). (C) SHAP values for the general model. Three out of the top 15 features were biomechanical (second principal wall stress (25th percentile), peak first principal wall stress, wall tension (75th percentile)) and two were clinical (age and coronary artery disease)
Equal sample sizes for female and male patients
Since one cause of decreased general model performance for female patients may be decreased representation due to higher prevalence of AAA in male patients, we created a model with equal sample sizes between male and female patients (Table 4). Male patients were diameter-matched to female patients to create the cohorts. The general model with equal sample sizes showed no notable differences from the general model including all patients. Female patients in the general model had lower AUROC and accuracies than the female patients in the general model with equal sample sizes. Male patients in the general model had similar accuracies and slightly lower AUROCs than the male patients in the general model with equal sample sizes.
Table 4. Testing results for the general model vs. the model with equal sample sizesGeneral ModelEqual Sample Sizes ModelGeneral Model – Female PatientsEqual Sample Sizes - FemaleGeneral Model – Male PatientsEqual Sample Sizes - MaleAUROCAccuracyAUROCAccuracyAUROCAccuracyAUROCAccuracyAUROCAccuracyAUROCAccuracy0.88777.6%0.90085.70%0.83385.7%0.89692.1%0.75884.4%0.78384.0%0.87878.5%0.88274.60%0.73779.4%0.81085.7%0.66380.8%0.74478.8%0.87172.0%0.87187.30%0.73078.4%0.79286.8%0.61780.6%0.69780.0%0.84177.6%0.86677.80%0.64080.0%0.72677.8%0.60075.6%0.66770.4%0.81675.7%0.86674.60%0.40775.9%0.67576.7%0.58378.6%0.66765.7%Model testing results for a model with equal sample sizes compared to the general model (a sex-agnostic model including all patients) as well as the female and male patients within the general model. AUROC and accuracy are provided for five different splits of the dataset
Discussion
The maximum AAA diameter is the currently accepted criterion clinicians use for deciding whether to surgically intervene in AAAs to prevent rupture. However, this one-size-fits-all, one-dimensional metric does not always accurately predict which AAAs are likely to rupture, particularly for female patients. ML models have shown promise in predicting AAA outcomes with more discernability than the maximum diameter [24]. In this work, we used data from two different medical centers to explore different methods to address the disparity in outcome prediction between age-matched male and female AAA patients using ML classification models. This was achieved by creating sex-specific models for female and male patients and by equalizing the sample sizes between the groups. The output of these models was compared to that of a general ML model, constructed using patients of both sexes. Female patients had lower mean and peak wall stresses, smaller maximum diameters and maximum intraluminal thrombus thicknesses, and more symmetric lumens and walls.
It has been shown in literature that maximum transverse diameter, the currently accepted clinical means to predict AAA risk of rupture, has an accuracy of 73% and an AUROC of 0.741^16^. For this cohort, the accuracy of maximum transverse diameter alone was 68% and the AUROC was 0.537. Our ML models presented here all had accuracies and AUROCs greater than those values, suggesting that the ML models outperform maximum transverse diameter alone in predicting AAA patient outcome. Female patients and male patients experienced improved predictions using their respective sex-specific models compared to using the sex-agnostic general model. Feature importance for the male and general models included more biomechanical parameters in the top 15 features as compared to the female model. For this cohort, creating models with equal sample sizes between female and male patients led to improved predictions for both male and female patients.
Sex differences in AAA biomechanics and morphology have been previously demonstrated. However, many of the papers discussing sex differences in AAA acknowledge limitations in sample size and the need for further investigation with larger cohorts of patients. Female patients with AAAs have been shown to have lumens of smaller length and diameter than their male counterparts [33]. Additionally, female patients have been shown to have smaller ILT volume than male patients [33, 34]. While female patients have been shown to have lower elastin content than age- and diameter-matched males [35], a separate study that did not age- or diameter-match found no difference [36]. Progesterone and 17β-estradiol have been demonstrated to increase elastin deposition and decrease collagen deposition at a higher rate than testosterone in human aortic smooth muscle cells [37]. Our group showed a trend towards lower wall tissue tensile strength in female AAA compared to male AAA [38]. Female sex has also been shown to be a contributing factor in increased biomechanical risk of rupture in AAA [39].
Previous work has investigated using ML classification models to predict AAA outcomes. We recently demonstrated the utility of biomechanical and morphological indices in addition to clinical indices in predicting AAA outcome, but did not include any sex-based differences in those analyses [24]. Lindquist et al. 2021 found significant differences between male and female patients and included patient sex as a covariate in their model, but only had 35 female patients total in their analysis and did not explore sex-specific classification models [23]. Forneris et al. 2023 used a classifier model to predict accelerated AAA growth, but also had a small cohort size for their study [40].
There are multiple limitations in this proof-of-concept study. Due to the small sample size of repair and rupture cases for female patients, the repair and rupture groups were pooled for this study, unlike in our earlier sex-agnostic study [24]. Pooling repair and rupture cases assumes that these aneurysms would have ruptured since the clinician found the risk of rupture to be greater than the risks associated with surgery, but there is no way to know the eventual outcome of a repaired aneurysm if it did not undergo intervention. This may impact the generalizability of the models. To make sure the findings were consistent, the data were split multiple times to test multiple models and holdout testing was performed, but expanding this dataset may result in modified findings. A general model that predicted three outcomes as compared to two (Supplementary Table 1) was trained and tested, but due to smaller sample sizes in the sex-specific models, we were unable to consistently replicate AUROC values for some of the groups, such as the female rupture group. For the equal sample sizes model, findings may have been impacted by the smaller sample sizes and more similar diameters between the groups. Additionally, this dataset consists largely of patients of Caucasian descent, which is representative of the populations of the Pittsburgh, Pennsylvania and Eau Claire, Wisconsin metropolitan areas [40], but limits application to other geographical areas. Diversifying our dataset would allow for more generalizability of the model. Finally, we did not examine longitudinal data in this study. All CT scans analyzed were the first available for each patient, some of which were not clinically sized at this initial scan. As previous studies have suggested that AAA growth rate is correlated with rupture [4, 41] and is higher in women than men [42] and prediction of AAA growth has been demonstrated using deep learning [43, 44], adding a temporal aspect to this study could strengthen understanding of why certain AAA rupture compared to others.
Historically, female patients have been underrepresented in studies of AAA biomechanics. Although female patients experience lower prevalence rate of AAA than male patients [3], they experience AAA rupture rates at a rate exceeding that of their male counterparts [5]. ML shows promise in innovating how clinicians predict whether an aneurysm will be stable or need intervention [24], but it is important to consider how the model predicts based on sex. In this proof-of-concept study, we investigated whether creating sex-specific ML classification models improves prediction for female and male patients. It was found that a ML model trained on only female patients places less importance on biomechanical parameters than one trained on male patients or a general model. Additionally, for our dataset, training a model on only female patients or only male patients leads to improved predictions as compared to training a model on a dataset consisting of both male and female patients. In a clinical application, this tool could provide clinicians with a better picture as to the state of an AAA. These ML models outperform diameter in predicting AAA outcome [45]. However, as increased AAA prevalence for males leads to greater representation of male patients in datasets, it is important to consider the impact this has on predictions for female patients. Through sex-specific models or equalized sample sizes, bias in these models can be minimalized.
Supplementary Information
Supplementary Material 1
The reference list from the paper itself. Each links out to its DOI / PubMed record.
- 1Chaikof EL, Dalman RL, Eskandari MK, Jackson BM, Lee WA, Mansour MA, Mastracci TM, Mell M, Murad MH, Nguyen LL. The Society for Vascular Surgery practice guidelines on the care of patients with an abdominal aortic aneurysm. Journal of vascular surgery 67, 2–77. e 72 (2018).10.1016/j.jvs.2017.10.04429268916 · doi ↗ · pubmed ↗
- 2Hannawa KK, Eliason JL, Upchurch GR Jr. Gender differences in abdominal aortic aneurysms. Vascular. 2009;17(Suppl 1):S 30-39.10.2310/6670.2008.00092 PMC 291305219426607 · doi ↗ · pubmed ↗