Correction: Estrogen via GPER downregulated HIF-1a and MIF expression, attenuated cardiac arrhythmias, and myocardial inflammation during hypobaric hypoxia
Prosperl Ivette Wowui, Richard Mprah, Marie Louise Ndzie Noah, Joseph Adu-Amankwaah, Anastasia Wemaaatu Lamawura Kanoseh, Li Tao, Diana Chulu, Simon Kumah Yalley, Saffia Shaheen, Hong Sun

Abstract
Genes, proteins, chemicals, diseases, species, mutations and cell lines named across the full text — each resolved to its canonical identifier and authoritative record.
Click any figure to enlarge with its caption.
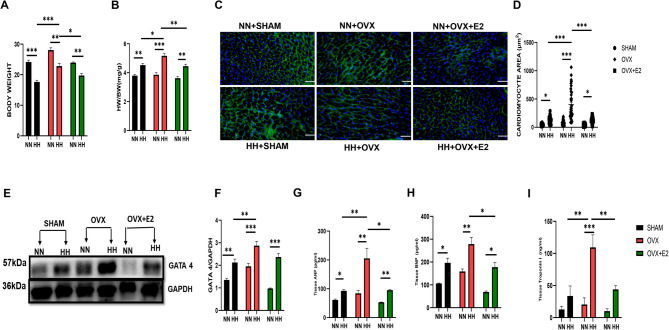 Figure 1
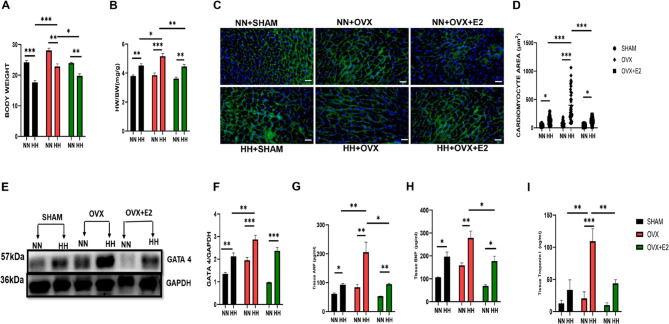 Figure 2
Peer Reviews
No public reviews on file for this paper yet. If you reviewed it on a platform where reviews are public (OpenReview, ICLR, NeurIPS, ICML), you can paste yours below so the community can read it here.
Videos
No videos yet. Explain this paper in a talk, walkthrough, or lecture? Add one.
Taxonomy
TopicsMacrophage Migration Inhibitory Factor · High Altitude and Hypoxia · Eicosanoids and Hypertension Pharmacology
Correction: Molecular Medicine 31, 107 (2025)
https://doi.org/10.1186/s10020-025-01144-2
In this article (Wowui et al. 2025), Fig. 2 appeared incorrectly and have now been corrected in the original publication.
For completeness and transparency, the old incorrect versions are displayed below.
The original article has been corrected.
Incorrect Fig. 2.
Fig. 2. Effect of E2 on cardiac morphometric and injury markers. A & B Graphical representation of Body weight, and HW/BW. C & D Cardiomyocyte area. E & F Western blot band and graphical representation of blot G, H, I: Graphical representation of markers of hypertrophy and injury. This result is represented as a mean ± SEM. (n = 6) ( *p < 0.05, **p < 0.01, ***p < 0.001), ANP Atrial Natriuretic Peptide, BNP Brain Natriuretic Peptide, BW Body weight, cTnI Cardiac troponin I, ELISA Enzyme-linked immunosorbent assay, GATA4 GATA Binding Protein 4, HW Heart weight
Correct Fig 2.
Fig. 2 Effect of E2 on cardiac morphometric and injury markers. A & B Graphical representation of Body weight, and HW/BW. C & D Cardiomyocyte area. E & F Western blot band and graphical representation of blot G, H, I: Graphical representation of markers of hypertrophy and injury. This result is represented as a mean ± SEM. (n = 6) ( *p < 0.05, **p < 0.01, ***p < 0.001), ANP Atrial Natriuretic Peptide, BNP Brain Natriuretic Peptide, BW Body weight, cTnI Cardiac troponin I, ELISA Enzyme-linked immunosorbent assay, GATA4 GATA Binding Protein 4, HW Heart weight