Changes over time in social inequality in adult self-rated health: the case of Norway 2002–2019
Tord Finne Vedøy, Liv Grøtvedt, Astri Syse

TL;DR
This study examines how social inequality in self-rated health has changed in Norway from 2002 to 2019, finding that inequalities have remained stable over time.
Contribution
The study provides new evidence on the stability of social inequalities in health in Norway using multiple socioeconomic measures over nearly two decades.
Findings
Social inequalities in self-rated health remained stable in Norway from 2002 to 2019.
Men and women with lower education or income had consistently lower probabilities of good self-rated health.
Those outside the labor force reported significantly lower self-rated health compared to those in skilled occupations.
Abstract
Findings on how social inequality in self-rated health (SRH) has changed over time are not uniform. To inform public health policies aimed at reducing unwarranted social differences in health, we examine time trends in relative and absolute associations between SRH and three different socioeconomic measures using Norway as a case. Six rounds (2002–2019) of repeated national, cross-sectional, data from Statistics Norway’s Survey on Living Conditions (response rates 57–70%) were linked to register information on socioeconomic measures (education, household income and occupation). A set of logistic regression models of good SRH (GSRH) with blockwise inclusion of predictors were employed to 29,012 adults (25–66 years). Absolute and relative differences in GSRH across education, income and occupation were calculated across survey years, net of other sociodemographic characteristics and risk…
Genes, proteins, chemicals, diseases, species, mutations and cell lines named across the full text — each resolved to its canonical identifier and authoritative record.
Click any figure to enlarge with its caption.
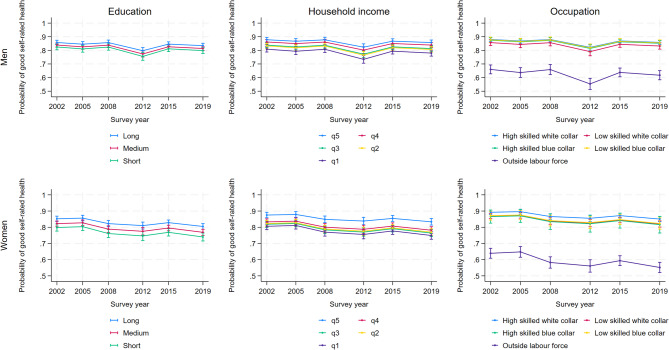 Figure 1
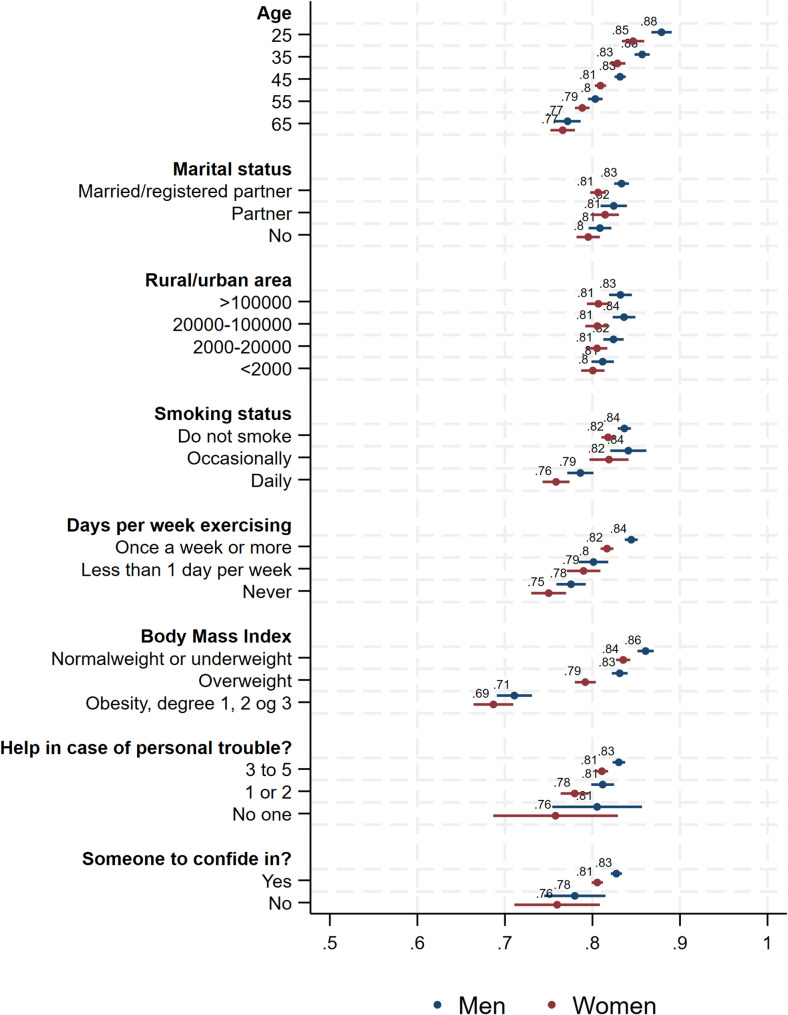 Figure 2
- —Norwegian Institute of Public Health (FHI)
Peer Reviews
No public reviews on file for this paper yet. If you reviewed it on a platform where reviews are public (OpenReview, ICLR, NeurIPS, ICML), you can paste yours below so the community can read it here.
Videos
No videos yet. Explain this paper in a talk, walkthrough, or lecture? Add one.
Taxonomy
TopicsHealth disparities and outcomes · Food Security and Health in Diverse Populations · Employment and Welfare Studies
Background
Reducing social inequality in health is an important public health aim for most developed countries, and it is also firmly grounded in the United Nations’ sustainable development goals [1]. Concerns about health inequalities are largely influenced by Wilkinson’s much debated argument, suggesting that in societies with the same level of prosperity, larger inequalities lead to poorer public health [2], with significant social and economic costs to both individuals and societies [1].
Since the 1990 s, a vast literature has described inequalities in health in terms of mortality, morbidity, and self-rated health (SRH) in European countries [3–11]. Although most studies have examined the role of education, a few studies have also included income or occupation. These older studies show that those educationally [3, 6–8, 11], financially [3, 8, 10] or vocationally [3, 9, 11] better off tend to have longer life expectancies and better health than those with fewer resources. More recent studies of changes over time across European countries confirm relatively stable and persisting social inequalities in SRH in working age populations [12–16], except for widening inequalities in some contexts associated with the Great recession, which hit Europe in 2008–2009 [17, 18]. Few studies have, however, looked jointly at education, income, and occupation. We thus aim to assess trends over time in social inequality in SRH in Norway between groups with different educations, household incomes and occupations, using six rounds of national representative survey data from 2002 to 2019, complementing existing national reviews [19, 20].
Existing research on SRH
Three studies from Europe, also including Norway, have analyzed educational differences in SRH in the period 2000 to 2014 [15, 17, 18]. One study concluded that the recession in Europe was associated with widening educational inequalities in SRH, but this was not observed for Norway, which was categorized among the countries without ‘crisis episodes’ [17]. The other two studies found persistent, but stable, inequalities in SRH during periods of economic crises [15, 18]. Leão et al. attributed this to countries’ ability to avoid a policy of austerity [18]. Mackenbach et al., however, observed a slowdown in the decline in ’less than good’ SRH among people with both short and long education, even in countries most severely hit by the crisis [15]. A recent Norwegian study, from a regional set of surveys, show stability in absolute SRH differences by education, whereas the relative differences have increased [21]. Studies from Finland and Germany also found that educational inequalities in SRH remained fairly stable through the first decade of this century [12, 13, 22], although economic recessions and financial crises appeared to temporarily influence inequalities.
For income differences, studies tend to show that they are increasing more often than they are decreasing [8, 23, 24]. A systematic review found material factors to contribute the most in explaining socioeconomic position (SEP) inequalities in SRH, primarily due to their higher independent (direct) effect [25]. There is more debate concerning the additional shared (indirect) effect through psychosocial, behavioral and/or risk factors, such as physical inactivity, obesity and social support, although they are all clearly associated with SEP. Whereas some studies suggest that they explain relatively little of the observed variance observed for SEP inequalities [26–28], other studies suggest that they play a more important role [25, 29]. Smoking is an exception, as it appears to be a behavior that plays an important role in explaining inequalities in SRH in countries where smoking is common [30].
Aims and research questions
This study contributes to the existing knowledge base by examining absolute and relative changes in SRH over a 20-year period, in a country with a generous social security system, using three measures of SEP, while also taking sociodemographic, lifestyle and social support factors into account. We pose the following research questions (RQs):
- RQ_1_: Have educational inequalities in SRH changed over time?
- RQ_2_: Have household income inequalities in SRH changed over time?
- RQ_3_: Have occupational inequalities in SRH changed over time?
- RQ_4_: Do the time trends differ on absolute versus relative scales?
In light of existing research, we expect the inequalities in SRH between educational groups to have remained fairly stable over time in Norway (H_1_). Furthermore, we expect to find slightly increasing income differences in SRH over the past two decades (H_2_). We do not expect notable increases in inequalties between groups related to the 2008 Great recession, as the impact of this crisis was minor in Norway due to relative high levels of prosperity and existing social welfare schemes [17, 18]. In terms of occuapational differences, our analyses are more exploratory because there is less research on occupational differences over time, and the status and work tasks associated with various occupations have changed considerably over time [31].
In terms of sex differences, we expect the associations between health and education to be similar as the educational expansion applied to both men and women, whereas the associations between health and income may increase more for women over time as the ‘male breadwinner model’ has become less common (H_3_).
Not many studies look at time trends on both absolute and relative scales, although notable exceptions exist, as stated previously. As the compositions and size of the groups in terms of education and occupation have changed considerably over time, we expect more stability over time in absolute than relative differences (H_4_).
Data and methods
Data
Data came from Statistics Norway’s Survey on Living Conditions, a repeated national, cross-sectional survey of Norwegian adults conducted every three to four years. We used data from six pooled surveys collected by Statistics Norway in 2002, 2005, 2008, 2012, 2015 and 2019. From 2015, this survey has been harmonized with the European Health Interview Survey (EHIS).1 These data were linked to national registry information on education, household income, and occupation. The Norwegian Agency for Shared Services in Education and Research granted ethical approval and was responsible for administration and delivery of a linked, anonymized research file.
From 2002 to 2012, data were collected primarily by telephone interviews, whereas they were collected exclusively by telephone in 2015 and 2019.2 An additional postal survey with a partly overlapping set of questions was conducted from 2002 to 2012. To ensure comparability over time, we opted to only include information obtained by interviews (telephone and face-to-face), and not from postal surveys.
In all surveys, respondents were selected randomly from the Norwegian population register, the overall sample size was 10 000 from 2002 to 2012, and 14 000 in 2015 and 2019. Response rates for the telephone/face-to-face interviews varied from 70% in 2002 to 57% in 2019. Details about sample size, non-response and response rates are provided in Table A1a in Additional file 1.
We only included respondents aged 25–66 years. At age 25, the majority has completed their education and begun their working careers. At age 66, the majority has not yet retired from the work force. Individual-level SEP (education, income, and occupation) is thus measured quite accurately in this age span. In total, 28 989 of 29 012 adults answered the question on self-rated health (cf. Additional file 1, Table A1b for specifics).
Measure of self-rated health (SRH)
SRH was assessed by the question How do you rate your health in general? The response categories were very good, good, fair, poor, and very poor. We dichotomized the outcome variable by combining very good and good into good, and fair, poor, and very poor into less than good, in line with previous studies [22, 32].
Measures of socioeconomic position (SEP)
Education
was recorded using a seven-point scale denoting the respondents’ highest level of education (cf. ISCED 2011). The categories were collapsed into three groups: Short (no education, pre-primary, primary and lower secondary education, 0–9 years), Medium (upper secondary and post-secondary education, 10–12 years), and Long (tertiary education, 13 + years).
Household income
was defined as the sum of any post-tax income for all persons in the household, divided by the number of consumption units in the household (first adult = 1, any additional person = 0.5 each) since the needs of a household do not increase proportionally to its size. This is in line with Mackenbach et al. [33]. It was grouped into quintiles by age group, sex and year, with Q1 as the lowest and Q5 as the highest income group.
Occupation
was measured using the first digit from the International Standard Classification of Occupations (ISCO-08). The overarching categories were combined into: High-skilled white collar (ISCO 1,2 and 3), Low-skilled white collar (ISCO 4 and 5), High-skilled blue collar (ISCO 6 and 7), and Low-skilled blue collar (ISCO 8 and 9). Respondents that were outside the labor force comprise the category *Not in labor force.*3
Covariates
Sociodemographic variables include Survey year (2002, 2005, 2008, 2012, 2015, and 2019), Marital status (married, cohabitating, or not living with a partner), Rural/urban area of residence, defined by number of inhabitants (> 100,000, 20,000–100,000, 2,000–19,999 and < 2,000), Geographic region of residence (7 categories) and Age as a continuous measure. Rural/urban area is a compound measure based on Statistic Norway’s centrality index, based on population size and nearness to larger labour markets and/or cities. Since the index has changed over time, we used a least common denominator of categories, and combined categories with few respondents.
In addition, we include a range of lifestyle variables that may help explain GSRH scores net of SEP: Cigarettes smoking status (do not smoke, smoke occasionally, and smoke daily), Weekly exercise (1+, < 1 day, and never) and Body mass index (BMI < 25, BMI 25–29, and BMI ≥ 30). We do the same for two measures of social support: Number of people you can count on in case of personal problems (3+, 1–2, and none) and having Someone to confide in (yes and no).
Methods
To examine the associations between SRH and education, household income and occupation, we constructed two sex-specific sets of logistic regression models in Stata 17.0 with blockwise inclusion of covariates and listwise deletion of respondents with missing information. Model 1 regressed GSRH on all sociodemographic variables. Model 2 included the three measures of SEP (exposures) but omitted geographic region due to statistical non-significance for both men and women. In Model 3 we added lifestyle measures, whereas in Model 4 we also included additional measures of social support.
The testparm-command was used to determine inclusion of variables in subsequent models, cf. Additional file 2 which shows the odds ratios (ORs) from all four models. In line with our conceptual framework, both BIC and AIC strongly suggest that Model 4 (including lifestyle behaviors and/or characteristics) fitted the data best. Using estimates from this model, we calculated predicted probabilities of good self-reported health (GSRH) and marginal effects for education, income, and occupation in absolute (dydx) and relative (eydx) terms4 across survey years, cf. Additional file 3 for estimates.
To examine changes over time in the association between SEP and GSRH, we ran three additional models including an interaction between year and each of the three exposure variables, cf. Additional file 4.
Lastly, we calculated the relative (RII) and slope index of inequality (SII) from a set of gender specific models including the interaction between survey year and sex- and year-specific ridit scorings. In short, a ridit analysis transforms a categorial variable (for example Education) into a numeric variable from which one can calculate RII (the relative increase from the lowest to the highest value) and SII (the absolute difference between the lowest to the highest value), cf. Additional file 5 for further explanation and results. Fig. 2 and A5a/A5b in Additional file 5 were created using the coefplot-command [34].
Results
Descriptive statistics
The distributions of respondents across all variables by sex are presented in Table 1. A large majority of women and men (80 and 82%) rated their health as very good or good. Mean age of the sample was 45 years and there was an even distribution of men and women and respondents from urban and rural regions. Three quarters of the sample was either married or had a cohabiting partner. Substantial shares had a long education (34% men and 44% women) and near half had a high-skilled white-collar occupation. Around 70% of men and women reported no daily or occasional smoking. Among men, 69% reported exercising at least once a week and 40% reported a BMI < 25. Among women, the corresponding values were higher for both exercise (76%) and BMI (60%). Large shares (> 76%) had three or more people to turn to in case of personal problems, and the vast majority (> 95%) reported that they had someone to confide in.
Table 1. Distributions of variables across sex^a^MenWomenSample N%SDSample N%SDGood self-rated health (GSRH)Yes14 57081.838.614 41980.139.9No14 57018.238.614 41919.939.9Year200214 58617.237.714 42616.737.3200514 58616.737.314 42616.737.3200814 58615.736.314 42616.136.8201214 58613.534.114 42613.233.8201514 58618.939.214 42618.939.1201914 58618.138.514 42618.438.7AgeMean (not percent)14 58645.611.714 42645.411.7Marital statusMarried14 57854.249.814 42254.649.8Cohabiting14 57819.539.614 42218.839.1No partner14 57826.344.114 42226.644.2Rural/urban area^b^> 100 00013 12626.744.213 06427.744.820 000–100 00013 12621.741.213 06421.240.92 000–19 99913 12627.744.713 06428.245.0< 2 00013 12623.942.713 06422.842.0Adjusted household income quintilesq514 18020.240.214 13720.640.5q414 18020.340.214 13720.340.2q314 18020.240.214 13720.440.3q214 18019.539.614 13719.239.4q114 18019.739.814 13719.439.6EducationLong14 22634.347.514 06044.149.7Medium14 22651.250.014 06041.949.3Short14 22614.535.214 06013.934.6Occupation/EmploymentHigh-skilled white collar14 54847.049.914 40545.949.8Low-skilled white collar14 54811.431.714 40527.244.5High-skilled blue collar14 54817.237.714 4052.415.2Low-skilled blue collar14 54810.430.614 4054.621.0Outside labor force14 54814.134.814 40519.939.9Smoking statusDo not smoke14 54769.346.114 40071.445.2Occasionally14 5479.629.514 4008.427.8Daily14 54721.140.814 40020.240.2Exercise≥ 1 time/week14 54568.646.414 39576.342.5< 1 time/week14 54514.735.414 39511.531.9Never14 54516.737.314 39512.232.7Body Mass IndexNormal/underweight (BMI < 25)14 47339.748.914 05259.949.0Overweight (BMI 25–29)14 47346.949.914 05229.345.5Obese (BMI ≥ 30)14 47313.434.114 05210.731.0Help in case of personal trouble?3+ people14 46976.442.514 35182.637.91 or 214 46922.141.514 35116.437.1None14 4691.612.414 3511.09.8Someone to confide in?Yes14 52295.820.014 39297.814.7No14 5224.220.014 3922.214.7^a^Distributions by geographic region are not shown (available on request)^b^In addition to number of inhabitants, categorizations were also based on closeness to larger cities and labour market regions
When we examined descriptive changes in distributions across survey years for both sexes combined (cf. Additional file 1, Figure A1b), we found that the share reporting GSRH was stable (78–82%). Among the SEP exposure variables, the largest change was observed for education, where the share reporting the longest education increased by 15% points (pp) from 2002 to 2019. Among the covariates, the largest positive changes were observed for never exercising (−12 pp) and daily smoking (−18 pp). Obesity, on the other hand, increased (+ 7 pp), as did the share without a partner (+ 6 pp).
Modeled results
Our main results are portrayed in Fig. 1, which shows probabilities of GSRH from Model 4 (our final model) across education, income, and occupation. In short, both male and female respondents with long education or in the highest income quintile, had a generally higher probability of GSRH compared to respondents with short education or in the lowest income quintile (4 to 6% points lower when comparing shortest and longest education, and 7 to 8% points lower when comparing lowest and highest income quintile). The differences between groups were, however, relatively minor, and GSRH was generally stable and above 0.8 (80%) throughout the period. This was observed regardless of the statistical model applied (cf. Additional file 2). Additional file 3 visualizes the corresponding absolute (pp, dydx) and relative (%, eydx) changes in estimates.
Fig. 1. Probability of reporting good self-rated health among men and women, by education, income and occupation, Norway 2002-2019
For different occupations, the distribution of GSRH among those who participated in the labor market was comparable to those observed for long education and high income. However, respondents who were outside the labor force reported much lower probabilities of GSRH (around 0.6 or 60%), and the probabilities were lower in 2019 compared to 2022 (9% points lower among women (p < 0.01) and 4% points lower among men (p < 0.05)). Models with interaction terms between year and socioeconomic variables supported these findings across the three SEP measures (cf. Additional file 4).
The probabilities of reporting GSRH for all covariates in the final model are shown in Fig. 2. The results show that GSRH did not vary substantially with marital status or urbanity of place of residence. However, GSRH decreased with age and was relatively strongly associated with lifestyle variables (smoking, exercise, and BMI) in expected directions. The probability of reporting GSRH was, for instance, 0.86 and 0.84 among men and women with BMI < 25, and 0.71 and 0.69 among those with BMI ≥ 30.
Fig. 2. Predicted probabilities of reporting good self-rated health at each value of the covariates from Model 4 (survey year and SEP measures omitted)
Results from models using the Relative Index of Inequality (RII) and Slope Index of Inequality (SII) are shown in Additional file 5. These results (Figure A5a and A5b) were stable, irrespective of inequality measure used, and largely comparable to the results from the main model (Model 4) shown in Fig. 1.
Discussion
Norway is a welfare state, with citizens benefitting from a range of health and welfare services, including income security [35]. Strong public health regulations are also reflected in the Norwegian Public Health Act, first adopted in 2011 [36]. Similar national egalitarian health programs have also been launched in other European countries, like the UK, the Netherlands, Sweden and Finland [12].
In a nationally representative survey sample with solid response rates and linked to sociodemographic register data, we found stable trends over time in self-rated health inequalities in both absolute and relative terms. Irrespective of SEP, the vast majority reported good health across most survey years. In both absolute and relative terms, the social gradient in health persisted for both education and income, in line with H_1_ but contrary to H_2_. Furthermore, we did not find significant differences in the association between health and income between men and women, and thus no support for H_3_. Lastly, the change over time was not substantially different on absolute and relative scales, contrary to H_4_. We observed minor differences between occupational groups among the employed, whereas those outside the labor force reported considerable worse health.
Comparing our findings with those of others, we see that the results for education compare well with those reported by others, cf. for instance, Mackenbach et al. [15] and van der Wel et al. [17]. Increases in inequalities in health have been related to lack of health improvement among those with short education [17]. We did not corroborate this finding, perhaps due to the inclusion of health behaviors and risk factors known to be more prevalent in this group [37]. A recent German study found stability in educational inequality in both absolute and relative terms among older men of working age (50–64), whereas an increase in absolute terms was observed for women [16]. The authors note that findings on inequalities may be life-stage specific, and that a further disentanglement of period and cohort effects may be warranted [16]. Our findings were also contrary to those observed in a large European study covering 20 years (Norway not included), which found decreasing trends in the prevalence of less than good health and increasing relative differences by education and occupation (but stability in absolute terms) in many of the 17 studied countries [11].
Our results for income align well with one German study, which found education and income inequalities in SRH to be considerable and persisting from 2003 to 2012 [22]. Our findings run contrary to an earlier German study, which found income-related inequalities in SRH to roughly double from 1994 to 2011 [38]. This is also underscored in a systematic review, which underscores that “research has shown that health inequalities by income and occupation status increased over the last few decades” [25]. Thus, also for the various occupational groups, we found smaller differences between those employed than previously reported [25]. Not surprisingly, the economically inactive in our study reported lower levels of GSRH than those who were employed. This is in line with results from a recent Canadian study [39], which suggest widening relative and absolute health inequalities between the employed and unemployed over time, primarily due to an increase in the prevalence of poor health among the unemployed. The same trend was observed in a EU-SILC study [40], which showed a steep decline in reports of good health among the unemployed. In our study, the negative trend was statistically significant and was more pronounced and declined more over time for women than men, contrary to what has been reported previously [40]. Developments in characteristics associated with health cannot, however, shed light on why the health inequalities between the employed and unemployed have widened over time. It should be noted that there is a difference between unemployment and non-employment. In our study, the economically inactive comprised all individuals aged 25 to 66 years outside the labor force, irrespective of cause (e.g., unemployed, students, health-related pensioners, home makers, etc.). As they comprised quite a large share of respondents (14% of men and 20% of women), further research directed at this group appears warranted given the size of the group and the decline in GSRH over time, especially among women.
Previous studies have shown that changes in trust, social relationships, and experiences of economic hardship account for much of the reported increase in SRH inequality, and inequalities have generally been found to be more pronounced in countries experiencing simultaneous austerity and economic recession [17], with which Norway has limited experience. Circumstances in which people live and work are, however, important for communicable as well as for non-communicable diseases also in welfare states [19]. Whereas the current trends in SRH appear relatively stable, it will be interesting to see if the recent trends of increased social inequalities after chronic illness and functional limitations in this millennium [41, 42] will translate into greater inequality also in SRH in the years to come.
Limitations and strengths
The cross-sectional survey design only enables us to report on associations. Other data and designs are needed to examine possible causal effects. Furthermore, our outcome measure is self-reported. Although SRH is a latent concept, resulting from “a cognitive process that is inherently subjective and contextual” [43], it has been found to be a valid umbrella measure encompassing both physiological and mental health across European countries, reflecting inequalities in mortality as well as bodily and mental functions between different social groups [25, 28, 44]. As such, it is considered a useful indicator for assessing inequalities in health [45]. A more problematic issue is self-selection, an inherent problem in all surveys, as those who choose to take part are likely to differ from those who refrain. Although our data were balanced in terms of age and sex, persons with fewer resources in terms of education, income and occupation were slightly underrepresented [46]. This might have led to an underestimation of the associations between GSRH and SEP, and due to declining response rates over time [46] this might be more of an issue in recent survey rounds than in earlier ones.
Most studies on socioeconomic health differences use education as the (only) exposure variable. To achieve a more comprehensive understanding and interpretation of the development of health differences over time, we used education, income quintiles and occupation as exposure variables in our analyses. Although these measures are intrinsically linked, they were not highly correlated5, and they each contribute to the overall understanding of social inequalities in health. Furthermore, all these measures were obtained from registers, and information bias should thus be minimal. The education variable may, however, slightly underestimate attained educational level for younger persons, as some continue in education after age 25. We therefore re-ran all analyses excluding those younger than 40 years, and the results were similar (not shown).
Income represents disposable income after tax, including all income sources, and the measure is thus likely to accurately reflect respondents’ economic situation. Another strength is that we have measured differences in income according to rank, thus contributing to cross-national discussions on this topic. Norway is, however, an affluent country with relatively low levels of economic inequality6. Although we lack measures of capital income and/or homeowner information in our data, the high degree of correlation between incomes and wealth in Norway [47] makes it likely that the overall conclusions in terms of material resources remain valid. Economically inactive cannot be classified based on their main occupation, and we thus opted to group them separately. As their results were markedly different from other occupational groups, this appeared to be an appropriate choice. Further research directed at this group appears warranted given the marked share men and (especially) women outside the labor force comprise and their suboptimal (and among women, declining) health.
Whether our findings apply to other contexts with different levels of affluence and inequality warrants further research, as studies have shown that experience of economic hardship might contribute to increased SRH inequality, especially in countries experiencing simultaneous austerity and economic recession [15]. Lastly, unlike many previous studies, we were able to account for changes in health behaviors and risk factors. On the one hand, this might have resulted in lower levels of both absolute and relative inequalities by SEP, because lifestyle variables may function as mediators between SEP and SRH. Future studies should examine such pathways between SEP and SRH more closely. On the other hand, the inclusion of these variables enhanced the predictive capacity of the model, and since there has been pronounced changes over time in both health behaviors (smoking and exercise), risk factors (BMI) and other confounding variables (e.g., partner status), our ability to include these measures in the final models might provide a clearer association between SEP and self-rated health.
Conclusions and the way forward
Irrespective of socioeconomic measure, social inequalities in SRH have remained remarkably stable over time in Norway, in both absolute and relative terms. The Norwegian national strategy may have worked to prevent increasing social inequalities in health, although similar findings are observed also in countries without such explicit strategies [11]. Hu et al. [11] observed that countries with encouraging and significantly decreasing trends in social inequalities in SRH, such as Italy, employed similar national level efforts to reduce inequalities as, for instance, England and Scotland, but with different results. Consequently, the evidence base for the effects of national policies to tackle health inequalities appears relatively weak, although it is not clear how the situation would present without such policies in place. Nevertheless, new actions and fundamental system changes appear warranted if the aim is to reduce existing differences. Actions on the social determinants of health is necessary to improve health, but it is also an issue of social justice [19]. How such actions should be designed and what they should entail remains, however, unclear. A Norwegian study underscores the problematic divide between public health strategies at local and national levels, in that although many municipalities focus on lifestyle and healthcare related measures, only a few acknowledge the social determinants of health and have implemented health impact assessments and health overviews to this end [48]. The authors thus argue for concerted multilevel actions to reduce health inequalities, implying that national and local approaches to a larger extent need to complement each other. Although the social protection offered by the Norwegian welfare system [18] might be sufficient to hinder an expansion of social inequalities in health, new actions and fundamental system changes appear warranted if the aim is to reduce existing differences.
Supplementary Information
Additional file 1. Sample size, response rates and descriptive changes over time for the pooled sample. Table A1a. Sample size and response rates in interview surveys of living conditions 2002-2019. Table A1b. Distributions of variables in Model 4, percent (%) and number of respondents (n), 2002-2019, men and women combined.
Additional file 2. Model choice. Table A2a. Odds ratios (OR), standard errors (SE) and p-values (p) from Model 1 to Model 4, men. Table A2b. Odds ratios (OR), standard errors (SE) and p-values (p) from Model 1 to Model 4, women. Figure A2a. Probability of good self-rated health among men and women, Norway 2002-2019. Estimates from all models.
Additional file 3. Differences over time in percentage points and percentages. Figure A3a. Absolute (percentage points) differences (dydx) in reports of good health among men and women, by education, income and occupation, Norway 2002-2019. Figure A3b. Relative (percent) differences (eydx) in reports of good health among men and women, by education, income and occupation, Norway 2002-2019. Table A3a. Marginal mean probabilities (Margin), marginal effects (dydx), semi-elasticities (eydx), standard errors (se) and p-values (p) from Model 4 for men and women.
Additional file 4. Effect modification. Figure A4a. Probability of reporting good health among men and women, by education, income and occupation, Norway 2002-2019, from models including interaction terms between the relevant exposure variable and year. Figure A4b. Absolute (percentage point) difference (dydx) over time in reports of good health among men and women, by education, income and occupation, Norway 2002-2019, from models including interaction terms between the relevant exposure variable and year. Figure A4c. Relative (percent) difference (eydx) over time in reports of good health among men and women, by education, income and occupation, Norway 2002-2019, from models including interaction terms between the relevant exposure variable and year. Table A4a. Odds ratio (OR) estimates from 3 different models including an interaction term between year and the exposure variables.
Additional file 5. Relative Index of Inequality (RII) and Slope Index of Inequality (SII). Figure A5a. Relative index of inequality (RII) over time in reports of good health from a modified Model 4, based on ridits for education, income and occupation, Norway 2002-2019. Figure A5b. Slope index of inequality (SII) over time in reports of good health from Model 4 (men) and Model 3 (women), based on ridits for education, income and occupation, Norway 2002-2019.
The reference list from the paper itself. Each links out to its DOI / PubMed record.
- 1Public Health Act, Lov-2011-06-24-29: Lov om folkehelsearbeid. Norwegian Ministry of Health and Care Services, Oslo. The Norwegian Public Health Act. Norwegian Ministry of Health and Care; 2011. https://lovdata.no/dokument/NL/lov/2011-06-24-29.
- 2Statistics Norway. Health, care and social relations, survey on living conditions Oslo 2020 [cited 2023 10/10]. Available from: https://www.ssb.no/en/helse/helseforhold-og-levevaner/statistikk/helseforhold-levekarsundersokelsen.