A novel multi-layered immune structural model for peripheral blood immune scoring in cancer patients: perspective and hypothesis
Hao Jin

TL;DR
This paper proposes a new immune structural model for assessing immune status in cancer patients using peripheral blood data, aiming to improve personalized treatment and prognosis.
Contribution
A novel immune structural model inspired by protein hierarchy for multi-dimensional immune scoring in cancer patients.
Findings
The model classifies immune components into primary, secondary, and tertiary structures.
It integrates data from flow cytometry, cytokine profiling, and immune checkpoint assessments.
The model could enhance clinical evaluation and personalized treatment in cancer.
Abstract
Accurately assessing and quantifying immune competence in cancer patients remains a major challenge in tumor immunology. Traditional intratumoral immune profiling, such as tissue pathology and tissue-based cytometry techniques, faces significant challenges due to difficulties in tissue sampling, spatial heterogeneity, and technical limitations. In contrast, peripheral blood immune profiling is a more practical and reproducible approach, providing valuable insights into systemic immune status. This article introduces a novel immune structural model, inspired by protein structural hierarchy, to classify immune components into three hierarchical levels: primary, secondary, and tertiary immune structures. We hypothesize that this model can provide a systematic framework for constructing an immune scoring system (ISS) that integrates multi-dimensional immune information from flow cytometry,…
Genes, proteins, chemicals, diseases, species, mutations and cell lines named across the full text — each resolved to its canonical identifier and authoritative record.
Click any figure to enlarge with its caption.
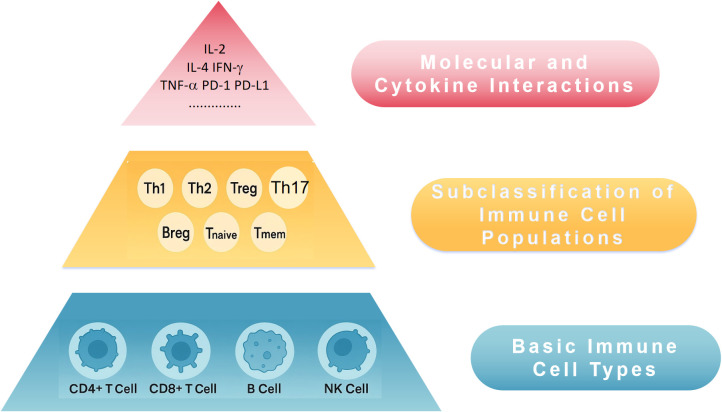 Figure 1
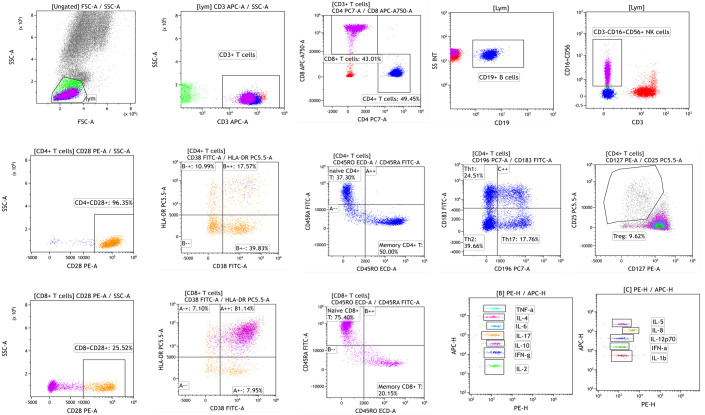 Figure 2
| Tier | Feature (marker examples) | Measurement platform | Unit / readout | Expected directionality (example) |
|---|---|---|---|---|
| Primary | CD3+, CD4+, CD8+ T cell counts; CD4:CD8 ratio; CD19+ B cells; CD56+ NK cells | CBC; flow cytometry | cells/µL; % of lymphocytes | Low lymphocyte or high neutrophil/platelet counts → adverse prognosis |
| Secondary | CD4+ Treg (CD25+FoxP3+ or CD25+CD127^low); Th1/Th2/Th17 subsets; CD8+ memory/naïve (CD45RO/CD45RA); activation (CD69, HLA-DR, CD38); Breg (CD19+CD24^hiCD38^hi) | Multicolor flow cytometry; intracellular cytokine staining | % of parent subset; MFI (marker expression) | High Treg% → immunosuppression; high activated CD8+% → favorable immune activation |
| Tertiary | Immune checkpoints (PD-1, PD-L1, CTLA-4, LAG-3, TIM-3); cytokines (IL-2, IFN-γ, TNF-α, IL-6, IL-10, TGF-β); serum LDH | Flow cytometry (surface); ELISA, Luminex, MSD multiplex assays; clinical chemistry | % positive cells; pg/mL; U/L (for LDH) | Elevated IL-10/TGF-β→ immunosuppression; elevated IFN-γ/IL-2 → immune activation |
| Other candidates | Myeloid-derived suppressor cells (CD11b+CD33+HLA-DR^low); CRP; ESR | Flow cytometry; clinical chemistry | cells/µL; mg/L | High MDSCs or elevated CRP/ESR → systemic immunosuppression |
| Score | Formula / components | Typical use | Strengths | Limitations | How ISS complements |
|---|---|---|---|---|---|
| NLR | Neutrophils / Lymphocytes | Prognosis across cancers | Simple, inexpensive, routinely available | Non-specific; reflects inflammation but not functional immune status | ISS incorporates lymphocyte subsets, functional differentiation, and molecular checkpoints |
| PLR | Platelets / Lymphocytes | Prognosis, thrombosis-related risk | Simple, available from CBC | Similar limitations as NLR; does not capture immune activation states | ISS adds immune phenotype and cytokine context |
| SII | (Platelets × Neutrophils) / Lymphocytes | Prognostic biomarker in multiple cancers | Integrates three blood count parameters | Still reflects coarse inflammation rather than functional immunity | ISS provides multi-dimensional mechanistic resolution |
| dNLR | Neutrophils / (Leukocytes − Neutrophils) | Used in LIPI and ICI studies | Simple, validated in ICI cohorts | Limited scope; lacks molecular and subset detail | ISS provides checkpoint and cytokine-level information |
| LIPI | dNLR + LDH | Prognostic index in NSCLC patients on ICIs | Combines systemic inflammation and tumor burden | Specific to certain settings; limited mechanistic insight | ISS is generalizable, mechanistic, and can be applied across tumor types |
| ISS (proposed) | Weighted composite of Primary, Secondary, and Tertiary immune structures | Predictive/prognostic biomarker, immunotherapy decision-making, longitudinal monitoring | Multi-layered, mechanistically informed, adaptable | Requires validation; more resource-intensive than CBC | Complements existing indices by offering functional and molecular resolution |
Peer Reviews
No public reviews on file for this paper yet. If you reviewed it on a platform where reviews are public (OpenReview, ICLR, NeurIPS, ICML), you can paste yours below so the community can read it here.
Videos
No videos yet. Explain this paper in a talk, walkthrough, or lecture? Add one.
Taxonomy
TopicsSingle-cell and spatial transcriptomics · Cancer Immunotherapy and Biomarkers · Ferroptosis and cancer prognosis
Introduction
1
The tumor immune microenvironment (TME) is an intricate and dynamic network consisting of various cell types, signaling molecules, and cellular interactions (1). Unlike normal tissue, the TME is characterized by a diverse and evolving composition that can drastically influence tumor progression, immune surveillance, and therapeutic outcomes. The complexity of the TME arises from the following factors:
Cellular heterogeneity
1.1
The TME contains a broad spectrum of immune and non-immune cells, each playing distinct roles in either supporting or inhibiting tumor progression. Immune cells in the TME include cytotoxic T lymphocytes (CTLs), regulatory T cells (Tregs), B cells, natural killer (NK) cells, macrophages, and dendritic cells (DCs) (2). These immune cells do not only interact with tumor cells but also with other non-immune stromal cells like fibroblasts, endothelial cells, and the extracellular matrix, creating a highly heterogeneous and constantly changing microenvironment. The functional state and activation of these immune cells are influenced by various molecular signals and environmental factors within the TME (3).
Molecular signaling networks
1.2
In the TME, immune cells are constantly exposed to tumor-secreted factors, such as cytokines, chemokines, and growth factors, which profoundly shape their behavior. Tumor cells often secrete immunosuppressive cytokines like TGF-β and IL-10, which promote immune tolerance and inhibit anti-tumor immunity. On the other hand, pro-inflammatory cytokines such as IL-2, IFN-γ, and TNF-α are essential for activating immune responses. The balance between these pro-inflammatory and immunosuppressive signals plays a critical role in determining whether the immune response in the TME will lead to tumor control or immune evasion (4).
Immune evasion mechanisms
1.3
Tumor cells are adept at modulating the immune microenvironment to escape immune detection. This occurs through various mechanisms, including immune checkpoint activation (e.g., PD-1/PD-L1, CTLA-4, LAG-3) and the recruitment of Tregs and myeloid-derived suppressor cells (MDSCs), which inhibit immune activation. These immune evasion strategies are particularly evident in the case of immune checkpoint inhibitors (ICIs), which have shown promising therapeutic potential in certain cancers but often encounter resistance due to complex immune suppression in the TME. Therefore, understanding the multi-layered immune interactions within the TME is essential for developing more effective and personalized therapeutic approaches (5).
Tumor-stroma interaction
1.4
Beyond immune cells, the TME is influenced by various non-immune stromal cells, including fibroblasts, endothelial cells, and extracellular matrix components, which all contribute to the immune and tumor microenvironment. Cancer-associated fibroblasts (CAFs), for instance, secrete factors that modify immune cell behavior and tumor cell survival, while endothelial cells promote angiogenesis to supply the growing tumor with nutrients. These stromal components can also help in immune evasion by physically and chemically shielding tumor cells from immune cells or by recruiting immunosuppressive cells to the TME.
Spatio-temporal dynamics of the TME
1.5
The TME is not static but evolves dynamically over time, especially in response to therapeutic interventions. Spatial heterogeneity within the tumor tissue adds another layer of complexity, as different areas of the tumor may exhibit varying immune cell infiltrates and molecular signals. The central tumor region may be poorly oxygenated, leading to immune suppression, while the periphery of the tumor may exhibit higher levels of immune cell activity. Understanding these spatial and temporal changes is crucial for designing therapies that can target the immune system at multiple levels, from the cellular to the molecular.
Tumor local immune profiling challenges and peripheral blood immune profiling advantages
2
While intratumoral immune profiling offers the most direct assessment of local immune status, it faces significant technical and operational challenges:
Sampling difficulties: Solid tumor biopsies often provide minimal tissue samples and may not represent the entire tumor's immune environment.Spatial heterogeneity: Different regions within a tumor may have significantly different immune profiles, and localized profiling may not reflect the overall immune landscape of the tumor.Technical limitations: Existing technologies, such as tissue-based cytometry techniques and immunohistochemistry, fail to comprehensively and accurately assess immune cell functions and interactions.
In contrast, peripheral blood immune profiling offers the following advantages:
Ease of sampling: Blood collection is non-invasive, and it can be repeated multiple times, providing an opportunity for longitudinal monitoring.High reproducibility: Peripheral blood sampling allows for dynamic immune monitoring, enabling real-time tracking of changes in the immune system over the course of treatment.Operational practicality: Technologies like flow cytometry and cytokine profiling can accurately assess immune cell types, subtypes, and their functional states in peripheral blood, providing valuable clinical insights.
Studies have shown that immune cell populations in peripheral blood (such as T cells, Tregs, and B cells) correlate with responses to immunotherapy (6–9). Especially in situations where intratumoral immune profiling is limited, peripheral blood immune profiling provides an important complement for evaluating therapeutic efficacy and prognostic outcomes (10).
Immune structural model: inspired by protein structural hierarchy
3
Proteins possess a primary structure (amino acid sequence), a secondary structure (α-helix, β-sheet), and a tertiary structure (3D conformation of molecules), which dictates their function through hierarchical organization (11). Drawing inspiration from this, we propose that immune information can also be stratified into three hierarchical levels as shown in Figure 1:
Conceptual three-tier immune structural model for peripheral blood immune profiling and ISS. ISS, Immune Scoring System; NK cell, natural killer cell; Th, T helper cell; Treg, regulatory T cell; Breg, regulatory B cell; IL-2, interleukin 2; IL-4, interleukin 4; IFN-γ, interferon-γ; TNF-α, tumor necrosis factor-α; PD-1, programmed death 1; PD-L1, programmed death ligand 1.
Primary immune structure — basic immune cell types
3.1
Peripheral blood analysis can assess basic immune cell populations, such as CD4+ T cells and CD8+ T cells, which are central to anti-tumor immunity. The dynamic balance between these two cell types is essential for overall immune function. Their proportions and numbers are fundamental indicators of immune status. Additionally, B cells and NK cells can be included as Primary indicators.
Secondary immune structure — subclassification of immune cell populations
3.2
Within the primary immune compartments, further categorization of immune cells into functional subsets provides deeper insights into immune function:
CD4+ T cell subsets: Th1, Th2, Th17, Treg, etc.CD8+ T cell subsets: Activated T cells (e.g., CD69+), memory T cells (CD45RO+), naïve T cells (CD45RA+).B cells and NK cells: Further subclassification into memory, plasma, and cytotoxic/activated types.
This level of analysis provides a clearer understanding of how immune cells contribute to effective anti-tumor responses.
Tertiary immune structure — molecular and cytokine interactions beyond cellular composition, immune function is regulated by molecular interactions and cytokine networks
3.3
Immune checkpoint molecules: PD-1, CTLA-4, LAG-3, etc.Cytokine environment: Pro-inflammatory cytokines (e.g., IL-2, IFN-γ), immunosuppressive cytokines (e.g., IL-10, TGF-β).Immune proteomics: Profiling peripheral blood proteins for immune activation or suppression markers.
The integration of these three levels (primary, secondary, tertiary) forms a comprehensive approach to quantifying immune function and provides a systematic method for immune scoring.
Constructing the peripheral blood immune scoring system
4
Based on the proposed immune structural model, we suggest constructing a multi-level, weighted immune scoring system:
ISS=w1×(Primary Score)+w2×(Secondary Score)+w3×(Tertiary Score).
Primary Score (PS): Based on the proportions or numbers of CD4+ / CD8+ T cells, reflecting the foundation of immune status.Secondary Score (SS): Derived from the fine sub-populations of CD4+ and CD8+ T cells, including functional differentiation (e.g., Th1, Th2, Treg), activation (e.g., CD69+), and memory T cells (CD45RO+).Tertiary Score (TS): Quantifies the expression levels of immune checkpoint molecules (e.g., PD-1, LAG-3) and cytokines (e.g., IL-2, IFN-γ, IL-10).
Weighting the scores
4.1
Primary Structure is the most fundamental and should carry the largest weight, as it represents the basic immune equilibrium between major immune cell types (e.g., T cells). We recommend assigning a higher weight to this level, e.g., w1 = 0.5.Secondary Structure provides more detailed functional information and is important for evaluating immune activation status. The weight for this level could be moderate, e.g., w2 = 0.3.Tertiary Structure provides valuable molecular insights but is supplementary to the cellular-based scores. This level should have a smaller weight, e.g., w3 = 0.2.
These weightings should be further optimized through clinical validation studies, where the optimal coefficients can be determined based on large-scale data. The methods and platforms are shown in Table 1. The workflow and schematic diagram of flow cytometric analysis of immune cell subsets and cytokine detection are shown in Figure 2.
The workflow and schematic diagram of flow cytometric analysis of immune cell subsets and cytokine detection.
Clinical and research applications
5
Guiding immunotherapy decisions
5.1
The ISS can help predict which patients will respond best to immune checkpoint inhibitors (PD-1/PD-L1, CTLA-4, etc.) or other immunotherapies.
Longitudinal immune monitoring
5.2
Tracking the ISS over time can provide insights into immune dynamics during treatment, offering a tool for assessing immune response and resistance.
Prognostic and risk stratification
5.3
The ISS could serve as a biomarker for predicting cancer progression, survival rates, and overall prognosis, helping clinicians manage treatment strategies more effectively.
Enhancing immunobiology research
5.4
The ISS offers a standardized way to integrate peripheral blood immune data and allows for comparative studies across different research groups, fostering a better understanding of tumor immune environments.
Innovations and limitations
6
Innovations
6.1
The immune structural model is the first to apply a three-tiered system to classify immune status in peripheral blood, based on functional immune cells, their subtypes, and molecular interactions.This model facilitates detailed yet practical immune assessment using routine clinical blood samples.
Limitations
6.2
The model requires validation through large-scale clinical studies to establish the most reliable biomarkers and weightings for scoring.While peripheral blood offers valuable insights, it may not fully replicate the local immune status within the tumor microenvironment, and the ISS should be used in conjunction with other clinical and pathological data.
Discussion
7
Relationship to established blood-based indices
7.1
Several simple blood-derived indices have been widely studied as prognostic or predictive biomarkers in oncology, including the neutrophil-to-lymphocyte ratio (NLR), derived NLR (dNLR), platelet-to-lymphocyte ratio (PLR), systemic immune-inflammation index (SII), and the lung immune prognostic index (LIPI) (12). These indices are attractive because they can be calculated from routine complete blood counts and have been associated with outcomes across multiple tumor types. However, they capture only gross features of systemic inflammation or myeloid/lymphoid balance and do not directly represent immune functional states, cellular subsets, or molecular checkpoint activity. By design, the ISS proposed here complements these indices by integrating three hierarchical layers of immune information (basic immune cell populations, functional/phenotypic subsets, and molecular/cytokine signals) into a composite metric that aims to better reflect immune competence and treatment-relevant biology, as shown in Table 2. Where simple indices (e.g., NLR, SII, LIPI) provide rapid screening and risk stratification, ISS is intended to provide greater mechanistic resolution and clinical granularity, particularly for immunotherapy decision-making and longitudinal immune monitoring.
Data-driven derivation of ISS weights and model development
7.2
The numeric weights used in the illustrative ISS (w1, w2, w3) are placeholders for conceptual demonstration. For clinical implementation, we propose a data-driven derivation and validation workflow. Candidate features will include primary counts (e.g., absolute CD4/CD8, CD4:CD8 ratio, NK and B cell counts), secondary phenotypes (e.g., %Treg, %memory CD8, activation markers), and tertiary measures (e.g., PD-1 expression, circulating cytokine concentrations). Feature selection and weight estimation should be performed in a derivation cohort using penalized regression approaches (e.g., LASSO or elastic net) or other regularized/statistical learning methods, with model tuning performed by nested cross-validation to avoid optimistic bias. Model performance should be evaluated using discrimination measures (AUC for binary outcomes; C-index for time-to-event outcomes), calibration plots, and decision curve analysis. Final weights and the scoring algorithm must be locked before testing in an independent validation cohort. Pre-specified clinical endpoints for optimization and validation might include overall survival (OS), progression-free survival (PFS), and objective response rate (ORR); time points and censoring rules should be pre-defined following standard reporting guidelines for prediction modeling (e.g., TRIPOD-style recommendations).
Pre-analytical and technical considerations
7.3
Peripheral immune profiling is sensitive to pre-analytical and analytical variation. Prior studies have shown that blood processing delays, tube type, temperature during transport, and processing protocols can materially affect both cytokine measurements and flow cytometric readouts. To improve reproducibility and to facilitate multi-center validation, we recommend defining and reporting minimal pre-analytical standards: (1) specify anticoagulant/tube type for each assay; (2) record time from venipuncture to processing and aim for processing within 2–4 hours when feasible; (3) standardize sample handling temperature (room temperature vs refrigerated) and centrifugation protocols for plasma/serum; (4) use standardized panels with published gating strategies and include internal controls; and (5) include replicate measures or internal reference samples for longitudinal studies. Adopting and reporting these standards will reduce methodological heterogeneity and improve comparability between cohorts.
Clinical covariates and confounder control
7.4
Because peripheral immune measures are affected by clinical status and concurrent medications, analytical models assessing ISS performance should adjust for plausible confounders. At minimum, we recommend collecting and adjusting for: age, sex, tumor type and stage, tumor burden (radiographic or measurable disease), ECOG performance status, baseline systemic inflammation markers (CRP, ESR), recent infections, chemotherapy/immunotherapy history, and concurrent medications known to affect immune parameters (systemic corticosteroids, proton pump inhibitors, immunosuppressants). Statistical approaches should include multivariable regression (Cox proportional hazards for time-to-event endpoints) and sensitivity analyses stratified by key factors (e.g., steroid use yes/no). Propensity-score adjustment or inverse probability weighting may be considered in observational cohorts where treatment allocation or supportive medications differ between groups.
Validation strategy and proposed clinical use cases
7.5
To establish clinical utility, ISS development should follow a two-stage strategy: (1) derivation (training) phase and (2) independent validation phase. In the derivation phase, candidate features and weights will be estimated using one or more well-annotated cohorts with pre-specified clinical endpoints (e.g., OS, PFS, ORR). Internal validation methods (cross-validation, bootstrap) will be used during model building to limit overfitting. The finalized scoring algorithm must then be tested in at least one external validation cohort from a separate institution or clinical trial to assess generalizability; performance metrics should include discrimination (C-index, AUC), calibration (calibration slope and plots), and clinical net benefit (decision curve analysis). For dynamic monitoring, time-dependent ROC analyses and joint models or landmark analyses can be used to quantify how longitudinal changes in ISS relate to subsequent outcomes.
Potential clinical use cases to test in validation studies include:
Baseline ISS as a predictive biomarker to enrich or stratify patients for immune checkpoint inhibitors.Early on-treatment ISS change as an indicator of response vs. resistance (to guide continuation vs. switch of therapy).Longitudinal ISS trajectories for relapse surveillance after curative-intent therapy.
Sample size considerations and number-of-events rules should follow standard practice for prediction models (e.g., ensuring adequate events per variable during derivation). External validation is essential for assessing reproducibility and transportability prior to clinical implementation.
Conclusion
8
The proposed immune structural model provides a novel framework for understanding and quantifying immune function in cancer patients using peripheral blood. By integrating immune cell composition, functional subtypes, and molecular signals, this model facilitates the development of a comprehensive ISS, which could significantly impact clinical decision-making for cancer immunotherapy and precision medicine. Future research should focus on validating this scoring system across various cancer types and integrating it into clinical practice.
The reference list from the paper itself. Each links out to its DOI / PubMed record.
- 1Hanahan D Weinberg RA. Hallmarks of cancer: the next generation. Cell. (2011) 144:646–74. doi: 10.1016/j.cell.2011.02.013, PMID: 21376230 · doi ↗ · pubmed ↗
- 2Joyce JA Fearon DT. T cell exclusion, immune privilege, and the tumor microenvironment. Science. (2015) 348:74–80. doi: 10.1126/science.aaa 6204, PMID: 25838376 · doi ↗ · pubmed ↗
- 3Gajewski TF Schreiber H Fu YX. Innate and adaptive immune cells in the tumor microenvironment. Nat Immunol. (2013) 14:1014–22. doi: 10.1038/ni.2703, PMID: 24048123 PMC 4118725 · doi ↗ · pubmed ↗
- 4Chen DS Mellman I. Elements of cancer immunity and the cancer-immune set point. Nature. (2017) 541:321–30. doi: 10.1038/nature 21349, PMID: 28102259 · doi ↗ · pubmed ↗
- 5Fridman WH Zitvogel L Sautes-Fridman C Kroemer G. The immune contexture in cancer prognosis and treatment. Nat Rev Clin Oncol. (2017) 14:717–34. doi: 10.1038/nrclinonc.2017.101, PMID: 28741618 · doi ↗ · pubmed ↗
- 6Hardy-Werbin M Rocha P Arpi O Taus A Nonell L Duran X. Serum cytokine levels as predictive biomarkers of benefit from ipilimumab in small cell lung cancer. Oncoimmunology. (2019) 8:e 1593810. doi: 10.1080/2162402 X.2019.1593810, PMID: 31069160 PMC 6492977 · doi ↗ · pubmed ↗
- 7Sanmamed MF Perez-Gracia JL Schalper KA Fusco JP Gonzalez A Rodriguez-Ruiz ME. Changes in serum interleukin-8 (IL-8) levels reflect and predict response to anti-PD-1 treatment in melanoma and non-small-cell lung cancer patients. Ann Oncol. (2017) 28:1988–95. doi: 10.1093/annonc/mdx 190, PMID: 28595336 PMC 5834104 · doi ↗ · pubmed ↗
- 8Weide B Martens A Hassel JC Berking C Postow MA Bisschop K. Baseline biomarkers for outcome of melanoma patients treated with pembrolizumab. Clin Cancer Res. (2016) 22:5487–96. doi: 10.1158/1078-0432.CCR-16-0127, PMID: 27185375 PMC 5572569 · doi ↗ · pubmed ↗