Association between thyroid function and metabolic associated fatty liver disease: a systemic review and meta-analysis
Wei Xiong, Hua Fan, Jiake Tang, Qingwen Yu, Ziyi Xin, Ting Tang, Xiyun Rao, Lanlan Feng, Yongmin Shi, Xuhan Tong, Xinyan Fu, Xingwei Zhang, Mingwei Wang, Wentao Gan

TL;DR
This study finds a link between thyroid function and fatty liver disease, with thyroid-stimulating hormone being a key risk factor.
Contribution
The study provides a meta-analysis of thyroid function parameters and MAFLD across age groups.
Findings
MAFLD patients had higher TSH levels compared to controls.
Thyroid hormone levels were altered in MAFLD patients, with higher free triiodothyronine and lower free thyroxine.
The relationship between thyroid function and MAFLD is influenced by age.
Abstract
Metabolic dysfunction–associated fatty liver disease (MAFLD) is one of the most common chronic liver diseases. The relationship between MAFLD and thyroid function parameters remains controversial. This study aimed to explore the influence of metabolic parameters and thyroid dysfunction on the development of MAFLD and examine the relationship between them in different age groups. The PubMed, Embase, Web of Science, China National Knowledge Infrastructure(CNKI), and Cochrane Library databases were searched. Standardized mean difference (SMD) and odds ratio with a 95% confidence interval (CI) were calculated. A total of 36 studies involving 198,254 participants were eligible. Compared with controls, the patients with MAFLD had significantly higher thyroid-stimulating hormone (TSH) levels (MAFLD vs controls: SMD = 0.02, 95% CI = 0.01–0.03); significantly higher free triiodothyronine…
Genes, proteins, chemicals, diseases, species, mutations and cell lines named across the full text — each resolved to its canonical identifier and authoritative record.
Click any figure to enlarge with its caption.
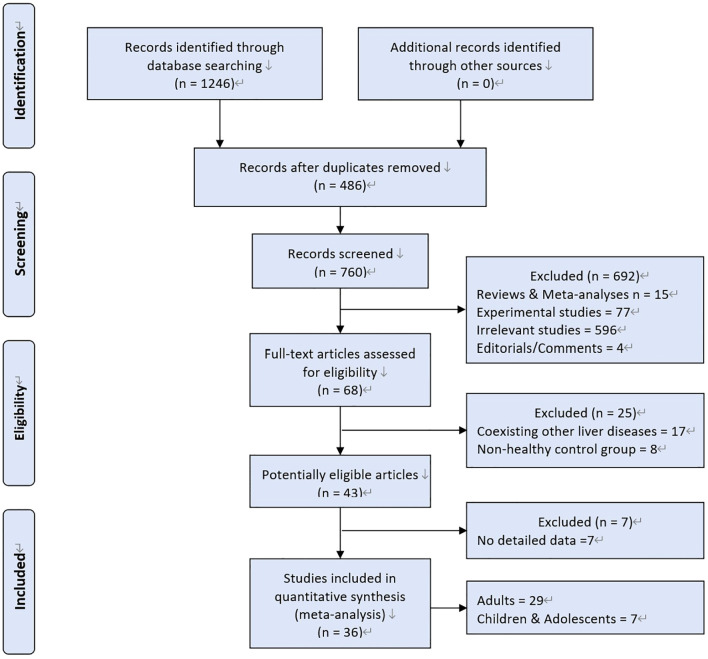 Figure 1
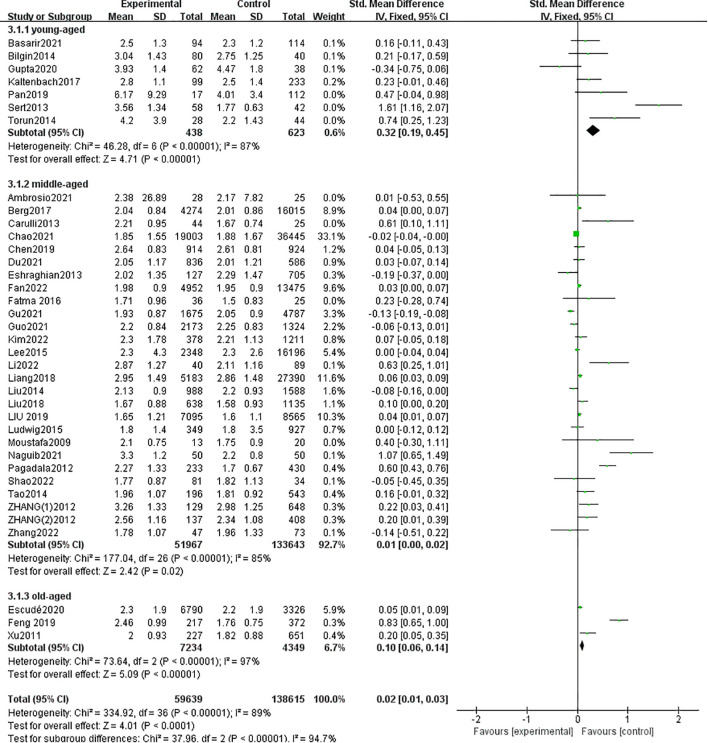 Figure 2
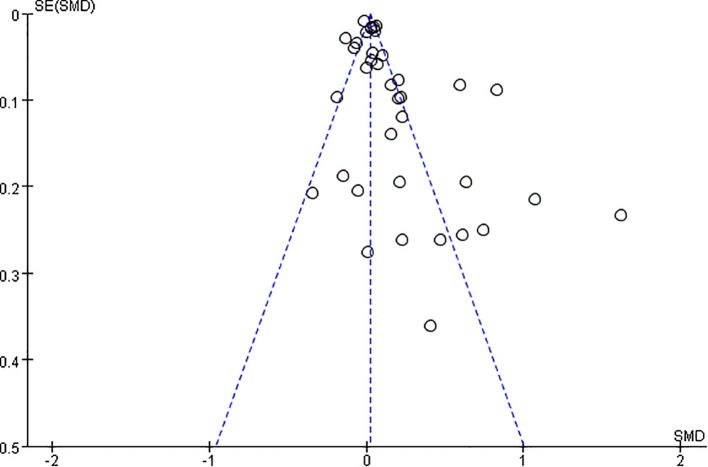 Figure 3
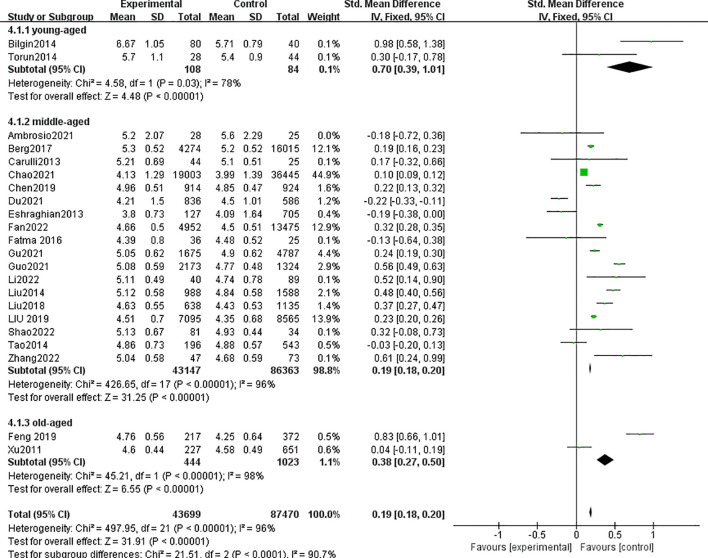 Figure 4
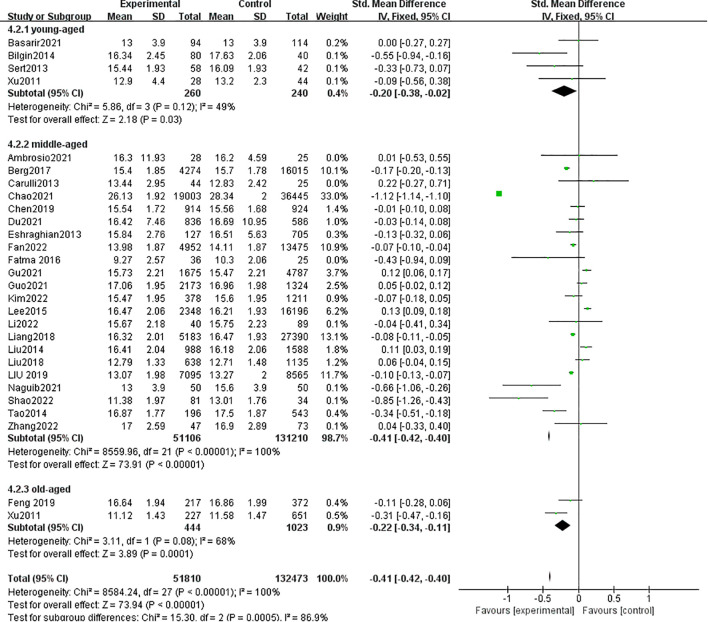 Figure 5
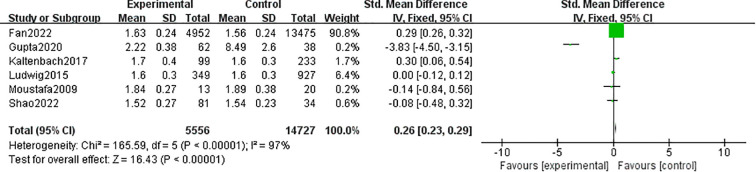 Figure 6
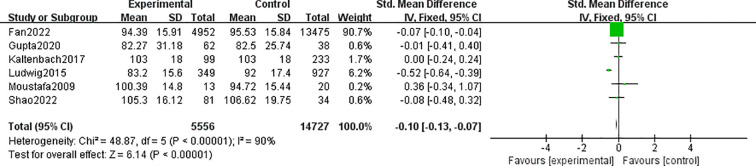 Figure 7
| First author(Year) | Country | Study design | No. participants | Enrollment period | Diagnosis of MALFD | Thyroid function parameters |
|---|---|---|---|---|---|---|
| Ambrosio 2021 | Italy | Cross-sectional study | 53 | 2014−2016 | liver biopsy | TSH, FT3, FT4 |
| Basarir 2021 | Turkey | Cross-sectional study | 208 | 2015.02−2017.02 | ultrasonography | TSH, FT4 |
| Berg 2017 | Netherlands | Cross-sectional study | 20289 | NA | ultrasonography | TSH, FT3, FT4 |
| Bilgin 2014 | Turkey | Cross-sectional study | 120 | 2010.04−2011.06 | ultrasonography | TSH, FT3, FT4 |
| Carulli 2013 | Italy | Case-control study | 69 | 2001−2008 | liver biopsy | TSH, FT3, FT4 |
| Chao 2021 | China | Cross-sectional survey | 55448 | 2017.01−2019.02 | ultrasonography | TSH, FT3, FT4 |
| Chen 2019 | China | Cross-sectional study | 1838 | 2013.04−2016.09 | ultrasonography | TSH, FT3, FT4 |
| Du 2021 | China | Cross-sectional study | 1422 | 2014.12−2019.10 | ultrasonography | TSH, FT3, FT4 |
| Escudé 2020 | Spain | Cross-sectional study | 10116 | 2009−2013 | ultrasonography | TSH |
| Eshraghian 2013 | Iran | Cross-sectional study | 832 | 2011.09−2012.09 | ultrasonography | TSH, FT3, FT4 |
| Fan 2022 | China | Cross-sectional study | 18427 | 2015.01−2021.12 | ultrasonography | TSH, FT3, FT4, TT3, TT4 |
| Fatma 2016 | Turkey | Cross-sectional study | 61 | 2014.7−2015.01 | ultrasonography | TSH, FT3, FT4 |
| Feng 2019 | China | Cross-sectional study | 589 | 2015.01−2017.12 | ultrasonography | TSH, FT3, FT4 |
| Gu 2021 | China | Cross-sectional study | 6462 | 2013−2019. | ultrasonography | TSH, FT3, FT4 |
| Guo 2021 | China | Cross-sectional study | 3497 | 2017.11−2019.12 | ultrasonography | TSH, FT3, FT4 |
| Gupta 2020 | India | Cross-sectional study | 100 | 2018.09−2019.10 | ultrasonography | TSH, TT3, TT4 |
| Kaltenbach 2017 | Germany | Cross-sectional study | 332 | 2000.02−2001.05 | ultrasonography | TSH, TT3, TT4 |
| Kim 2022 | Korea | Cross-sectional study | 1589 | 2013.01−2015.12 | ultrasonography | TSH, FT4 |
| Lee 2015 | Korea | Cohort study | 18544 | 2008.01−2012.12 | ultrasonography | TSH, FT4 |
| Li 2022 | China | Cross-sectional study | 129 | 2017.01−2021.01 | liver biopsy | TSH, FT3, FT4 |
| Liang 2018 | China | Cross-sectional study | 32573 | 2016.01−2016.12 | ultrasonography | TSH, FT4 |
| Liu 2014 | China | Cross-sectional study | 2576 | 2013.01−2013.11 | ultrasonography | TSH, FT3, FT4 |
| Liu 2018 | China | Cross-sectional study | 1773 | 2015.01−2015.12 | ultrasonography | TSH, FT3, FT4 |
| LIU 2019 | China | Cross-sectional study | 15660 | 2013.01−2018.10 | ultrasonography | TSH, FT3, FT4 |
| Ludwig 2015 | Germany | Cross-sectional study | 1276 | NA | ultrasonography | TSH, TT3, TT4 |
| Moustafa 2009 | Egypt | Case-control study | 33 | NA | ultrasonography | TSH, TT3, TT4 |
| Naguib 2021 | Egypt | Case-control study | 100 | NA | liver biopsy | TSH, FT4 |
| Pagadala 2012 | USA | Case-control study | 663 | 2006.10−2009.06 | Liver biopsy | TSH |
| Pan 2019 | China | Cross-sectional study | 129 | 2013−2014 | ultrasonography | TSH |
| Sert 2013 | Turkey | Cross-sectional study | 100 | 2011.04−2012.04 | ultrasonography | TSH, FT4 |
| Shao 2022 | China | cross-sectional study | 115 | 2019.01−2021.10 | computed tomography (CT) | TSH, FT3, FT4, TT3, TT4 |
| Tao 2014 | China | cross-sectional study | 739 | 2012.09−2013.02 | ultrasonography | TSH, FT3, FT4 |
| Torun 2014 | Turkey | Cross-sectional study | 72 | 2011.01−2013.02 | ultrasonography | TSH, FT3, FT4 |
| Xu 2011 | China | Cross-sectional study | 878 | 2008.01−2008.12 | ultrasonography | TSH, FT3, FT4 |
| ZHANG 2012 | China | Cross-sectional study(female) | 777 | 2010.01 to 2010.04 | ultrasonography | TSH |
| Cross-sectional study | 545 | 2010.01 to 2010.04 | ultrasonography | TSH | ||
| Zhang 2022 | China | Cross-sectional study | 120 | 2016.01 to 2022.09 | ultrasonography | TSH, FT3, FT4 |
| First author(Year) | Groups | Age | No. Pts | TSH (mIU/l) | FT3 (pmol/l) | FT4 (pmol/l) | TT3 (nmol/l) | TT4 (nmol/l) |
|---|---|---|---|---|---|---|---|---|
| Ambrosio 2021 | NAFLD | 58±28.9 | 28 | 2.38±26.89 | 5.2±2.07 | 16.3±11.93 | NA | NA |
| NO-NAFLD | 52±32.59 | 25 | 2.17±7.82 | 5.6±2.29 | 16.2±4.59 | NA | NA | |
| Basarir 2021 | NAFLD | 12.6±2.6 | 94 | 2.5±1.3 | NA | 13±3.9 | NA | NA |
| NO-NAFLD | 10.8±2.7 | 114 | 2.3±1.2 | NA | 13±3.9 | NA | NA | |
| Berg 2017 | NAFLD | 46±8.89 | 4274 | 2.04±0.84 | 5.3±0.52 | 15.4±1.85 | NA | NA |
| NO-NAFLD | 42±11.85 | 16015 | 2.01±0.86 | 5.2±0.52 | 15.7±1.78 | NA | NA | |
| Bilgin 2014 | NAFLD | 12.68±2.13 | 80 | 3.04±1.43 | 6.67±1.05 | 16.34±2.45 | NA | NA |
| NO-NAFLD | 11.90±2.52 | 40 | 2.75±1.25 | 5.71±0.79 | 17.63±2.06 | NA | NA | |
| Carulli 2013 | NAFLD | 44.41 ±11.43 | 44 | 2.21±0.95 | 5.21±0.69 | 13.44±2.95 | NA | NA |
| NO-NAFLD | 44.40 ±11.38 | 25 | 1.67±0.74 | 5.1±0.51 | 12.83±2.42 | NA | NA | |
| Chao 2021 | NAFLD | 48.8 ±9.79 | 19003 | 1.85±1.55 | 4.13±1.29 | 26.13±1.92 | NA | NA |
| NO-NAFLD | 46.0 ±10.7 | 36445 | 1.88±1.67 | 3.99±1.39 | 28.34±2 | NA | NA | |
| Chen 2019 | NAFLD | 57.3±6.4 | 914 | 2.64±0.83 | 4.96±0.51 | 15.54±1.72 | NA | NA |
| NO-NAFLD | 56.8±6.6 | 924 | 2.61±0.81 | 4.85±0.47 | 15.56±1.68 | NA | NA | |
| Du 2021 | MAFLD | 53.07±13.32 | 836 | 2.05±1.17 | 4.21±1.5 | 16.42±7.46 | NA | NA |
| NO-MAFLD | 57.28±12.13 | 586 | 2.01±1.21 | 4.5±1.01 | 16.69±10.95 | NA | NA | |
| Escudé 2020 | NAFLD | 60±10 | 6790 | 2.3±1.9 | NA | NA | NA | NA |
| NO-NAFLD | 61±10 | 3326 | 2.2±1.9 | NA | NA | NA | NA | |
| Eshraghian 2013 | NAFLD | 48.20±12.82 | 127 | 2.02±1.35 | 3.8±0.73 | 15.84±2.76 | NA | NA |
| NO-NAFLD | 36.97 ±18.76 | 705 | 2.29±1.47 | 4.09±1.64 | 16.51±5.63 | NA | NA | |
| Fan 2022 | MAFLD | 51.09±15.78 | 4952 | 1.98±0.9 | 4.66±0.5 | 13.98±1.87 | 1.63±0.24 | 94.39±15.91 |
| NO-MAFLD | 45.59±16.13 | 13475 | 1.95±0.9 | 4.5±0.51 | 14.11±1.87 | 1.56±0.24 | 95.53±15.84 | |
| Fatma 2016 | NAFLD | 49.78 ±12.77 | 36 | 1.71±0.96 | 4.39±0.8 | 9.27±2.57 | NA | NA |
| NO-NAFLD | 46.52 ±13.80 | 25 | 1.5±0.83 | 4.48±0.52 | 10.3±2.06 | NA | NA | |
| Feng 2019 | NAFLD | 64.42±13.68 | 217 | 2.46±0.99 | 4.76±0.56 | 16.64±1.94 | NA | NA |
| NO-NAFLD | 72.60±14.56 | 372 | 1.76±0.75 | 4.25±0.64 | 16.86±1.99 | NA | NA | |
| Gu 2021 | MAFLD | 51.50±7.90 | 1675 | 1.93±0.87 | 5.05±0.62 | 15.73±2.21 | NA | NA |
| NO-MAFLD | 51.0±8.48 | 4787 | 2.05±0.9 | 4.9±0.62 | 15.47±2.21 | NA | NA | |
| Guo 2021 | NAFLD | 49.49 ± 9.86 | 2173 | 2.2±0.84 | 5.08±0.59 | 17.06±1.95 | NA | NA |
| NO-NAFLD | 49.28 ±10.46 | 1324 | 2.25±0.83 | 4.77±0.48 | 16.96±1.98 | NA | NA | |
| Gupta 2020 | NAFLD | 10.52±2.2 | 62 | 3.93±1.4 | NA | NA | 2.22±0.38 | 82.27±31.18 |
| NO-NAFLD | 9.32±2.4 | 38 | 4.47±1.8 | NA | NA | 8.49±2.6 | 82.5±25.74 | |
| Kaltenbach2017 | NAFLD | 14.1±1.9 | 99 | 2.8±1.1 | NA | NA | 1.7±0.4 | 103±18.0 |
| NO-NAFLD | 13.9±1.8 | 233 | 2.5±1.4 | NA | NA | 1.6±0.3 | 103±18 | |
| Kim 2022 | NAFLD | 55±7.41 | 378 | 2.3±1.78 | NA | 15.47±1.95 | NA | NA |
| NO-NAFLD | 56 ±7.41 | 1211 | 2.21±1.13 | NA | 15.6±1.95 | NA | ||
| Lee 2015 | NAFLD | 39.2±5.9 | 2348 | 2.3±4.3 | NA | 16.47±2.06 | NA | NA |
| NO-NAFLD | 37.8±5.7 | 16196 | 2.3±2.6 | NA | 16.21±1.93 | NA | NA | |
| Li 2022 | NAFLD | 51.5±14.07 | 40 | 2.87±1.27 | 5.11±0.49 | 15.67±2.18 | NA | NA |
| NO-NAFLD | 43.0 ±20.74 | 89 | 2.11±1.16 | 4.74±0.78 | 15.75±2.23 | NA | NA | |
| Liang 2018 | NAFLD | 48.8±13.4 | 5183 | 2.95±1.49 | NA | 16.32±2.01 | NA | NA |
| NO-NAFLD | 43.23±13.7 | 27390 | 2.86±1.48 | NA | 16.47±1.93 | NA | NA | |
| Liu 2014 | NAFLD | 46.90± 9.41 | 988 | 2.13±0.9 | 5.12±0.58 | 16.41±2.04 | NA | NA |
| NO-NAFLD | 44.42±10.74 | 1588 | 2.2±0.93 | 4.84±0.58 | 16.18±2.06 | NA | NA | |
| Liu 2018 | NAFLD | 50.42±8.90 | 638 | 1.67±0.88 | 4.63±0.55 | 12.79±1.33 | NA | NA |
| NO-NAFLD | 49.30±11.36 | 1135 | 1.58±0.93 | 4.43±0.53 | 12.71±1.48 | NA | NA | |
| LIU 2019 | NAFLD | 49.3±10.2 | 7095 | 1.65±1.21 | 4.51±0.7 | 13.07±1.98 | NA | NA |
| NO-NAFLD | 47.3±11.9 | 8565 | 1.6±1.1 | 4.35±0.68 | 13.27±2 | NA | NA | |
| Ludwig 2015 | NAFLD | 47.7 ± 11.5 | 349 | 1.8±1.4 | NA | NA | 1.6±0.3 | 83.2±15.6 |
| NO-NAFLD | 38.0 ± 12.1 | 927 | 1.8±3.5 | NA | NA | 1.6±0.3 | 92±17.4 | |
| Moustafa 2009 | NAFLD | 55±4.6 | 13 | 2.1±0.75 | NA | NA | 1.84±0.27 | 100.39±14.8 |
| NO-NAFLD | 51±9.3 | 20 | 1.75±0.9 | NA | NA | 1.89±0.38 | 94.72±15.44 | |
| Naguib 2021 | NAFLD | 47.9 ±3 | 50 | 3.3±1.2 | NA | 13±3.9 | NA | NA |
| NO-NAFLD | 45.7 ±4 | 50 | 2.2±0.8 | NA | 15.6±3.9 | NA | NA | |
| Pagadala 2012 | NAFLD | 50.4±11.1 | 233 | 2.27±1.33 | NA | NA | NA | NA |
| NO-NAFLD | 51.0 ±14.1 | 430 | 1.7±0.67 | NA | NA | NA | NA | |
| Pan 2019 | NAFLD | 12.47 ± 3.24 | 17 | 6.17±9.29 | NA | NA | NA | NA |
| NO-NAFLD | 11.97 ± 3.39 | 112 | 4.01±3.4 | NA | NA | NA | NA | |
| Sert 2013 | NAFLD | 13.13 ± 1.26 | 58 | 3.56±1.34 | NA | 15.44±1.93 | NA | NA |
| NO-NAFLD | 13.65 ± 1.4 | 42 | 1.77±0.63 | NA | 16.09±1.93 | NA | NA | |
| Shao 2022 | NAFLD | 44±15.56 | 81 | 1.77±0.87 | 5.13±0.67 | 11.38±1.97 | 1.52±0.27 | 105.3±16.12 |
| NO-NAFLD | 34±12.59 | 34 | 1.82±1.13 | 4.93±0.44 | 13.01±1.76 | 1.54±0.23 | 106.62±19.75 | |
| Tao 2014 | NAFLD | 48.9± 8.4 | 196 | 1.96±1.07 | 4.86±0.73 | 16.87±1.77 | NA | NA |
| NO-NAFLD | 47.5± 8.1 | 543 | 1.81±0.92 | 4.88±0.57 | 17.5±1.87 | NA | NA | |
| Torun 2014 | NAFLD | 12.2 ±3.6 | 28 | 4.2±3.9 | 5.7±1.1 | 12.9±4.4 | NA | NA |
| NO-NAFLD | 12.8 ±1.7 | 44 | 2.2±1.43 | 5.4±0.9 | 13.2±2.3 | NA | NA | |
| Xu 2011 | NAFLD | 71.2±3.8 | 227 | 2±0.93 | 4.6±0.44 | 11.12±1.43 | NA | NA |
| NO-NAFLD | 71.9±4.2 | 651 | 1.82±0.88 | 4.58±0.49 | 11.58±1.47 | NA | NA | |
| ZHANG 2012(1) | NAFLD | NA | 129 | 3.26±1.33 | NA | NA | NA | NA |
| (female) | NO-NAFLD | NA | 648 | 2.98±1.25 | NA | NA | NA | NA |
| ZHANG 2012(2) | NAFLD | NA | 137 | 2.56±1.16 | NA | NA | NA | NA |
| (male) | NO-NAFLD | NA | 408 | 2.34±1.08 | NA | NA | NA | NA |
| Zhang 2022 | MAFLD | 57±8.89 | 47 | 1.78±1.07 | 5.04±0.58 | 17±2.59 | NA | NA |
| NO-MAFLD | 55±12.59 | 73 | 1.96±1.33 | 4.68±0.59 | 16.9±2.89 | NA | NA |
Peer Reviews
No public reviews on file for this paper yet. If you reviewed it on a platform where reviews are public (OpenReview, ICLR, NeurIPS, ICML), you can paste yours below so the community can read it here.
Videos
No videos yet. Explain this paper in a talk, walkthrough, or lecture? Add one.
Taxonomy
TopicsThyroid Disorders and Treatments · Liver Disease Diagnosis and Treatment · Growth Hormone and Insulin-like Growth Factors
Introduction
1
Metabolic dysfunction–associated fatty liver disease (MAFLD) encompasses a range of liver diseases closely related to abnormal metabolic disorders. It is considered a hepatic manifestation of the metabolic syndrome (1). MAFLD is characterized by hepatic steatosis (detected by imaging techniques, blood biomarkers/scores, or liver histology) associated with type 2 diabetes mellitus (T2DM) and overweight/obesity, regardless of alcohol intake or excluding other causes of chronic liver disease (2). The introduction of the new concept of MAFLD aims to include metabolic dysfunction as a diagnostic criterion and covers a larger and more diverse population than non-alcoholic fatty liver disease (NAFLD) (3). A meta-analysis involving 3.3 million people revealed that the global prevalence of MAFLD was 38.77% (4). Compared with the general population, patients with MAFLD experience higher liver-related morbidity or mortality and are strongly associated with extrahepatic diseases such as cancer, cardiovascular events, stroke, chronic kidney disease, and obstructive sleep apnea (5–8).
The rationale for MAFLD is to include metabolic dysfunction as a diagnostic criterion, including abdominal obesity and T2DM. The thyroid gland regulates body weight, lipid-like substance metabolism, and insulin resistance. Therefore, thyroid hormone may be closely related to the occurrence and development of MAFLD (9). However, the relationship between MAFLD and thyroid function still remains controversial. Three published meta-analyses have explored the relationship between NAFLD and thyroid function, but their findings were inconsistent (10–12). The patients with NAFLD/NASH had significantly higher thyroid-stimulating hormone (TSH) levels than controls in adults. Previous studies found no significant difference in thyroid hormone levels between patients with NAFLD and non-NAFLD. This might be mainly attributed to the heterogeneity of sample sizes and patient characteristics. MAFLD covers a much broader spectrum, and no studies demonstrating an association between MAFLD and thyroid function parameters have been reported. Therefore, this study conducted a new systematic review and meta-analysis, including a lot of research and exploration of several thyroid function parameters [free triiodothyronine (FT3), free thyroxine (FT4), total triiodothyronine (TT3), total thyroxine (TT4), and TSH levels].
Methods
2
Protocol
2.1
This systematic review and meta-analysis was conducted based on the meta-analysis of observational studies following epidemiology guidelines.
Eligibility criteria
2.2
The inclusion criteria were as follows: (1) original studies that explored the association between MAFLD, NAFLD, and NASH with thyroid function; (2) studies independent of sex and age; and (3)studies in which MAFLD was diagnosed by histology (liver biopsy), imaging modalities (such as ultrasonography, CT, or MRI), or validated biochemical indices. The exclusion criteria were as follows: (1) reviews and meta-analyses, (2) irrelevant pieces of literature, (3) duplicate studies, (4) experimental studies, (5) editorials/comments and case reports, and (6) original studies including patients with MAFLD/NAFLD/NASH but with competing etiologies for steatosis and coexisting causes for other chronic liver diseases, such as significant alcohol consumption, hepatitis C, and medications.
Search strategy
2.3
We searched the PubMed, Embase, Web of Science, CNKI, and Cochrane Library databases from the inception dates to March 1, 2025, with no restrictions on language. Conference abstracts were hand searched to identify potentially eligible studies. The search strategy was as follows: (“MAFLD” [All Fields] OR “Metabolic associated fatty liver disease” [All Fields]) OR (“NASH” [All Fields] OR “Nonalcoholic Steatohepatitis” [All Fields]) OR (“NAFLD” [All Fields] OR “Non-alcoholic Fatty Liver Disease” [All Fields]) AND (“thyroid” [All Fields] OR “thyroid-stimulating hormone” [All Fields] OR “free thyroxine” [All Fields] OR “free triiodothyronine” [All Fields] OR “total triiodothyronine” [All Fields] OR “total thyroxine” [All Fields]).
Study selection
2.4
Two reviewers (J.T. and C.C.) independently screened the studies based on the titles and abstracts. If the studies were potentially fit, full texts were further retrieved and screened. Disagreements were resolved by consensus.
Data extraction
2.5
Two reviewers (J.T. and C.C.) extracted all the data independently. We extracted the following data from each study: study characteristics, first author, year of publication, country, study design, study population, number of participants, age, MAFLD diagnosis, and thyroid function parameters (TSH, FT3, FT4, TT3, and TT4). If necessary, the reviewers contacted for relevant data.
If some data were expressed as mean with a 95% confidence interval (CI) alone, the methods provided by the Cochrane Handbook were used to calculate the standard deviation (SD). The formula used is as follows:
If some data were expressed as median with range or interquartile range alone, the methods provided by Wan et al. (13) and Luo et al. (14) were used to estimate the mean and SD. All formulas are available on the website http://www.comp.hkbu.edu.hk/∼xwan/MedianRange.html.
Statistical analysis
2.6
The association of MAFLD/NASH/NAFLD with thyroid function parameters (including FT3, FT4, TT3, TT4, and TSH) was assessed. For continuous data, standardized mean difference (SMD) with 95% CI was calculated using the inverse variance statistical method. For dichotomous variable data, the odds ratio (OR) with 95% CI was calculated using the Mantel–Haenszel statistical method. The data were pooled using a random-effects model to obtain a more conservative effect estimate. The I ^2^ statistic and Q test were used to measure the heterogeneity across the included studies, where I ^2^ >50% and P value <0.1 were considered to be of significant heterogeneity. If more than five eligible studies were included in a meta-analysis, the publication bias was assessed using funnel plots. All statistical analyses were performed using Review Manager version 5.2 software.
Results
3
Study selection
3.1
A total of 1246 studies were retrieved, 36 studies were eligible (Figure 1). MAFLD was diagnosed by hepatic steatosis (including imaging techniques, blood biomarkers/scores, or liver histological tests). Patients without MAFLD rather than healthy individuals were randomly selected as controls. Ultimately, 198,254 participants were included in the quantitative analysis.
Study screening flow chart.
Study characteristics
3.2
The characteristics of the 36 included studies are depicted(Table 1). Among these, 7 were cohort studies (15–21), 25 were cross-sectional studies (22–46), and 4 were case–control studies (47–50). These clinical trials were conducted globally: 6 in Europe [Germany (23, 26), Italy (18, 47), Netherlands (30), and Spain (39)], 28 in Asia (5 in Turkey (15–17, 27, 29), 2 in South Korea (24, 36), 1 in India (20), 1 in Iran (22), 19 in China [19, 21, 25, 28, 31–35, 37, 38, 40–46)], 2 in Africa [Egypt (48, 50)], and 1 in the United States (49). MAFLD was diagnosed by different methods: through liver biopsies in 5 studies (18, 37, 47, 49, 50), through computed tomography (CT) in 1 study (41), and through ultrasound technology in 31 studies. All the 36 included studies reported detailed data regarding thyroid function parameters (Table 2). All studies reported detailed data on the TSH parameter, 22 studies reported data on the FT3 parameter, 28 on the FT4 parameter, and 6 on the TT3 and TT4 parameters.
Thyroid-stimulating hormone
3.2.1
A total of 36 studies with 198,254 patients were included in the meta-analysis. The patients with MAFLD had significantly higher levels of TSH than controls (SMD = 0.02; 95% CI = 0.01, 0.03; P < 0.001) (Figure 2). Heterogeneity was statistically significant (I ^2^ = 89%, P < 0.001). The publication bias was not statistically significant (Figure 3). Meanwhile, it was found that compared with the controls, the patients with MAFLD had significantly higher levels of TSH in the children/youth group according to the age subgroup analysis (SMD = 0.32, 95% CI = 0.19, 0.045, P < 0.001); no significant difference was observed in the level of TSH in the middle-aged group (SMD = 0.01, 95% CI = 0.00, 0.02, P = 0.02); and significantly higher levels of TSH was observed in the elderly group (SMD = 0.10, 95% CI = 0.06, 0.14, P < 0.001).
Forest plot comparing the TSH between MAFLD and no-MAFLD.
Funnel plot comparing the TSH between MAFLD and no-MAFLD.
Free triiodothyronine
3.2.2
A total of 22 studies with 121,169 patients were included in the meta-analysis. The patients with MAFLD had significantly higher levels of FT3 than controls (SMD = 0.19, 95% CI = 0.18, 0.20, P < 0.001) (Figure 4). Heterogeneity was statistically significant (I ^2^ = 89%, P < 0.001). Compared with the controls, the patients with MAFLD had significantly higher levels of FT3 in the children/youth group (SMD = 0.70, 95% CI = 0.39, 1.01, P < 0.001); the middle-aged group (SMD = 0.19, 95% CI = 0.18, 0.2, P < 0.001); and the elderly group (SMD = 0.38, 95% CI = 0.27, 0.50, P < 0.001).
Forest plot comparing the FT3 between MAFLD and no-MAFLD.
Free thyroxine
3.2.3
A total of 28 studies with 184,283 patients were included in the meta-analysis. The patients with MAFLD had significantly lower levels of FT4 than controls (SMD = −0.41, 95% CI = −0.42, −0.40, P < 0.001) (Figure 5). Heterogeneity was statistically significant (I ^2^ = 100%, P < 0.001). Compared with controls, the patients with MAFLD had significantly lower levels of FT4 in the children/youth group (SMD = −0.20, 95% CI = −0.38, −0.02, P < 0.03); the middle-aged group (SMD = −0.41, 95% CI = −0.42, −0.40, P < 0.001); and the elderly group (SMD = −0.22, 95% CI = −0.34, −0.11, P < 0.001).
Forest plot comparing the FT4 between MAFLD and no-MAFLD.
Total triiodothyronine
3.2.4
A total of 6 studies with 20,283 patients were included in the meta-analysis. The patients with MAFLD had significantly higher levels of TT3 than controls (SMD = 0.26, 95% CI = 0.23, 0.29, P < 0.001) (Figure 6). Heterogeneity was statistically significant (I ^2^ = 97%, P < 0.001).
Forest plots comparing the TT3 between MAFLD and no-MAFLD.
Total thyroxine
3.2.5
A total of 6 studies involving 20,283 patients were included in the meta-analysis. The patients with MAFLD had significantly lower levels of TT3 than controls (SMD = −0.10; 95% CI = −0.13, −0.07; P < 0.001) (Figure 7). Heterogeneity was statistically significant (I ^2^ = 90%, P < 0.001).
Forest plots comparing the TT4 between MAFLD and no-MAFLD.
Discussion
4
A total of 36 studies with 198,254 participants were included in the systematic review and meta-analysis. The findings revealed the following. (1) Increased TSH levels were significantly associated with a higher risk of MAFLD. However, no significant difference in the TSH level was found between the patients with MAFLD and the controls in the middle-aged population. In the adolescent and elderly population, the TSH level of patients with MAFLD significantly differed from that of the controls. (2) The increased levels of FT3 and TT3 were significantly associated with the risk of MAFLD in all populations. (3) The decreased levels of TT4 and FT4 were significantly associated with the risk of MAFLD in all populations.
The “second strike” hypothesis has been widely considered to be the classical pathogenesis of MAFLD. The progressive accumulation of lipids in the cytoplasm of hepatocytes triggers a cytotoxic event that triggers an inflammatory response. The liver, being the central organ regulating endocrine function and maintaining triglyceride metabolism, plays a crucial role. Abnormal triglyceride accumulation in hepatocytes forms fatty liver. Some studies have shown a positive correlation between TSH and triglyceride concentrations (51, 52), even within the normal reference range (53). TSH might play a key role in regulating triglycerides and cholesterol, thus promoting the development of MAFLD (54).
In terms of pathophysiology, the presence of thyroid hormones can contribute to the development of MAFLD through multiple pathways. Thyrotropin hormone regulates the thyrotropin receptor (TSHR) through highly specific interactions with thyroxine. TSHR is expressed primarily on the cell membrane of thyroid follicular cells and is also expressed to varying degrees in numerous extrathyroidal tissues and cells, such as liver, kidney, bone, adipose tissue, and fibroblasts (55, 56). The binding of TSH to TSHR on hepatocytes can increase triglyceride levels, leading to hepatic steatosis. Thus, the potential mechanism of TSH-induced hepatic triglyceride accumulation involves the binding of TSH to its receptor TSHR, which then triggers hepatic Sterol Regulatory Element Binding Protein-1c(SREBP-1c)activity via the cAMP/PKA/PPARa pathway, resulting in reduced AMPK activity and increased expression of genes associated with insulin resistance and adipogenesis (57). Meanwhile, another study showed that TSH could be involved in intrahepatic lipolysis by the activation of autophagy and β-oxidation of fatty acids (58). Thus, elevated TSH levels indicated hypothyroidism and reduced activity of hepatic lipase, leading to fat cell accumulation in hepatocytes (59). A study demonstrated that foreign bodies from TSH-stimulated hepatocytes increased and showed specific protein profile changes, many of which were involved in metabolism, signal transduction, apoptosis, and inflammation (60). TSH is also associated with the regulation of microrne (61). Adipokine levels were altered in patients with hypothyroidism (62). Recently, a high TSH level was significantly correlated with NASH in individuals with normal thyroid function and NAFLD confirmed by biopsy (63). In this study, TSH increased the risk of MAFLD significantly. However, the results of this study were controversial. The subgroup analysis in this study showed no significant association between TSH and MAFLD in the middle-aged population, but found an association between TSH and MAFLD in adolescents and older adults.
A feedback loop exists between TSH and thyroid gland in the body. An increase in the level of TSH usually suggests a low thyroid function (i.e., hypothyroidism) (12). Ferrandino et al. demonstrated the development of NAFLD in mice with mild hypothyroidism without the downregulation of hepatic TH signaling or reduced hepatic lipid utilization. This condition led to an increased shuttling of fatty acids (FAs) to the liver, where they were esterified and accumulated as triglycerides. On the contrary, mice with severe hypothyroid exhibited a downregulation of hepatic TH signaling and a severe inhibition of adipose tissue lipolysis, which reduced the delivery of FAs to the liver. The resulting lack of triglyceride esterification substrates protected mice with severely hypothyroid against NAFLD (64). We speculated that MAFLD was induced by insufficient release of TSH in adolescents and the elderly, when the thyroid was immature or in the process of degeneration, respectively. In adults, the pituitary-thyroid axis may be mature enough to maintain adequate TSH secretion, which helps regulate lipid metabolism in the liver.The association between TSH and MAFLD might be influenced by age. Selin et al. demonstrated that children with metabolic disease had lower levels of FT4 and higher levels of TSH than normal children (65). Gu et al. found that FT3 was a higher risk factor for NAFLD than those without NAFLD, while FT4 and TSH were not significantly correlated with NAFLD in middle-aged and elderly people (age >40) (46). This also explained why such a wide divergence was observed in the existing studies, with some suggesting no association and others suggesting an association. This might depend on the age distribution of the population included in previous studies and the differences in TSH concentrations.
The thyroid hormone receptor (TR) is of two types, TRα and TRβ, and it is the main receptor in the liver (66). Studies have shown that M1 macrophages polarizably induce secreted phosphoprotein 1 (SPP1) secretion and downregulate hepatocyte TRβ in a paracrine manner, exacerbating lipid deposition in the liver and compensating for increased serum TSH. Increased levels of TSH can lead to SPP1 secretion by M1 macrophages. The positive feedback interaction between the thyroid and liver may play a significant role in maintaining and amplifying the pathological process of MAFLD (67). Therefore, TRβ agonists have been investigated as potential therapies for serum dyslipidemia and MAFLD (68). Chaves et al. demonstrated that mutations in the THR-beta gene of TR can induce that signal transduction damage in the liver, leading to hepatic steatosis. This indicates the influence of thyroid hormones on lipid metabolism in the liver (69). Our findings supported the effect of thyroxine on MAFLD. This study found that elevated levels of FT3 and TT3 were significantly associated with the risk of MAFLD, and decreased levels of TT4 and FT4 were significantly associated with the risk of MAFLD. Further clinical studies are needed to investigate whether TSH affects FT3, FT4, TT3, and TT4 and thus MAFLD.
In addition, recent evidence suggests that thyroid dysfunction may not only be associated with hepatic steatosis but also with ectopic fat deposition outside the liver. For example, Bayyigit et al. (Diabetes Metab Res Rev, 2024) reported that both hypothyroidism and subclinical hypothyroidism were significantly associated with an increased prevalence of non-alcoholic fatty pancreas disease (NAFPD) as well as MAFLD. Their findings indicate a potential bidirectional relationship between thyroid dysfunction and ectopic fat accumulation, further underscoring the need for future studies to comprehensively investigate the interplay among hypothyroidism, MAFLD, and NAFPD.
In conclusion, TSH plays a key role in the development and progression of MAFLD and may be influenced by age, which needs to be further elucidated by more clinical trials in different age groups. As thyroid replacement therapy improves elevated TSH levels, whether treating hypothyroidism in patients with MAFLD improves liver function or disease progression outcomes should be further elucidated by placebo-controlled clinical trials.
This study had some limitations. First, heterogeneity was significant in some meta-analyses. We tried to explore heterogeneity between studies through sensitivity and meta-regression analyses and pooled data through random-effects models to obtain more conservative effect estimates. Second, several noninvasive methods [e.g., elevated liver enzymes, fatty liver index, ultrasonography, CT magnetic resonance imaging, and spectroscopy] were commonly used to diagnose MAFLD because liver biopsy was not feasible in the general population (70). While liver biopsy remains the diagnostic gold standard, non-invasive approaches such as the Hepatic Steatosis Index or FibroScan, although practical, may introduce a degree of misclassification bias compared with histology, and this potential bias should be considered when interpreting our results.Third, we did not perform a subgroup analysis of TSH concentration because the upper normal limit of TSH concentration had long been controversial, and the diagnosis of subclinical hypothyroidism depended crucially on the definition of the upper normal limit of TSH concentration (71). We only compared TSH values between the MAFLD and the controls, irrespective of whether the population had hypothyroidism.
The reference list from the paper itself. Each links out to its DOI / PubMed record.
- 1Pipitone RM Ciccioli C Infantino G La Mantia C Parisi S Tulone A . MAFLD: a multisystem disease. Ther Adv Endocrinol Metab. (2023) 14:20420188221145549. doi: 10.1177/20420188221145549, PMID: 36726391 PMC 9885036 · doi ↗ · pubmed ↗
- 2Kawaguchi T Tsutsumi T Nakano D Torimura T . MAFLD: Renovation of clinical practice and disease awareness of fatty liver. Hepatol Res. (2022) 52:422–32. doi: 10.1111/hepr.13706, PMID: 34472683 · doi ↗ · pubmed ↗
- 3Mendez-Sanchez N Bugianesi E Gish RG Lammert F Tilg H Nguyen MH . Global multi-stakeholder endorsement of the MAFLD definition. Lancet Gastroenterol Hepatol. (2022) 7:388–90. doi: 10.1016/S 2468-1253(22)00062-0, PMID: 35248211 · doi ↗ · pubmed ↗
- 4Chan KE Koh TJL Tang ASP Quek J Yong JN Tay P . Global prevalence and clinical characteristics of metabolic-associated fatty liver disease: A meta-analysis and systematic review of 10 739–607 individuals. J Clin Endocrinol Metab. (2022) 107:2691–700. doi: 10.1210/clinem/dgac 321, PMID: 35587339 · doi ↗ · pubmed ↗
- 5Xiong KG Ke KY Chen LF Kong JF Lin TS Lin QB . The impact of metabolic dysfunction-associated fatty liver disease on the prognosis of patients with hepatocellular carcinoma after radical resection. Hepatobiliary Pancreat Dis Int. (2022) 22(4):366–72. doi: 10.1016/j.hbpd.2022.04.001, PMID: 35466065 · doi ↗ · pubmed ↗
- 6Pemmasani G Tremaine WJ John S . Su 1399: DOES THE ETIOLOGY OF CIRRHOSIS IMPACT THROMBOEMBOLIC RISK? Gastroenterology. (2022) 162:S–1208-S-1209. doi: 10.1016/s 0016-5085(22)63577-7 · doi ↗
- 7Sun DQ Jin Y Wang TY Zheng KI Rios RS Zhang HY . MAFLD and risk of CKD. Metabolism. (2021) 115:154433. doi: 10.1016/j.metabol.2020.154433, PMID: 33212070 · doi ↗ · pubmed ↗
- 8Wang Y Shen R Ge J . Association between self-reported snoring and metabolic-associated fatty liver disease: A cross-sectional analysis of the NHANES 2017-2018. Sleep Med. (2023) 101:414–20. doi: 10.1016/j.sleep.2022.11.029, PMID: 36516525 · doi ↗ · pubmed ↗