Host Cell-Derived Extracellular Vesicles Regulate Iron Uptake in Recipient Macrophages during Mycobacterium abscessus Infection
Aidaly Daniela Ramos-Wolfley, Charlie A. Speelmon, Jing Zhang, Carlyn M. Guthrie, Olivia L. Clark, Steven D. Hartson, Lin Liu, Xuejuan Tan, Yong Cheng

TL;DR
This study shows that EVs from infected macrophages boost Mycobacterium abscessus growth by increasing iron uptake in recipient cells.
Contribution
EVs from M.ab-infected macrophages enhance bacterial growth through iron regulation, a novel mechanism in host-pathogen interactions.
Findings
M.ab infection increases EV release but does not alter EV size or protein levels.
EVs from infected cells enhance M.ab growth in recipient macrophages.
EVs from infected cells increase iron levels in recipient cells, and this effect is blocked by iron chelation.
Abstract
The role of host cell-derived extracellular vesicles (EVs) in host–pathogen interactions remains to be defined during mycobacterial infection. In this study, we characterized EVs from mouse RAW 264.7 cells uninfected or infected with Mycobacterium abscessus (M.ab), one of the most common nontuberculous mycobacterial (NTM) pathogens in humans. Our results show that M.ab infection increased the release of EVs but had no effect on the size distribution and total protein abundance of EVs from RAW 264.7 cells. Interestingly, EVs released by M.ab-infected RAW 264.7 cells significantly enhanced M.ab growth within recipient macrophages in cell culture. The proteomic analysis found that transferrin receptor was enriched in EVs from M.ab-infected RAW 264.7 cells compared to EVs from uninfected cells. Iron assay further indicates that EVs from M.ab-infected RAW 264.7 cells increased total iron…
Genes, proteins, chemicals, diseases, species, mutations and cell lines named across the full text — each resolved to its canonical identifier and authoritative record.
Click any figure to enlarge with its caption.
 1
1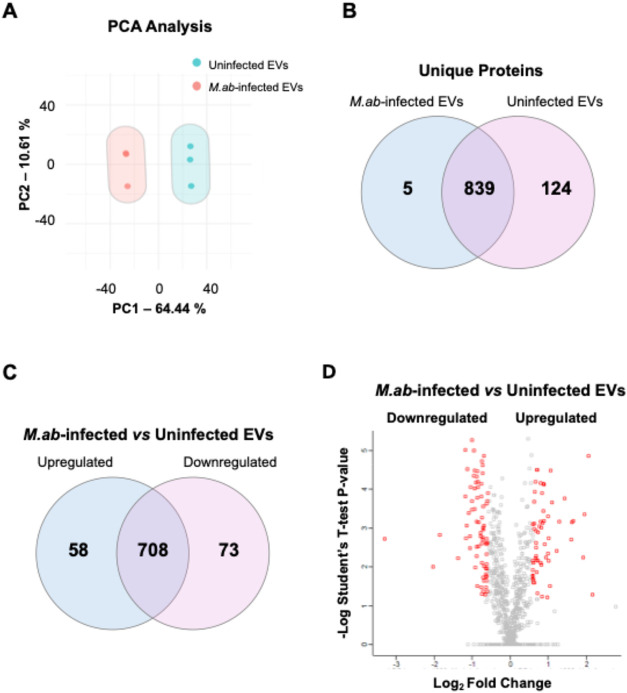 2
2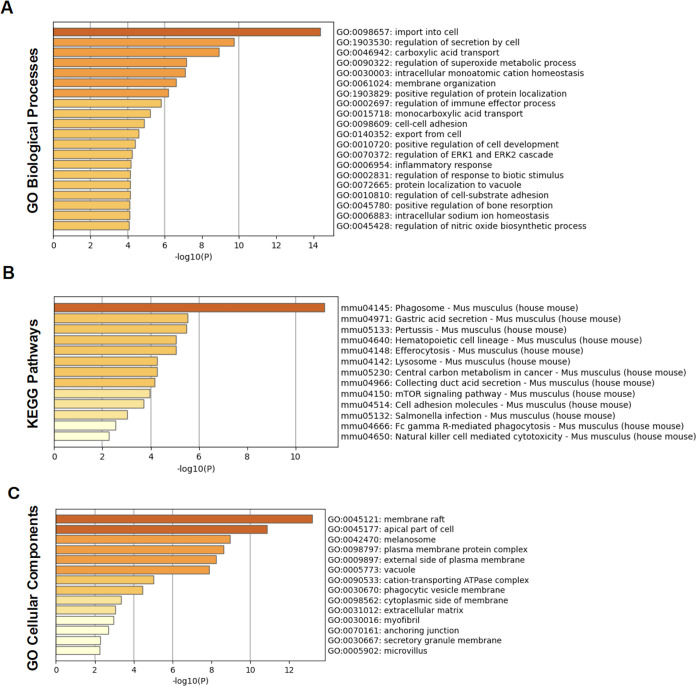 3
3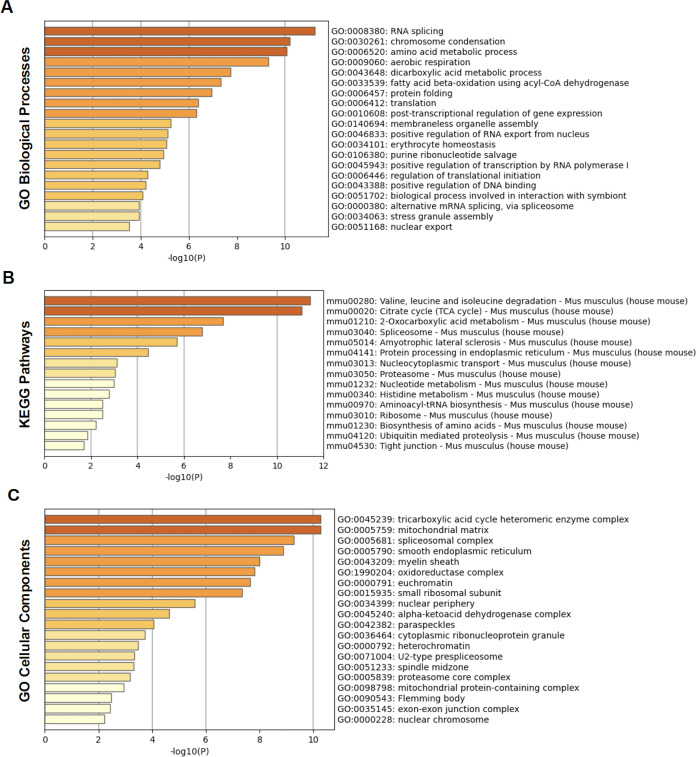 4
4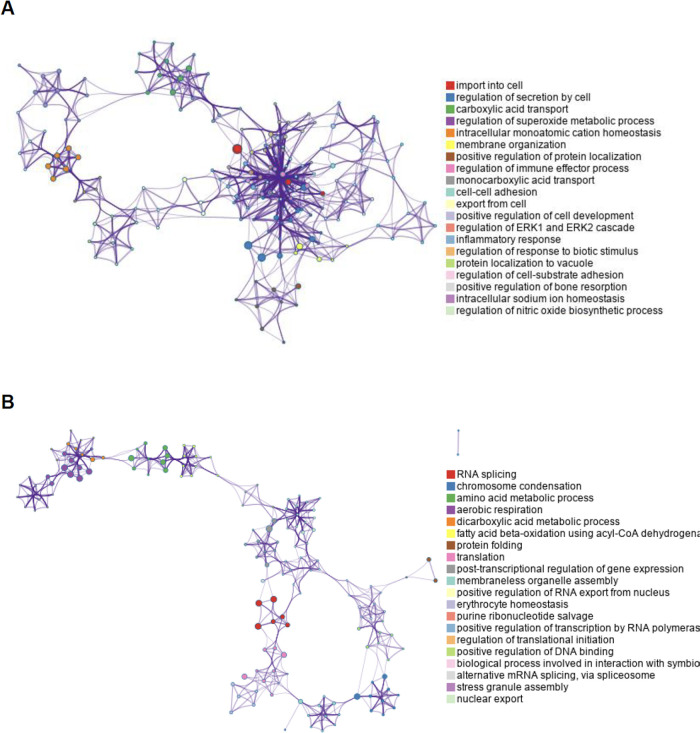 5
5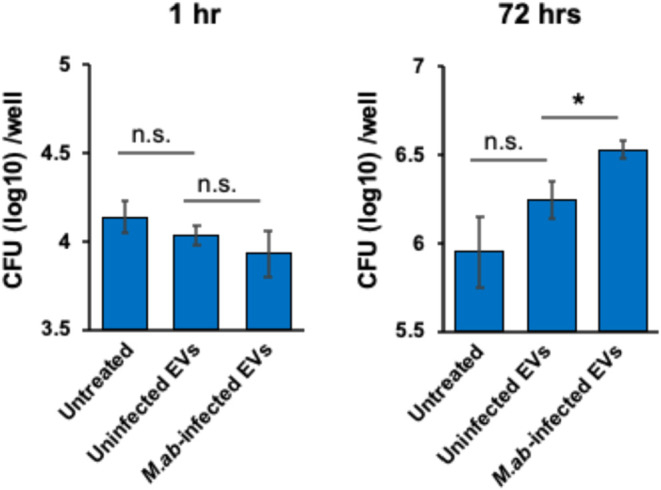 6
6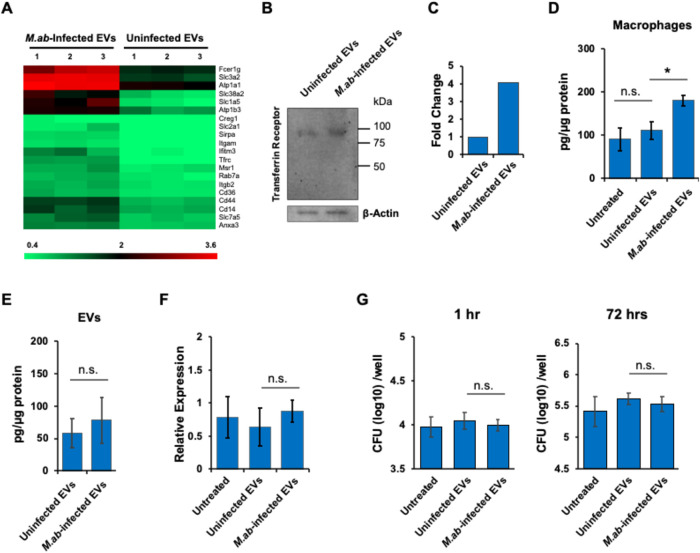 7
7| protein names | gene names | majority protein IDs |
|---|---|---|
| eukaryotic translation initiation factor 3 subunit G | Eif3g | |
| 60S ribosomal protein L9 | Rpl9 | A0A0G2JES3; A0A140T8T4; |
| monocarboxylate transporter 4 | Slc16a3 | |
| peptidyl-prolyl cis–trans isomerase FKBP1A | Fkbp1a | |
| Titin | Ttn | E9Q8N1; E9Q8K5; A0A5K1VVQ9; |
| protein names | gene names | log2 fold change | –log | majority protein IDs |
|---|---|---|---|---|
| osteopontin | Spp1 | 2.04400062561035 | 4.86182826578053 | F8WIP8;
|
| amino acid transporter; neutral amino acid transporter B(0) | Slc1a5 | 1.95211601257324 | 3.36367221600132 | |
| interferon-induced transmembrane protein 3 | Ifitm3 | 1.91171264648438 | 2.24545813289086 | |
| sequestosome-1 | Sqstm1 | 1.64423179626465 | 3.1769883000148 | |
| syndecan-4 | Sdc4 | 1.60978317260742 | 3.15882511676953 | |
| sodium-coupled neutral amino acid transporter 2 | Slc38a2 | 1.60745811462402 | 2.69870716167868 | |
| transferrin receptor protein 1 | Tfrc | 1.41882705688477 | 3.76643410905307 | |
| protein CREG1 | Creg1 | 1.29401397705078 | 3.17269119565696 | |
| translationally controlled tumor protein | Tpt1 | 1.2086181640625 | 2.41398741718999 | |
| CD166 antigen | Alcam | 1.09227561950684 | 3.67095927253926 | E9Q4G8; E9Q3Q6; |
| 4F2 cell-surface antigen heavy chain | Slc3a2 | 1.0536994934082 | 4.48157739560875 | |
| monocarboxylate transporter 1 | Slc16a1 | 1.03939628601074 | 1.51103639520649 | |
| sodium/potassium-transporting ATPase subunit β-3 | Atp1b3 | 1.00730323791504 | 2.74039954586684 | |
| ragulator complex protein LAMTOR5 | Lamtor5 | 1.00613212585449 | 2.15233908237208 | |
| barrier-to-autointegration factor; barrier-to-autointegration factor, N-terminally processed | Banf1 | 0.994245529174805 | 2.34294229387194 | |
| cathepsin B; cathepsin B light chain; cathepsin B heavy chain | Ctsb | 0.993902206420898 | 3.30368678059513 | |
| Rho GDP-dissociation inhibitor 2 | Arhgdib | 0.966434478759766 | 1.22870874764035 | |
| solute carrier family 2, facilitated glucose transporter member 1 | Slc2a1 | 0.941097259521484 | 2.24503649281436 | |
| large neutral amino acids transporter small subunit 1 | Slc7a5 | 0.90849494934082 | 2.58856571327426 | |
| galectin-3-binding protein | Lgals3bp | 0.891365051269531 | 3.18715817835325 | |
| CD44 antigen | Cd44 | 0.885757446289063 | 4.12728429223604 | |
| plexin-B2 | Plxnb2 | 0.870326995849609 | 3.44243533488941 | |
| ragulator complex protein LAMTOR1 | Lamtor1 | 0.862848281860352 | 4.13593216723782 | |
| high affinity immunoglobulin epsilon receptor subunit γ | Fcer1g | 0.854934692382813 | 3.14119873117423 | |
| cyclin-dependent kinase 1 | Cdk1 | 0.838760375976563 | 1.23966001623262 | D3Z2T9; |
| tyrosine-protein phosphatase nonreceptor type substrate 1 | Sirpa | 0.834499359130859 | 3.90919996450559 | |
| integrin α-M | Itgam | 0.821626663208008 | 3.010915191065 | E9Q604; G5E8F1; E9Q5K8; |
| protein S100-A10 | S100a10 | 0.814363479614258 | 2.06035900070648 | |
| CD180 antigen | Cd180 | 0.80729866027832 | 2.10531902779156 | |
| tyrosine-protein kinase Lyn | Lyn | 0.804088592529297 | 3.17309006678365 | |
| basigin | Bsg | 0.797182083129883 | 4.15999122983086 | |
| lysosome-associated membrane glycoprotein 1 | Lamp1 | 0.765460968017578 | 3.04320833845537 | |
| monocyte differentiation antigen CD14 | Cd14 | 0.729209899902344 | 2.889622737452 | |
| prosaposin | Psap | 0.727870941162109 | 2.15360199268459 | E9PZ00; |
| sodium/potassium-transporting ATPase subunit α-1 | Atp1a1 | 0.721967697143555 | 4.49493484904153 | |
| receptor-type tyrosine-protein phosphatase α | Ptpra | 0.715917587280273 | 1.32145282193725 | |
| carbonic anhydrase 2 | Ca2 | 0.700565338134766 | 2.18240873407234 | |
| cation-dependent mannose-6-phosphate receptor | M6pr | 0.694555282592773 | 1.86549789454771 | |
| guanine nucleotide-binding protein G( | Gnai2 | 0.690958023071289 | 4.49982886978393 | |
| solute carrier organic anion transporter family member 4A1 | Slco4a1 | 0.68499755859375 | 2.62287594512409 | |
| 60S acidic ribosomal protein P2 | Rplp2 | 0.683738708496094 | 2.50202473162693 | |
| galectin-1 | Lgals1 | 0.678895950317383 | 2.93679707725021 | |
| Ras-related protein Rab-7a | Rab7a | 0.677793502807617 | 2.27608066338504 | |
| protein-tyrosine-phosphatase | Ptprc | 0.66557502746582 | 4.1976947458689 | S4R1M0; |
| macrophage scavenger receptor types I and II | Msr1 | 0.662124633789063 | 2.22280175971571 | A0A1B0GRS5; |
| annexin A3; annexin | Anxa3 | 0.643321990966797 | 3.93917765945984 | |
| dolichyl-diphosphooligosaccharide--protein glycosyltransferase subunit 1 | Rpn1 | 0.631629943847656 | 1.60140194675991 | |
| integrin β; integrin β-2 | Itgb2 | 0.624547958374023 | 2.97514378801044 | |
| guanine nucleotide-binding
protein G( | Gnai3 | 0.622499465942383 | 3.11714466623686 | |
| retinoic acid early inducible protein 1-β | Raet1b | 0.622049331665039 | 3.68057249310752 | |
| brain acid soluble protein 1 | Basp1 | 0.615779876708984 | 1.59457032964449 | |
| V-type proton ATPase subunit a | Tcirg1 | 0.614723205566406 | 2.10278063373262 | |
| protein EVI2B | Evi2b | 0.600425720214844 | 1.77680526978937 | |
| neuroplastin | Nptn | 0.593925476074219 | 1.7018422710372 | H3BIX4; Z4YLB7; |
| platelet glycoprotein 4 | Cd36 | 0.591106414794922 | 3.09538924500363 | |
| lipid phosphate phosphohydrolase 1 | Ppap2a | 0.590782165527344 | 1.70627236425915 | |
| annexin A7 | Anxa7 | 0.588558197021484 | 1.76746156517526 | |
| V-type proton ATPase subunit C 1 | Atp6v1c1 | 0.587795257568359 | 1.74946357325171 |
- —National Institute of General Medical Sciences10.13039/100000057
- —National Institute of Allergy and Infectious Diseases10.13039/100000060
- —National Institute of Allergy and Infectious Diseases10.13039/100000060
- —Oklahoma State University10.13039/100007069
Peer Reviews
No public reviews on file for this paper yet. If you reviewed it on a platform where reviews are public (OpenReview, ICLR, NeurIPS, ICML), you can paste yours below so the community can read it here.
Videos
No videos yet. Explain this paper in a talk, walkthrough, or lecture? Add one.
Taxonomy
TopicsExtracellular vesicles in disease · Mycobacterium research and diagnosis · Galectins and Cancer Biology
Introduction
Mycobacterium abscessus (M.ab) is a member of the nontuberculous mycobacteria (NTM), which includes a diverse set of environmental bacteria typically found in soil, dust, water, and other natural sources. While M.ab is generally harmless to healthy individuals, under certain conditions, M.ab can cause severe respiratory infections, particularly in patients with underlying pulmonary diseases such as chronic obstructive pulmonary disease (COPD) and cystic fibrosis (CF). ?−? ? ? ? Similar to Mycobacterium tuberculosis (M.tb), the causative agent of tuberculosis (TB) in humans, ?,? the pathogenesis of M.ab is complex, as it has developed several mechanisms to survive and proliferate within host cells, especially in alveolar macrophages, which are the primary immune cells responsible for defending the lungs against pathogens.? Macrophages are professional phagocytes, which actively engulf and destroy invading microorganisms by utilizing various antimicrobial mechanisms, including antimicrobial peptides, reactive oxygen species (ROS), reactive nitrogen species (RNS), phagosome-lysosome fusion and autophagy.? However, M.ab has evolved several strategies to resist these defenses, including the ability to inhibit phagosome-lysosome fusion in macrophages.? The interaction between M.ab and macrophages not only allows the bacteria to persist within the host cells but also contributes to chronic infection and inflammation, leading to the progression of M.ab-associated pulmonary diseases. Treatment of M.ab pulmonary infection is challenging in humans due to the lack of effective drug regimens and the prolonged treatment duration (18–24 months). ?,? Therefore, understanding the molecular interactions between M.ab and macrophages is critical for developing effective therapies and improving clinical outcomes for patients with chronic M.ab pulmonary infection.
Cell-to-cell communication plays a crucial role in the host’s response to bacterial infection, helping to coordinate immune responses, tissue repair, and inflammation. Cell-to-cell communication is regulated through multiple mechanisms, such as the secretion of cytokines, which act as signaling molecules that facilitate communication between immune cells,? and the release of extracellular vesicles (EVs), which serve as vehicles for transporting biomolecules across cells.? EVs are a group of membrane-bound vesicles with a lipid bilayer, that mediate cell-to-cell communication and regulate various biological processes, such as antigen presentation and pathogen clearance in immune cells. ?,? Mammalian cells release different types of EVs, such as exosomes and microvesicles (MVs) based on their biogenesis pathways. ?,? Exosomes are EVs originating from the multivesicular body (MVB) that are formed via the inward budding of the endosomal membrane, and released to extracellular environment via the fusion of MVB with the cytoplasmic membrane. MVs are generated through direct outward budding of the cytoplasmic membrane. EVs carry proteins, lipids, RNA, and other molecules derived from the parent cells, and can be taken up by recipient cells to modulate their function. ?,? In the context of bacterial infection, these vesicles may serve as carriers of pathogen-associated molecular patterns (PAMPs), such as bacterial proteins, RNAs and lipids, and regulate host immunity via activating recipient immune cells or uninfected host cells. ?,?,? Macrophage-released EVs have been widely studied previously in host response to mycobacterial infection, especially in the cellular response to M.tb infection. ?,? In contrast to M.tb infection, limited studies have focused on macrophage-derived EVs in the context of mycobacterial infection caused by NTM pathogens, such as M.ab.
In this study, we isolated EVs from either uninfected or M.ab-infected mouse macrophages cultured in vitro and characterized their proteomic profiles. We also investigated how the release of EVs during mycobacterial infection might alter cellular interactions and influence the host’s response to M.ab infection. Our results reveal that EVs released by M.ab-infected macrophages significantly enhance the intracellular growth of M.ab within recipient macrophages in cell culture. This effect is associated with an EV-mediated upregulation of intracellular iron levels in recipient macrophages, which are critical for bacterial survival and replication within host cells. ?,? These findings suggest that M.ab-infected macrophages actively release EVs that not only reflect the changes in host cell metabolism but also contribute to bacterial pathogenesis by altering key host cellular processes such as iron homeostasis.
Materials and Methods
Mammalian Cell Culture
RAW 264.7 cells were cultured at 37 °C and 5% CO_2_ in Dulbecco’s Modified Eagle Medium (DMEM) (Cat. No. SH30243.01; HyClone) supplemented with 10% (v/v) fetal bovine serum and streptomycin and penicillin (Cat. No. SV30010; HyClone) at a final concentration of 100 U/mL as we did previously.?
Bacterial Culture
M.ab ATCC 19977 was grown in Middlebrook 7H9 broth (Cat. No. M198; HiMedia Laboratories) supplemented with 10% (v/v) OADC (oleic acid-albumin-dextrose-catalase, 0.05% Tween 80) at 37 °C.
EVs Isolation and NanoSight Analysis
RAW 264.7 cell line was either left uninfected or infected with M.ab ATCC 19977 at a multiplicity of infection (MOI) of 5 for 4 h in complete DMEM medium. After the infection, the cells were washed three times with prewarmed 1× PBS to remove any extracellular bacteria. Subsequently, the cells were incubated in EVs-free DMEM medium for 72 h at 37 °C and 5% CO_2_ to allow for the collection of cell-secreted EVs as described in our previous studies. ?,? The EV-free DMEM medium was prepared as we did previously. ?,? Host cell-released EVs were harvested from the cell culture supernatant via a differential centrifugation procedure as described previously.? Cell debris and apoptotic bodies were sequentially removed at 1000g and 4 °C for 15 min, and 2000g and 4 °C for 20 min. The EVs were finally isolated at 10,000g and 4 °C for 30 min, followed by three washes with precold 1× PBS. Isolated EVs were analyzed by the NanoSight NS300 (Malvern Panalytical, UK) to determine the yield of EV isolation. The protein abundance was determined using Pierce BCA Protein Assay Kits (Cat. No. 23227; Thermo Scientific). For some experiments, isolated EVs were further purified using sucrose gradient centrifugation as described previously.?
Transmission Electron Microscopy (TEM)
EV samples were analyzed by TEM as we did previously.? Briefly, the isolated EVs were applied to carbon-film TEM grids (Electron Microscopy Sciences, Hatfield, PA, USA), and then stained with 2.5% uranyl acetate. The stained samples were subsequently imaged using transmission electron microscope (JEOL Ltd., Akishima, Tokyo, Japan) at the Oklahoma State University Microscopy Core Facility.
Mycobacterial Survival Assay in Macrophages
RAW 264.7 cells were either left untreated or pretreated with purified EVs (EVs/Cell = 100:1) with/without iron chelator, deferoxamine (Sigma-Aldrich, Cat. No. D9533; 100 μM), for 24 h in vitro at 37 °C and 5% CO_2_. After pretreatment, the cells were infected with M.ab (MOI = 5) for 1 h at 37 °C and 5% CO_2_. Following the infection, cells were washed three times with DMEM to remove any remaining extracellular M.ab. The cells were then incubated for additional periods (1 and 72 h) at 37 °C and 5% CO_2_. After incubation, the cells were washed three times with 1× PBS and subsequently lysed with 0.05% SDS. Cell lysates were serially diluted in 1× PBS and plated on Middlebrook 7H10 agar plates (Cat. No. 61000–050; HiMedia) supplemented with 10% (v/v) OADC. M.ab colonies were counted after 3–5 days of incubation at 37 °C.
Quantitative RT-PCR
RAW 264.7 cells were treated with EVs isolated from uninfected or M.ab-infected macrophages (EVs/Cell = 100:1) for 24 h in vitro at 37 °C and 5% CO_2_. The cellular total RNA was isolated using Monarch’s Total RNA Miniprep Kit (Cat. No. T20105; New England Biolabs) according to the manufacturer’s instruction. The cDNA was synthesized using AMV reverse transcriptase (Cat. No. B0277A; New England Biolabs) as we did previously.? Quantitative PCR was then performed on the Roche LightCycler 480 real-time PCR system (Qiagen) using luna universal master mix (Cat. No. M3003E; New England Biolabs) and primers for Tfrc (FW: 5′-TATTGTAAGCGTGTAGAACAAAAA-3′; RE: 5′-GTTTTGAGGTCTGCCC AATATA-3′), and GAPDH (FW: 5′-TCGTCCCGTAGACAAAATGG-3′; RE: 5′-TTGAGGTCAATG AAGGGGTC-3′).
Proteomic Analysis for EVs
Purified EVs were analyzed using a “high/low”-mass accuracy data-dependent HCD MS/MS in a quadrupole-Orbitrap mass spectrometer (Fusion model, Ther- mofischer) in the proteomics core facility at Oklahoma State University as we did previously. ?,? Raw data were mapped to a reference database containing 55,334 Mus musculus proteins (UniProt database UP000000589) using Perseus (version 2.0.10.0). Similar to our previous study,? the following criteria were applied in MaxQuant: (i) Fixed modification: Carbamidomethyl of cysteine (Cys), and (ii) Variable modifications: oxidation of methionine (Met), acetylation of protein N-termini, and chemical cyclization of glutamine (Gln) residues to pyroglutamate if they are at the n-terminus of the peptide. For the PCA analysis, the LFQ intensities of the identified proteins were log_2_ transformed, and normalized using the package “prcomp” in R. The first two principal components, accounting for the largest proportion of variance, were visualized using scatterplots generated in R with ggplot2 (v3.5.1).? To identify differentially regulated proteins, the proteins exhibiting a fold change >1.5 and p < 0.05 were considered to be differentially enriched. To further interpret the biological significance of these differentially regulated proteins, a protein pathway analysis was conducted using Metascape custom analysis for M. musculus, focusing on Gene Ontology (GO) Biological Processes, KEGG Pathways and GO Cellular Components, as described in our previous work. ?,?,?
Western Blot Analysis
The assay was performed as we did previously.? EVs from uninfected or M.ab-infected RAW 264.7 cells were run on an SDS-PAGE gel and transferred to a PVDF membrane. The membranes were incubated with rabbit anti-CD71 (Abcam, Cat. No. ab214039) or mouse anti-β-actin antibody (Biolegend, Cat. No. 643802), followed by goat anti-rabbit IgG (Invitrogen, Cat. No. 31460) or anti-mouse IgG secondary antibody (Invitrogen, Cat. No. G21040).
Intracellular Iron Measurement
RAW 264.7 cells were untreated or treated with EVs isolated from uninfected or M.ab-infected macrophages (EVs/Cell = 100:1) for 24 h in vitro at 37 °C and 5% CO_2_. The intracellular iron abundance in macrophages was determined using the iron assay kit (Sigma-Aldrich, Cat. No. MAK025) following the manufacturer’s instruction as we did previously.?
Statistical Analysis
Data were analyzed using PRISM GraphPad (Version 9.5.0) via Student’s paired t tests or one-way ANOVA with Tukey’s multiple comparisons test; p ≤ 0.05 was considered significant.
Data Availability
The mass spectrometry proteomics data have been deposited to the ProteomeXchange Consortium via the PRIDE? partner repository with the data set identifier PXD062573.
Results
M.ab Infection Increases EVs
Release by Mouse RAW 264.7 Cells in Cell Culture
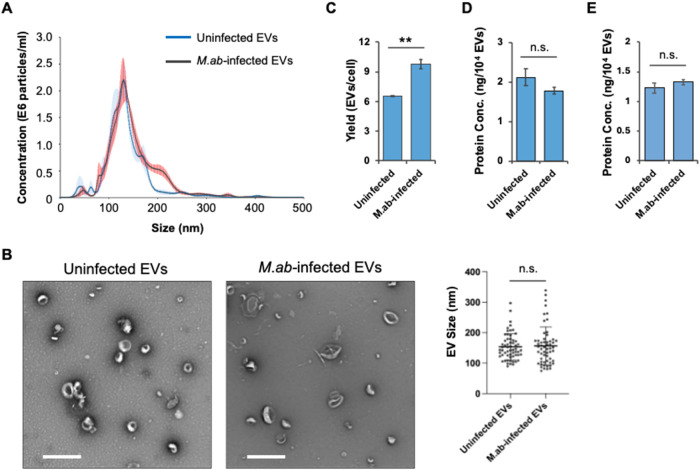
To determine the effect of M.ab infection on EV biogenesis in macrophages, we isolated EVs from either uninfected or M.ab-infected RAW 264.7 cells in cell culture. As shown in FigureA, Nanosight analysis indicates that M.ab infection had no effect of EV size distribution. A similar result was observed in the TEM analysis for purified EVs from uninfected or M.ab-infected RAW 264.7 cells (FigureB). However, M.ab did increase the release of EVs by RAW 264.7 cells. As seen in FigureC, EV release was increased by about 50% in M.ab-infected RAW 264.7 cells when compared to uninfected RAW 264.7 cells. In contrast, a similar level of the total protein abundance was detected in EVs isolated from uninfected or M.ab-infected RAW 264.7 cells (FigureD). We also purified EVs using sucrose gradient centrifugation as described previously.? As shown in FigureE, a similar abundance of total proteins was detected in EVs from either uninfected or M.ab-infected RAW 264.7 cells.
*Characterization of purified EVs. (A) NanoSight analysis for EVs isolated from uninfected (Uninfected EVs) or M.ab-infected (M.ab-infected EVs) RAW 264.7 cells. Solid line indicates average number of particles (n = 5 technique repeats). Red and blue shading demonstrates standard deviation for each sample. (B) Representative image of transmission electron microscopy analysis for purified EVs (n = 5 random fields/sample) and related quantification based on multiple EVs under random fields (n = 60 EVs/sample). Scale bar: 500 nm. (C) EVs yield from uninfected or M.ab-infected RAW 264.7 cell culture. Total EVs yield was determined by NanoSight NS300 and calculated based on the cell density used for vesicle isolation. (D) Protein quantification by BCA analysis for EVs isolated from uninfected or M.ab-infected RAW 264.7 cells using differential centrifugation method. (E) Protein quantification by BCA analysis for EVs that were further purified using sucrose gradient centrifugation. Data are representative of three independent experiments. The results in (C–E) are mean ± SD (n = 3 biological repeats/group). n.s., not significant; *p < 0.01 by two-tailed Student’s t test.
Proteomic Analysis for Isolated EVs from Uninfected or M.ab-Infected RAW 264.7 Cells
To better understand the role of macrophage-released EVs on the host–pathogen interaction in the context of mycobacterial infection, we first performed the proteomic analysis for EVs that were isolated from uninfected or M.ab-infected RAW 264.7 cells in cell culture. As shown in FigureA, principal component analysis (PCA) reveals that the proteomic profiles of the samples under each condition (M. ab-infected vs uninfected EVs) are similar. We further identified 5 unique host proteins (Table) in EVs isolated from M.ab-infected RAW 264.7 cells, and 124 unique host proteins (Table S1) in EVs from uninfected RAW 264.7 cells (FigureB). 839 overlapping host proteins were detected in EVs from uninfected or M.ab-infected RAW 264.7 cells (FigureB). Among those overlapping host proteins, the abundance of 58 host proteins (Table) was elevated in EVs isolated from M.ab-infected RAW 264.7 cells when compared to EVs from uninfected RAW 264.7 cells. In contrast, the abundance of 73 host proteins (Table S1) was downregulated in EVs isolated from M.ab-infected RAW 264.7 cells compared to EVs from uninfected RAW 264.7 cells (FigureC). The abundance of 708 detected host proteins is comparable in EVs from uninfected and M.ab-infected RAW 264.7 cells (FigureC and Table S1). The volcano plot in FigureD shows the differentially regulated proteins that were included in FigureC. As expected, we detected a list of host proteins that are generally identified in all types of EVs? (Figure S1 and Table S2). We also identified a group of mycobacterial proteins in EVs released by M.ab-infected RAW 264.7 cells but not EVs from uninfected Cells (Table S3).
Proteomic analysis for purified EVs. (A) PCA analysis for the proteomic data. (B) Venn diagram for host proteins identified in EVs isolated from uninfected or M.ab-infected RAW 264.7 cells. (C) Venn diagram for overlapping host proteins that are differentially enriched in EVs isolated from uninfected and M.ab-infected RAW 264.7 cells (Cutoff: Fold Change >1.5 and p < 0.05). (D) Volcano plot for host proteins differentially enriched in EVs isolated from uninfected or M.ab-infected RAW 264.7 cells.
1: Host Proteins Unique in M.ab-Infected EVs vs Uninfected EVs
2: Mouse Proteins Highly Enriched in EVs from M.ab-Infected Macrophages
Pathway Analysis for Mouse Proteins Enriched in EVs Released
by Uninfected or M.ab-Infected RAW 264.7 Cells
To investigate the potential cellular processes or pathways that are regulated by M.ab-infected cell-released EVs in recipient cells, we first performed pathway analysis using the differentially enriched host proteins (Tables and ?) in EVs isolated from M.ab-infected RAW 264.7 cells vs uninfected cells. To gain a comprehensive understanding of the biological significance of our data set, we performed pathway analysis using three complementary methods: Gene Ontology (GO) Biological Processes, GO Cellular Components, and KEGG Pathways. Each method offers unique insights that, when integrated, provide a multidimensional view of EV-carried proteins in recipient cells. FigureA shows the top 20 host biological processes that were highly upregulated in EVs isolated from M.ab-infected RAW 264.7 cells compared to EVs from uninfected RAW 264.7 cells based on the GO Biological Processes category.? These enriched biological processes are mainly involved in molecule transport, intracellular ion homeostasis, and cellular response to extracellular stimulation, such as the import into cell pathway, the regulation of secretion by cell pathway, the carboxylic acid transport pathway, the regulation of superoxide metabolic process and intracellular monatomic cation homeostasis. Similarly, based on the GO Biological Processes category (FigureA), we also found a list of downregulated biological processes in EVs isolated from M.ab-infected RAW 264.7 cells compared to EVs from uninfected RAW 264.7 cells using those host proteins that are diminished in EVs isolated from M.ab-infected RAW 264.7 cells compared to EVs from uninfected RAW 264.7 cells (Table S1). Differently, the top 5 downregulated biological processes in EVs from M.ab-infected cells are the biological processes involved in RNA splicing, chromosome condensation, amino acid metabolic process, aerobic respiration, and dicarboxylic acid metabolic process. As shown in FigureA, a number of downregulated biological processes regulate protein translation and metabolism in host cells. Since EVs are released by cells, these enriched GO biological processes reflect the cellular response to M.ab infection in RAW 264.7 cells in cell culture.
Metascape pathway analysis for host proteins that were upregulated (Tables and ) in EVs isolated from M.ab-infected RAW 264.7 cells compared to those from uninfected RAW 264.7 cells. The analysis was performed using various pathway databases. (A) GO biological processes; (B) KEGG; (C) GO cellular components.
Metascape pathway analysis for host proteins that were downregulated (Table S1) in EVs isolated from M.ab-infected RAW 264.7 cells compared to those from uninfected RAW 264.7 cells. The analysis was performed using various pathway databases. (A) GO biological processes; (B) KEGG; (C) GO cellular components.
We also conducted pathway analysis based on the KEGG pathway collection (FigureB,?B), which mainly determines the interaction between different biological pathways.? Interestingly, we identified several bacterial infection-associated pathways ?,? that were highly upregulated in EVs isolated from M.ab-infected RAW 264.7 cells compared to EVs from uninfected RAW 264.7 cells, including the pathways regulating phagosome and lysosome function, efferocytosis, mTOR signaling, and cellular response to Salmonella infection (FigureB). Similar to the findings with the GO Biological Processes category (FigureA), a number of the downregulated KEGG pathways in EVs isolated from M.ab-infected RAW 264.7 cells in the KEGG analysis are the pathways engaged in the cellular metabolism and protein translation, such as valine, leucine and isoleucine degradation, citrate cycle (TCA cycle), 2-oxocarboxylic acid metabolism, spliceosome, and protein processing in endoplasmic reticulum (FigureB). Like the analysis above in GO Biological Processes, these enriched KEGG pathways reflect the cellular response to M.ab infection in parental macrophages. Further pathway analysis with the GO Cellular Components Collection, which determines the subcellular localization of proteins,? shows that several host cell plasma membrane-associated pathways were upregulated in EV isolated from M.ab-infected RAW 264.7 cells compared to EVs from uninfected RAW 264.7 cells, including those involved in the membrane raft, apical part of cell, plasma membrane protein complex, and the external side of the plasma membrane (FigureC). Similar to the downregulated pathways enriched using the GO Biological Processes and KEGG collections, a group of downregulated pathways involved in host protein translation and cellular metabolism were identified in EVs isolated from M.ab-infected RAW 264.7 cells compared to EVs from uninfected RAW 264.7 cells, such as the tricarboxylic acid cycle heteromeric enzyme complex, spliceosomal complex, smooth endoplasmic reticulum, and ribosomal subunits (FigureC). It suggests that host proteins involved in protein translation and cellular metabolism were less trafficked into EVs in M.ab-infected RAW 264.7 cells relative to uninfected RAW 264.7 cells.
In the contrast, the enrichment of the host proteins involved in cytoplastic membrane indicates that M.ab infection increased the abundance of these proteins in cytoplastic membrane or trafficking to EVs in RAW 264.7 cells.
Metascape network analysis of enriched gene ontology clusters with biological processes reveals that the top 20 upregulated gene ontology clusters in EVs isolated from M.ab-infected RAW 264.7 cells exhibit high inter- and intracluster similarity (FigureA). A similar pattern was observed for the 20 downregulated pathways in EVs isolated from M.ab-infected RAW 264.7 cells compared to EVs from uninfected cells (FigureB).
Metascape network for enriched gene ontology clusters based on biological processes. The analysis was performed using host proteins that were differentially enriched in EVs isolated from M.ab-infected RAW 264.7 cells compared to those from uninfected RAW 264.7 cells. (A) Metascape network for enriched ontology clusters (Go: Biological Process) based on the upregulated mouse proteins in EVs isolated from M.ab-infected RAW 264.7 cells. (B) Similar to (A), but using the downregulated mouse proteins in EVs isolated from M.ab-infected RAW 264.7 cells. Each term is indicated by a circular node. The number of input proteins falling into that term is represented by the circle size, and the cluster identities are represented by colors.
EVs from M.ab-Infected RAW
264.7 Cells Improve M.ab Intracellular Growth in Recipient Macrophages in Cell Culture
To determine the effect of macrophage-released EVs on cellular response to mycobacterial infection in recipient macrophages, we analyzed the M.ab intracellular survival in RAW 264.7 cells that were pretreated with EVs isolated from the uninfected or M.ab-infected RAW 264.7 cells. Different from EVs isolated from M.ab-infected human bronchial epithelial cell line 16HBE14o-,? EVs isolated from M.ab-infected RAW 264.7 cells significantly improved M.ab intracellular growth in recipient macrophages at 72 h post infection when compared to the untreated group or EVs from uninfected RAW 264.7 cells (Figure). EVs isolated from uninfected RAW 264.7 cells slightly enhanced intracellular growth of M.ab in macrophages compared to the untreated group; however, the difference was not statistically significant. EVs from either uninfected or M.ab-infected RAW 264.7 cells did not interfere with M.ab load at 1 h post infection, suggesting they do not affect the uptake of M.ab by recipient macrophages in cell culture (Figure).
*M.ab survival in mouse macrophages in cell culture. RAW 264.7 cells were pretreated with EVs isolated from uninfected or M.ab-infected RAW 264.7 cells for 24 h before M.ab infection (MOI = 5). The results are mean ± SD (n = 3/group) and representative of three independent experiments. n.s., not significant; p < 0.05 by one-way ANOVA, followed by Tukey’s multiple comparisons test.
EVs from M.ab-Infected RAW
264.7 Cells Mediate Iron Uptake in Recipient Macrophages
As described above, the gene ontology pathway analysis illustrates that the “Import Into Cell” pathway is the top 1 upregulated host pathway in EVs isolated from M.ab-infected RAW 264.7 cells relative to EVs from uninfected macrophages (FigureA). A heatmap for the proteins engaged in this pathway is shown in FigureA. Several amino acid transporter proteins were enriched in EVs isolated from M.ab-infected RAW 264.7 cells, including Slc3a2, Slc7a5, Slc1a5, Slc2a1, and Slc38a2 (FigureA). Interestingly, this enriched pathway also includes the transferrin receptor that is important for intracellular iron uptake in macrophages? (FigureA and Table). Western blot analysis further confirmed an increased level of transferrin receptor in EVs from M.ab-infected RAW 264.7 cells compared to EVs from uninfected cells (FigureB,?C). Intracellular iron is one of the key nutrients for mycobacterial intracellular growth in macrophages.? It has been reported that the EV membrane can fuse with the cytoplasmic membrane of recipient cells.? Therefore, we hypothesized that EV-carried transferrin receptors likely transfer the transferrin receptors to recipient macrophages and increase iron uptake in these cells.
*Effect of macrophage-derived EVs on antimycobacterial response in macrophages in cell culture. (A) The heatmap for the host proteins involved in the pathway “import into cell” that were enriched in EVs isolated from M.ab-infected RAW 264.7 cells vs EVs from uninfected RAW 264.7 cells. (B) Western blot analysis for transferrin receptor (Tfrc) in EVs. β-actin was used as a loading control. (C) Relative abundance of transferrin receptor in EVs based on Western blot analysis. Intensity of target bands was measured by ImageJ and then the intensity of transferrin receptor was normalized to β-actin. The result was expressed relative to uninfected EVs. (D) Intracellular iron abundance in RAW 264.7 cells that were treated with EVs isolated from uninfected or M.ab-infected RAW 264.7 cells for 24 h. (E) Iron abundance in EVs isolated from uninfected or M.ab-infected RAW 264.7 cells. (F) Quantitative RT-PCR for the mRNA abundance of the Tfrc gene in RAW 264.7 cells that were untreated or treated with EVs isolated from uninfected or M.ab-infected RAW 264.7 cells for 24 h. (G) M.ab CFU assay in RAW 264.7 cells that were pretreated with EVs in the presence of iron chelator, deferoxamine. The results in (D–G) are mean ± SD (n = 3 biological repeats/group) and are representative of two independent experiments. n.s., not significant; p < 0.05 by one-way ANOVA, followed by Tukey’s multiple comparisons test.
To test our hypothesis, we measured the intracellular iron abundance in RAW 264.7 cells untreated or treated with EVs isolated from uninfected or M.ab-infected RAW 264.7 cells in cell culture. As seen in FigureD, EVs isolated from M.ab-infected RAW 264.7 cells significantly increased intracellular iron abundance in recipient macrophages when compared to the untreated group or EVs from uninfected macrophages. Similar to our observation in M.ab intracellular growth in macrophages (Figure), EVs from uninfected RAW 264.7 cells had no significant effect on intracellular iron abundance in recipient macrophages in cell culture (FigureD). Different from EV-treated macrophages, a comparable level of iron load was detected in purified EVs from either uninfected or M.ab-infected RAW 264.7 cells (FigureE). Quantitative RT-PCR analysis indicates that EVs from either uninfected or M.ab-infected RAW 264.7 cells had no effect on the expression of the transferrin receptor gene, Tfrc, in recipient macrophages in cell culture (FigureF). These results suggest that the increase in iron levels in recipient macrophages by EVs from M.ab-infected RAW 264.7 cells is likely due to the transfer of transferrin receptor from EVs to the recipient cells, not due to the upregulation of Tfrc gene in the recipient macrophages. To determine if EV-induced iron uptake contributes to an increased M.ab growth in recipient macrophages, we measured M.ab growth in RAW 264.7 cells that were pretreated with EVs in the presence of iron chelator, deferoxamine, in cell culture. As seen in FigureG, EVs isolated from M.ab-infected RAW 264.7 cells failed to enhance M.ab growth in recipient macrophages in the presence of deferoxamine.
Discussion
Intracellular iron homeostasis within host cells is essential for the survival and proliferation of intracellular bacterial pathogens, such as M.tb and NTMs, in macrophages. ?,? Since iron is a critical nutrient for bacterial pathogens, many bacteria, including M.tb and NTMs, have evolved survival strategies to hijack iron from host cells to support their growth and maintain cellular processes. These pathogens often acquire iron from host cells by inducing the release of iron from host stores or by directly exploiting the host’s iron supply to fuel their intracellular replication. For example, M.tb and M.ab produce and secrete siderophores, carboxymycobactin, that can acquire iron from the iron-binding host proteins. ?,?,? Previous studies also showed that transferrin-delivered iron accumulated in mycobacteria-containing phagosomes in mouse macrophages that were infected with pathogenic Mycobacteria, including M.avium 101 or M.tb H37Rv, in cell culture.? While this iron accumulation provides mycobacterial pathogens a direct access to iron supply, it could be detrimental to bacterial survival within host cells via iron-dependent reactive oxygen species (ROS) production.? However, mycobacterial pathogens, such as M.tb and M.ab, has evolved a mechanism to resist iron-dependent ROS production within macrophages.? In this study, we discovered that M.ab-infected mouse macrophages release EVs that facilitate iron uptake in recipient macrophages in cell culture. This process enhances the intracellular iron availability in the recipient cells, creating a favorable environment that supports the growth and survival of M.ab within macrophages (Figure). Host cell-derived EVs may represent an important mechanism by which M.ab manipulates host cell metabolism to promote its own intracellular proliferation within macrophages. Our findings suggest that host cell-derived EVs could serve as a novel mechanism by which M.ab and potentially other intracellular bacterial pathogens acquire essential nutrients, thereby enhancing their ability to survive and replicate in hostile host environments.
Interestingly, several proteins involved in ferroptosis, a form of programmed cell death driven by iron-dependent lipid peroxidation, are highly enriched in EVs isolated from M.ab-infected RAW 264.7 cells compared to EVs from uninfected cells. These proteins include Slc3a2, Slc7a5, Slc1a5, Slc38a2, and Slc2a1 (FigureA and Table). This suggests that M.ab infection may actively influence the vesicular transport of these critical regulatory proteins, which are involved in maintaining cellular homeostasis and redox balance in recipient cells. Notably, the amino acid transporters SLC1A5 and SLC38A2 play crucial roles in the transport of glutamine across the cell membrane. Once glutamine enters the cell, it is converted into glutamate, which in turn serves as a precursor for glutathione (GSH) biosynthesis. GSH, a major intracellular antioxidant, is involved in maintaining cellular redox homeostasis and plays a critical role in protecting cells from oxidative stress.? In the context of ferroptosis, GSH is essential for the activity of GPX4 (glutathione peroxidase 4), which detoxifies lipid peroxides and thereby prevents ferroptotic cell death. SLC3A2 forms heterodimers with SLC7A11, known as the xCT transporter, which is responsible for facilitating the uptake of cystine in exchange for glutamate. This system is essential for the synthesis of GSH as well, as cysteine is a rate-limiting substrate for GSH biosynthesis. By enabling the efficient import of cystine, the xCT transporter helps to maintain intracellular GSH levels, ensuring cellular protection against oxidative stress and ferroptosis.? In contrast to the protective functions of SLC1A5, SLC38A2, and SLC3A2, the glucose transporter, SLC2A1, appears to have a different role in ferroptosis. Recent studies have indicated that SLC2A1, also known as GLUT1, may promote ferroptosis under certain conditions by enhancing cellular glucose uptake, which can contribute to increased glycolytic flux and intracellular iron accumulation. This shift in metabolism could facilitate the generation of reactive oxygen species (ROS) and lipid peroxides, thus driving the ferroptosis pathway.? Taken together, our proteomic data in this study show that the ferroptosis pathway-associated proteins, that are suppressing or promoting this pathway, are highly enriched in EVs released by M.ab-infected mouse macrophages compared to EVs from uninfected macrophages. Considering our finding that EVs released by M.ab-infected macrophages increase intracellular iron abundance in recipient macrophages (FigureD), the proteins in EVs released from M.ab-infected macrophages are likely to have a capacity to balance iron levels for the need of bacterial survival, avoiding ferroptosis. In the future study, it would be warranted to determine if M.ab-infected macrophage-released EVs induce ferroptosis in recipient macrophages via upregulating iron uptake, and if EV-carried amino acid transporters, such as SLC1A5, SLC38A2, and SLC3A2, overcome iron-induced ferroptosis via enhancing the GSH-GPX4 axis in recipient cells.
In our previous study, we isolated EVs from M.ab-infected RAW 264.7 cells at 100,000g after a differential centrifugation, followed by a CD9, CD63 and CD81affinity-based purification.? Similar to our findings in this study (FigureA and Table), our previous study demonstrated that the glutamine transporter, SLC1A5 and SLC38A2, were also highly enriched in 100,000g EVs released by M.ab-infected RAW 264.7 cells compared to EVs from uninfected cells. Additionally, these EVs-carried SLC1A5 and SLC38A2 potentially serve as extracellular glutamine eliminator to diminish the availability of glutamine and interfere with glutamine-dependent M.ab killing in recipient macrophages.? Interestingly, the “Import Into Cell” pathway is upregulated in both 100,000g EVs? and 10,000g EVs (FigureA) released by M.ab-infected RAW 264.7 cells in cell culture when compared to those from uninfected cells. While 3 common host proteins (SLC1A5, SLC38A2 and SLC2A1) are enriched in both 100,000g EVs and 10,000g EVs released by M.ab-infected RAW 264.7 cells, the majority of enriched proteins involved in the “Import Into Cell” pathway are different in 100,000g EVs and 10,000g EVs. Future studies should more specifically aim to determine the distinct and/or conserved mechanisms by which M.ab-infected macrophages regulate recipient cell function through different populations of EVs.
In summary, this study demonstrates that M.ab-infected mouse macrophages release EVs that enhance iron uptake in recipient macrophages, creating a favorable environment for M.ab intracellular growth in cell culture. These EVs carry a high level of the proteins involved in the ferroptosis pathway, such as SLC3A2, SLC7A5, SLC1A5, SLC38A2, and SLC2A1, which play key roles in amino acid transport, redox balance, and the synthesis of GSH, suggesting that M.ab-infected macrophage-released EVs may regulate ferroptosis in recipient cells by upregulating the GSH-GPX4 axis. Additionally, the research underscores the need for future studies to explore the distinct mechanisms by which different EV populations regulate recipient cell function, as these vesicles contain enriched proteins that modulate cellular pathways critical for host–pathogen interactions. Finally, it would be important to investigate whether EVs have similar functions in human and mouse macrophages, which would further provide valuable insight to the role of host cell-derived EVs during mycobacterial infection in humans.
Supplementary Material
The reference list from the paper itself. Each links out to its DOI / PubMed record.
- 1Vermeire C. A.Tan X.Liang Y.Kotey S. K.Rogers J.Hartson S. D.Liu L.Cheng Y.Mycobacterium abscessus extracellular vesicles increase mycobacterial resistance to clarithromycin in vitro Proteomics 202424 e 230033210.1002/pmic.20230033238238893 PMC 11486469 · doi ↗ · pubmed ↗
- 2Kotey S. K.Tan X.Kinser A. L.Liu L.Cheng Y.Host Long Noncoding RN As as Key Players in Mycobacteria–Host Interactions Microorganisms 20241212265610.3390/microorganisms 1212265639770858 PMC 11728548 · doi ↗ · pubmed ↗
- 3Moraski G. C.Cheng Y.Cho S.Cramer J. W.Godfrey A.Masquelin T.Franzblau S. G.Miller M. J.Schorey J.Imidazo[1,2-a]Pyridine-3-Carboxamides Are Active Antimicrobial Agents against Mycobacterium avium Infection In Vivo Antimicrob. Agents Chemother.20166085018502210.1128/AAC.00618-1627216051 PMC 4958206 · doi ↗ · pubmed ↗
- 4Martiniano S. L.Nick J. A.Daley C. L.Nontuberculous Mycobacterial Infections in Cystic Fibrosis Thorac. Surg. Clin.20192919510810.1016/j.thorsurg.2018.09.00830454926 · doi ↗ · pubmed ↗
- 5Griffith D. E.Aksamit T.Brown-Elliott B. A.Catanzaro A.Daley C.Gordin F.Holland S. M.Horsburgh R.Huitt G.Iademarco M. F.An official ATS/IDSA statement: diagnosis, treatment, and prevention of nontuberculous mycobacterial diseases Am. J. Respir. Crit. Care Med.20071754367416 ST 10.1164/rccm.200604-571ST 17277290 · doi ↗ · pubmed ↗
- 6Cheng Y.Schorey J. S.Zhang C. C.Tan X.Protein Kinase Inhibitors as Potential Antimicrobial Drugs Against Tuberculosis, Malaria and HIV Curr. Pharm. Des.201723294369438910.2174/138161282366617061212242928606053 · doi ↗ · pubmed ↗
- 7Chandra P.Grigsby S. J.Philips J. A.Immune evasion and provocation by Mycobacterium tuberculosis Nat. Rev. Microbiol.2022201275076610.1038/s 41579-022-00763-435879556 PMC 9310001 · doi ↗ · pubmed ↗
- 8Johansen M. D.Herrmann J.-L.Kremer L.Non-tuberculous mycobacteria and the rise of Mycobacterium abscessus Nat. Rev. Microbiol.202018739240710.1038/s 41579-020-0331-132086501 · doi ↗ · pubmed ↗