Cost-Effective Components of a Patient-Reported Symptom Monitoring System for Chemotherapy
Kathi Mooney, Minkyoung Yoo, Elizabeth S. Sloss, Bridget Nicholson, Natalya S. Alekhina, Eli Iacob, Richard Nelson

TL;DR
A study finds that a full electronic patient-reported outcome system with coaching and nurse follow-up is most cost-effective for managing chemotherapy symptoms.
Contribution
The study identifies the most cost-effective components of an ePRO system for cancer patients undergoing chemotherapy.
Findings
The complete ePRO intervention with self-management coaching and nurse follow-up was most cost-effective.
The group with self-management coaching plus an activity tracker had the lowest cost-effectiveness.
Comprehensive ePRO systems improve symptom control and are most cost-effective.
Abstract
Which component or combination of components of an electronic patient-reported outcome (ePRO) system are most cost-effective for managing symptom burden in patients receiving chemotherapy? In this economic evaluation including 757 participants randomized to 1 of 5 combinations of ePRO strategies, the complete ePRO intervention, including self-management coaching and nurse practitioner follow-up for severe symptoms, had the highest cost-effectiveness, while the group with self-management coaching plus an activity tracker had the lowest. These findings suggest that comprehensive ePRO systems that integrate multiple intervention components offer the greatest value in terms of symptom control and cost-effectiveness. This economic evaluation study evaluate which components or combinations of components of an electronic patient-reported outcomes system for adults with cancer receiving…
Genes, proteins, chemicals, diseases, species, mutations and cell lines named across the full text — each resolved to its canonical identifier and authoritative record.
Click any figure to enlarge with its caption.
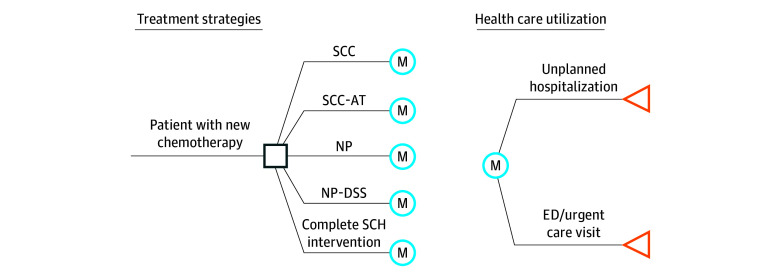 Figure 1
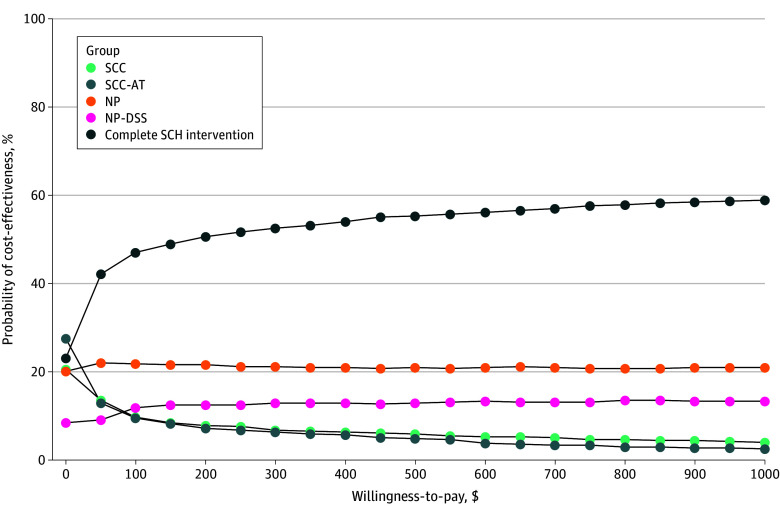 Figure 2
| Outcome | Mean (SD) | ||||
|---|---|---|---|---|---|
| SCC | SCC-AT | NP | NP-DSS | Complete SCH | |
| Patients, No. | 143 | 147 | 150 | 157 | 171 |
| Emergency department visit | |||||
| Weekly likelihood of having any visit, % | 3.7 (7.9) | 4.2 (10.8) | 4.4 (9.8) | 3.1 (6.6) | 4.7 (14.4) |
| Visits for patients with ≥1 visit, No. | 1.6 (0.8) | 2.0 (1.8) | 1.7 (1.0) | 2.1 (2.9) | 1.7 (1.8) |
| Unplanned hospitalization | |||||
| Weekly likelihood of having any visit ,% | 3.4 (8.9) | 2.5 (6.9) | 3 (9.4) | 2.0 (5.3) | 2.7 (8.5) |
| Visits for patients with ≥1 visit, No. | 1.3 (0.4) | 1.3 (0.7) | 1.4 (0.6) | 1.7 (1.9) | 1.3 (0.6) |
| LOS if any visit, d | 4.7 (4.2) | 5.0 (4.6) | 5.2 (3.4) | 3.6 (2.2) | 4.7 (4.4) |
| Category | Cost, $ |
|---|---|
| SCH total development materials | 491 118 |
| SCH labor | |
| Hourly wage for nurse practitioner in Utah | 59.80 |
| Monthly nurse practitioner time | |
| DSS groups, h | 19.79 |
| Non-DSS group, h | 11.46 |
| Intervention cost per patient | |
| SCC | 1253 |
| NP | 1309 |
| NP-DSSe | 1343 |
| Complete SCH intervention | 1340 |
| SCC-AT | 1253 |
| Health care | |
| Inpatient stay, per night, mean (SD) | 3574 (122) |
| Emergency department visit, mean (SD) | 1135 (33) |
| Strategy | Cost, 2023 $ | Effectiveness | ICER |
|---|---|---|---|
|
| |||
| NP-DSS | $14 590 | 5.3 | 0 [Reference] |
| Complete SCH | $18 200 | 4.5 | $4957 |
| SCC-AT | $18 796 | 6.9 | Dominated |
| SCC | $21 283 | 6.5 | Dominated |
| NP | $23 992 | 5.2 | Dominated |
|
| |||
| NP-DSS | $13 337 | 5.3 | 0 [Reference] |
| Complete SCH | $16 947 | 4.5 | $4957 |
| SCC-AT | $17 543 | 6.9 | Dominated |
| SCC | $20 030 | 6.5 | Dominated |
| NP | $22 739 | 5.2 | Dominated |
|
| |||
| NP-DSS | $13 461 | 4.7 | 0 [Reference] |
| Complete SCH | $18 654 | 5.5 | $7130 |
| SCC-AT | $17 370 | 3.1 | Dominated |
| SCC | $21 177 | 3.5 | Dominated |
| NP | $24 487 | 4.8 | Dominated |
Peer Reviews
No public reviews on file for this paper yet. If you reviewed it on a platform where reviews are public (OpenReview, ICLR, NeurIPS, ICML), you can paste yours below so the community can read it here.
Videos
No videos yet. Explain this paper in a talk, walkthrough, or lecture? Add one.
Taxonomy
TopicsCancer survivorship and care · Economic and Financial Impacts of Cancer · Digital Mental Health Interventions
Introduction
In the continuously evolving health care landscape, innovative digital symptom monitoring and management interventions have been shown to transform patient experience and reduce symptom burden and unplanned health care utilization. These automated digital tools systematically collect electronic patient-reported outcomes (ePROs). Based on the ePRO reports, interventions to reduce symptom burden and improve quality of life are offered. Interventions to decrease symptom burden can be automated, delivered over the phone, or provided at an in-person clinic visit. They can also have several variations of intervention components, which may be tailored to the reported symptom severity. Both academically developed and commercially available ePRO systems vary in the components they offer, their development costs, the degree of predeployment testing and optimization, as well as the cost to maintain and operate the systems.
Significant evidence supports the use of ePRO systems to improve patient symptom burden and decrease acute care utilization during cancer treatment.^1,2,3^ Given these benefits, focus has now shifted to broad implementation in cancer care.^4,5,6,7^ While effective clinical pathways exist to support the adoption of these systems and engage both patients and clinicians, academic and community oncology practices must also consider the cost-effectiveness of systems in relationship to the desired outcomes. However, there are few economic analyses of these systems and what combination of intervention components are most cost-effective for each system.
Over time, we have sequentially developed and tested an ePRO-based cancer symptom monitoring and management system, Symptom Care at Home (SCH), that has well-established efficacy.^2,8^ SCH was designed to support daily remote symptom monitoring, provide automated and tailored self-management coaching, and initiate a nurse practitioner (NP) telephone follow-up for symptoms rated 4 or higher on a 0 to 10 severity scale.
In a prior randomized trial by Mooney et al,^2^ 280 participants were randomized to SCH or enhanced usual care (UC), with both groups reporting daily severity of 11 symptoms via the automated system. Only SCH participants received automated self-management coaching and NP follow-up for poorly controlled symptoms. UC participants received standard symptom management from their oncology team. Compared with UC, SCH participants reported significantly lower overall symptom severity (mean reduction, 3.59 points; P < .001), representing 43% lower symptom burden than UC. They also experienced 67% fewer severe-rated symptom days (P < .001) and 39% fewer moderate severity days (P < .001). All individual symptoms except diarrhea also showed significant improvement in the SCH group, demonstrating the clinically meaningful efficacy of the SCH intervention.^2^
To refine SCH for broader implementation, we conducted a prospective component evaluation to assess whether all elements of the SCH intervention were necessary to achieve optimal symptom control.^9^ We found that the full SCH model led to the lowest symptom burden across all subcomponent groups. The published findings provide additional details on the design, sample characteristics, and symptom burden outcomes.^9^ In this study, we extend that work by evaluating the cost-effectiveness of the SCH intervention components to determine which components are most cost-effective in finalizing the intervention prior to implementation in oncology practice.
Methods
This economic evaluation was conducted as part of a randomized clinical trial reviewed and approved by institutional review boards from each participating organization. All participants provided written informed consent prior to enrollment. This study was conducted in accordance with the Consolidated Health Economic Evaluation Reporting Standards (CHEERS) reporting guideline.
Design
We conducted a multisite 5-group prospective randomized clinical trial study in cancer centers located in Utah and Georgia. We did not use a UC control group due to the efficacy demonstrated by SCH in a previous study,^8^ as there was no longer equipoise for a control condition. Participants were compensated $150 divided into 2 payments. The study was registered in ClinicalTrials.gov (NCT0277925).
The primary aim of our randomized clinical trial was to determine which component or combination of components from the SCH intervention provided the greatest reduction in symptom. Here, we report the prespecified secondary aim: to determine which component or combination of components was most cost-effective, as the prespecified secondary aim.
Participant Eligibility and Recruitment Sites
We recruited participants from the medical oncology practices at Huntsman Cancer Institute in Salt Lake City, Utah, and Emory University Winship Cancer Institute, including Grady Hospital, in Atlanta, Georgia. Recruitment occurred from August 7, 2017, through January 17, 2020. Patients were eligible to enroll if they were aged at least 18 years, had a cancer diagnosis, had a life expectancy of at least 3 months, and spoke English. They needed to be starting a chemotherapy course planned for 3 or more cycles. They were required to have daily access and ability to use a telephone, although it did not need to be a smart phone, as SCH is an interactive voice response system that transmits data using the traditional telephone network. Patients were excluded if they were also to receive concurrent radiation therapy, since they would have daily contact with oncology clinicians for symptom concerns.
Randomization
Consenting participants were randomly assigned to 1 of the 5 treatment groups using the REDCap software (Vanderbilt). Randomization was independently generated by site in blocks of 10, with 2 to 3 participants per block, and stratified by sex. Once randomized, staff collected baseline data and oriented the participant to their treatment group. Participants self-reported demographic characteristics, including race and ethnicity (including, Black, Hispanic, and White) and sex.
Intervention
All groups used the SCH system to report daily whether any of 11 common treatment-related symptoms were present and if present, the severity on a scale of 1 to 10, with 10 indicating most severe. The components received depended on intervention group assignment.
The 5 intervention groups were (1) automated self-management coaching alone (SCC; 143 participants), (2) automated self-management coaching with an activity tracker visible to the participant (SCC-AT; 144 participants), (3) NP follow-up using best practices for symptom management (NP-only; 148 participants); (4) NP plus guideline-based clinical decision support for symptom management (NP-DSS; 155 participants), and (5) the complete SCH intervention that included automated self-management coaching and NP follow-up with decision support (167 participants).
Cost-Effectiveness Analysis
The purpose of this study was to perform a cost-effectiveness analysis to determine what combination of the SCH intervention components is most cost-effective. Our outcome metric was the incremental cost-effectiveness ratio (ICER), which measures the additional cost required to gain 1 additional unit of effectiveness. This study was conducted from a health care sector perspective, incorporating both payer-covered costs and patient out-of-pocket expenditures.
Model Structure
A Markov simulation model was constructed to estimate the cost-effectiveness of the 5 intervention groups. The model is designed to simulate progression through health care utilization outcomes, focusing events such as unplanned hospitalizations and emergency department (ED) visits. The model was run using a 1-week cycle over a 26-week time (or 6-month) horizon on a modeled population of 10 000 hypothetical patients. A 26-week time horizon was selected based on the maximum participation duration, regardless of the patient’s treatment schedule. Each intervention group was evaluated with respect to both effectiveness and cost. No mortality was observed; hence, it was not considered in the model. Unplanned health care utilization was collected from the medical record. The structure of the Markov model is illustrated in Figure 1. The model was programmed in TreeAge Pro 2018 software (TreeAge Software).
Illustration of the Structure of the Markov Model of Treatment Groups and Unplanned Health Care UtilizationED indicates emergency department; SCC, the group that received automated self-management coaching (SCC) alone; SCC-AT, SCC with an activity tracker visible to the participant; NP, nurse practitioner (NP) follow-up using best practices for symptom management; NP-DSS, NP follow-up plus guideline-based clinical decision support for symptom management (DSS); and complete SCH, participants received SCC and activity tracker with NP follow-up with DSS.
Effectiveness
The effectiveness of each group was measured by a 1-point reduction in total symptom burden score, which ranges from 0 to 10, with 0 indicating the most effective status and 10 representing the worst, defined using a weekly mean. The daily automated calls identified symptom presence, and if a symptom was present, a 1 to 10 scale was used to report severity and distress. Severity scores were categorized as 0, indicating symptom not endorsed; 1 to 3, mild; 4 to 7, moderate; and 8 to 10, severe. For each intervention group, the total burden was computed as the integral of the quadratic curve, with initial differences in group randomization adjusted formally through the analysis model. Details on the inferential analysis are discussed in elsewhere.^9^ Weekly symptom burden scores by group are presented in the eTable in Supplement 1.
Cost
Our model included the costs of the interventions as well as costs of health care encounters that can be avoided with the intervention, such as unplanned hospitalizations and ED visits. The likelihood of unplanned hospitalization and ED visits was estimated by counting the number of each type of visit during the study’s follow-up period (Table 1). The mean number of ED visits, conditional on incurring any visits, the mean number of unplanned hospitalizations, conditional on incurring any visits, and the length of stay for unplanned hospitalization were also included.
We used mean expenditure by event type from the Medical Expenditure Panel Survey^10^ to estimate costs for unplanned hospitalizations and ED visits. Weekly total estimated unplanned hospitalization costs were calculated as the product of the likelihood of hospitalization, the per-night hospitalization cost, and the mean length of stay. Similarly, weekly total ED costs were calculated by multiplying the likelihood of an ED visit by the mean cost per visit. All costs were adjusted to 2023 US dollars using the Personal Consumption Expenditures price index.^11^
SCH development costs included programming the SCH web interface, developing the SCH project script, testing and delivering production, and hosting and supporting fees for clinics, yielding a total value of $491 118 in 2023 US dollars. Additionally, the NP time spent on the intervention was reported at the start of the intervention. Mean monthly NP hours were 20 hours for NP-DSS and complete SCH groups, 11.5 hours for the NP-only group, and no NP hours for SCC and SCC-AT groups. The mean hourly wage for NPs in Utah^12^ was used to calculate total labor costs for the intervention. Total intervention cost per person for each group is summarized in Table 2.
Statistical Analysis
The base case analysis used the point estimates (mean and SD) for each input parameter value. To determine model robustness regarding base case probabilities of unplanned health care use and cost estimates, we performed a probabilistic sensitivity analysis to assess the impact of uncertainty in all transition probabilities and costs (Table 3). The study was conducted using 1000 second-order Monte Carlo simulations for 1000 hypothetical patients, in which all model parameters varied simultaneously rather than individually, based on random drawings from a distribution. Transition probabilities were modeled using a β distribution, while cost estimates followed a γ distribution. Symptom burden scores were held constant across simulations, as we did not have individual-level data to estimate variability.
All statistical analyses were performed using SAS software version 9.4 (SAS Institute). The cost-effectiveness model was developed and executed in TreeAge Pro Healthcare 2024 (TreeAge Software). Data were analyzed from 2021 to 2024.
Results
Demographics
Of 1244 patients found eligible and invited to participate, 884 (83.7%) consented to participate, with 757 participants (mean [SD] age, 59.2 [12.9] years; 463 [61.2%] female) reporting symptoms at least once and whose data were analyzed (127 participants did not participate after consenting: 18 became ineligible; 109 reconsidered and never participated after consent).^9^ There were no group differences between individuals who declined participation vs participants, but they were more likely to be Black, unmarried, or with less education.
There were 143 participants in the SCC group, 144 participants in SCC-AT; 148 participants in the NP-only group, 155 participants in the NP-DSS group, and 167 participants in the complete SCH group. The variation in group size was naturally occurring due to the complexity of randomization across the 5 groups in 2 accrual sites and did not significantly impact power.
Overall, 474 participants were married or partnered (62.6%), with 240 participants (31.7%) self-identifying as Black, 29 participants (3.8%) as Hispanic, and 488 participants (64.5%) as White. The most common cancer diagnoses were breast (132 participants [17.4%]), lung (107 participants [14.1%]), colorectal (99 participants [13.1%]), ovarian (63 participants [8.3%]), and pancreatic (62 participants [8.2%]). Nearly half of participants had metastatic cancer (369 participants [48.7%]). There were no significant differences across groups for patient demographic or disease characteristics. The mean (SD) time in the study was 69.6 (25.6) days, with a maximum of 26 weeks. The median (IQR) daily reporting adherence was 75.6% (3.9%-100%).
Base Case
In our base case analysis, we found that the 6-month mean total cost, including intervention cost and unplanned health care costs, ranged from 23 992 (NP) (Table 3). The estimated 6-month symptom severity score was lowest for the complete SCH group, at 4.5, and highest for the SCC-AT group, at 6.9. The SCC, SCC-AT, and NP-only groups were eliminated from consideration because they were either absolutely dominated (more costly and less effective than NP-DSS or complete SCH) or extendedly dominated (less cost-effective than a combination of the 2 more efficient strategies). Among the 2 nondominated groups, the complete SCH group yielded greater effectiveness (ie, lower symptom burden score) compared with NP-DSS (5.3) but at higher costs, at 14 590. The ICER for the complete SCH group compared with NP-DSS was 4957.
Sensitivity Analyses
The results from the probabilistic sensitivity analysis are consistent with those from the base case analysis (Figure 2). This figure is a cost-effectiveness acceptability curve that depicts the proportion of the 1000 Monte Carlo simulations in which each strategy is cost-effective for a range of willingness-to-pay (WTP) thresholds. For WTP thresholds more than approximately $20, the complete SCH intervention was the strategy that was most frequently cost-effective.
Cost-Effectiveness Acceptability Curve by Willingness-to-Pay ThresholdSCC indicates automated self-management coaching (SCC) alone; SCC-AT, SCC with an activity tracker visible to the participant; NP, nurse practitioner (NP) follow-up using best practices for symptom management; NP-DSS, NP follow-up plus guideline-based clinical decision support for symptom management (DSS); and complete SCH, participants received SCC and activity tracker with NP follow-up with DSS.
Discussion
This cost-effectiveness study of the intervention components of the SCH ePRO monitoring and management system found that the most cost-effective component was the complete SCH intervention that included both automated self-care management coaching tailored to reported daily symptom severity paired with NP telephone follow-up for symptoms of moderate and higher severity using guideline-based symptom management decision support. The cost-effectiveness analysis considered development costs, operating costs, degree of symptom improvement, and unplanned health care utilization costs (ED visits and unplanned hospitalizations). These findings are consistent with our primary aim analysis of the symptom burden reduction of the various components that also favored the complete SCH system.^9^ This may reflect the favorable health care cost reduction that can be obtained when interventions are multicomponent, targeting different aspects of symptom care. In the case of SCH, the automated self-management coaching is tailored to the patient’s symptom report, providing just-in-time suggestions on what the patient should do. Symptoms that are poorly controlled and prone to escalating are addressed emergently by an NP. The combination provides both timely action for decreasing escalating symptoms and tailored patient guidance and reassurance in maintaining ongoing symptom control, resulting in reduced symptom burden, which results in cost-effectiveness.
The value of ePRO symptom monitoring combined with systematically delivered interventions is also multicomponent.^13^ Besides the demonstrated improvement in symptom control and reduction in unplanned health care utilization, these systems engage patients in their care and improve their care experience and feeling of being connected to the oncology team during the time between clinic visits.^14^ Value-driven care is a function of both quality and cost. Quality is a combined measure of care outcomes and patient experience. Components should demonstrate both quality and cost-effectiveness to optimize an ePRO monitoring and management system.
While overall there are few reports of cost-effectiveness, several groups have reported ePRO system cost-effectiveness compared with usual care.^6,15,16,17^ While variable in design and results, these evaluations demonstrate good value for the cost when the ePRO system was compared to standard symptom management. Further work is needed to fully understand the return on investment for oncology practices. One of the issues in cost-effectiveness studies is their application to actual clinical practice due to the restricted sample size of a study and the much larger number of patients that would benefit from an ePRO system in a practice setting over time. In addition, actual cost-effectiveness can vary based on the clinical context, capital investment, organizational structure, workflow processes, and the value assessment perspective taken for the analysis, whether patient, health care system, or societal.^18^
To our knowledge, there are limited, if any, publications other than ours that demonstrate optimizing the components of a digital ePRO system prior to moving forward with pragmatic implementation. As digital monitoring tools extend beyond assessment into the management of symptoms, it is key to understand, among the growing array of components that could be added, which ones actually add value These findings suggest that the optimal SCH intervention for improved symptom outcomes, positive patient experience, and cost-effectiveness requires our complete multicomponent SCH intervention.
Limitations
While our systematic examination of the optimal SCH intervention components has numerous strengths, we also acknowledge several limitations. First the analysis focused solely on determining cost-effectiveness within components of SCH and was not designed to compare to current usual care. Understanding how ePRO symptom tools compare in cost-effectiveness to current symptom care practices or other ePRO systems would be useful when considering adoption among oncology practices. Additionally, in terms of our approach to the cost-effectiveness analysis, we did not use a standard utility measure, the quality-adjusted life-year, therefore limiting comparison to other cost-effectiveness studies. Since the primary intent of SCH is to decrease symptom burden, we used our rich longitudinal dataset of symptom severity rather than a quality-of-life measure that includes other factors that dilute the interpretation for symptom burden. We also only included Medical Expenditure Panel Survey data. which, as any data source, does have some limitations, such as indirect contributors, including lost wages or family caregiver costs in providing care. Additionally, we only included ED visits and unplanned hospitalization that occurred within the participating health systems. This may have underrepresented utilization, since use outside of the system would not have been counted. However, since the groups were randomized, we believe any underreporting would be equally distributed across groups.
Conclusions
This economic evaluation found that the value of ePRO digital health symptom management components can be determined by examining components for quality and cost. We found that the complete SCH intervention was the most cost-effective intervention combination, demonstrating that ePRO interventions that are comprehensive and target several components of symptom care bring the greatest value.
The value of ePRO symptom monitoring and management for symptom control in oncology clinical practice is receiving increasing interest in both academic and community practices as well as in payer models, including the Centers for Medicare & Medicaid Services Enhancing Oncology Model program.^6,19,20^ Value-focused models incentivize the implementation of ePROs, yet reimbursement in fee-for-service models remain limited.^20^ Health system decisions to adopt these systems will be guided by their quality, costs, and reimbursement models.
The reference list from the paper itself. Each links out to its DOI / PubMed record.
- 1Basch E, Deal AM, Dueck AC, . Overall survival results of a trial assessing patient-reported outcomes for symptom monitoring during routine cancer treatment. JAMA. 2017;318(2):197-198. doi:10.1001/jama.2017.715628586821 PMC 5817466 · doi ↗ · pubmed ↗
- 2Mooney KH, Beck SL, Wong B, . Automated home monitoring and management of patient-reported symptoms during chemotherapy: results of the symptom care at home RCT. Cancer Med. 2017;6(3):537-546. doi:10.1002/cam 4.100228135050 PMC 5345623 · doi ↗ · pubmed ↗
- 3Daly B, Nicholas K, Flynn J, . Analysis of a remote monitoring program for symptoms among adults with cancer receiving antineoplastic therapy. JAMA Netw Open. 2022;5(3):e 221078. doi:10.1001/jamanetworkopen.2022.107835244701 PMC 8897754 · doi ↗ · pubmed ↗
- 4Roy M, Fardeen T, Generalova O, . MA 10.06 healthcare utilization with an electronic patient reported outcome (e PRO) tool for symptom management in thoracic cancers. J Thorac Oncol. 2021;16(3):S 170-S 171. doi:10.1016/j.jtho.2021.01.243 · doi ↗
- 5Riis CL, Stie M, Bechmann T, . e PRO-based individual follow-up care for women treated for early breast cancer: impact on service use and workflows. J Cancer Surviv. 2021;15(4):485-496. doi:10.1007/s 11764-020-00942-333415653 · doi ↗ · pubmed ↗
- 6Patt DA, Patel AM, Bhardwaj A, . Impact of remote symptom monitoring with electronic patient-reported outcomes on hospitalization, survival, and cost in community oncology practice: the Texas Two-Step Study. JCO Clin Cancer Inform. 2023;7(7):e 2300182. doi:10.1200/CCI.23.0018237897263 PMC 10642897 · doi ↗ · pubmed ↗
- 7Colbert JA, Potters L. Overcoming barriers to make patient-reported outcome collection the standard of care in oncology. JAMA Oncol. 2025;11(3):233-234. doi:10.1001/jamaoncol.2024.615739820974 · doi ↗ · pubmed ↗
- 8Mooney K, Berry DL, Whisenant M, Sjoberg D. Improving cancer care through the patient experience: how to use patient-reported outcomes in clinical practice. Am Soc Clin Oncol Educ Book. 2017;37(37):695-704. doi:10.1200/EDBK_17541828561689 · doi ↗ · pubmed ↗