Multilingualism Among First-Year Resident Physicians
Pilar Ortega, Montserrat Tijerina, Rahardhika Utama, Kenji Yamazaki, Sean O. Hogan, Lisa C. Diamond, Muveddet Harris

TL;DR
This study examines the language skills of first-year resident physicians and how well they match the language needs of the population.
Contribution
It provides new insights into the multilingual capabilities of resident physicians in relation to community language demands.
Findings
Resident physicians demonstrate proficiency in multiple languages.
There is a correlation between resident languages and population language needs.
Abstract
This cohort study characterizes the non–English language proficiency of postgraduate year-1 resident physicians and compares resident physicians languages with population language needs.
Genes, proteins, chemicals, diseases, species, mutations and cell lines named across the full text — each resolved to its canonical identifier and authoritative record.
Click any figure to enlarge with its caption.
 Figure
| Variable | PGY1 resident physicians, No./total No. (%) | |||||
|---|---|---|---|---|---|---|
| By language proficiency (n = 107 610) | By heritage language exposure (n = 80 972) | |||||
| English only (n = 29 748) | Multilingual | English only (n = 20 164) | Multilingual | |||
| Novice or intermediate (n = 37 576) | Advanced or native (n = 40 286) | Nonheritage learner (n = 32 597) | Heritage learner (n = 28 211) | |||
|
| ||||||
| American Indian or Alaska Native | 84/124 (67.7) | 35/124 (28.2) | 5/124 (4.0) | 59/111 (53.2) | 40/111 (36.0) | 12/111 (10.8) |
| Asian | 1934/30 023 (6.4) | 9290/30 023 (30.9) | 18 799/30 023 (62.6) | 1212/19 598 (6.2) | 2963/19 598 (15.1) | 15 423/19 598 (78.7) |
| Black or African American | 3169/7737 (41.0) | 2473/7737 (32.0) | 2095/7737 (27.1) | 1987/5303 (37.5) | 1742/5303 (32.8) | 1574/5303 (29.7) |
| Hispanic, Latino, or of Spanish origin | 860/11 199 (7.7) | 2606/11 199 (23.3) | 7733/11 199 (69.1) | 623/7803 (8.0) | 2173 (27.8) | 5007/7803 (64.2) |
| Multiple race/ethnicity | 1520/5294 (28.7) | 2273/5294 (42.9) | 1501/5294 (28.4) | 1047/4252 (24.6) | 2053/4252 (48.3) | 1152/4252 (27.1) |
| Native Hawaiian or Other Pacific Islander | 38/232 (16.4) | 85/232 (36.6) | 109/232 (47.0) | 22/159 (13.8) | 59/159 (37.1) | 78/159 (49.1) |
| Unknown | 166/2446 (6.8) | 576/2446 (23.5) | 1704/2446 (69.7) | 90/1375 (6.5) | 214/1375 (15.6) | 1071/1375 (77.9) |
| White | 21 977/50 555 (43.5) | 20 238/50 555 (40.0) | 8340/50 555 (16.5) | 15 124/42 371 (35.7) | 23 353/42 371 (55.1) | 3894/42 371 (9.2) |
|
| ||||||
| Canadian | 3/38 (7.9) | 9/38 (23.7) | 26/38 (68.4) | 2/15 (13.3) | 7/15 (46.7) | 6/15 (40.0) |
| International | 2219/22 270 (10.0) | 3154/22 270 (14.2) | 16 897/22 270 (75.9) | 857/4303 (19.9) | 1243/4303 (28.9) | 2203/4303 (51.2) |
| US allopathic | 20 074/64 647 (31.1) | 26 570/64 647 (41.1) | 18 003/64 647 (27.8) | 14 829/61 403 (24.2) | 25 719/61 403 (41.9) | 20 855/61 403 (34.0) |
| US osteopathic | 7452/20 655 (36.1) | 7843/20 655 (38.0) | 5360/20 655 (26.0) | 4476/15 251 (29.3) | 5628/15 251 (36.9) | 5147/15 251 (33.7) |
|
| ||||||
| Multilingual heritage learner | NA | 8149/28 211 (28.9) | 19 202/28 211 (68.1) | NA | NA | NA |
| Multilingual nonheritage learner | NA | 20 902/32 597 (64.1) | 3526/32 597 (10.8) | NA | NA | NA |
Peer Reviews
No public reviews on file for this paper yet. If you reviewed it on a platform where reviews are public (OpenReview, ICLR, NeurIPS, ICML), you can paste yours below so the community can read it here.
Videos
No videos yet. Explain this paper in a talk, walkthrough, or lecture? Add one.
Taxonomy
TopicsInterpreting and Communication in Healthcare · Second Language Learning and Teaching · Cultural Competency in Health Care
Introduction
When clinicians and patients communicate directly in a shared language (termed language-concordant care), health outcomes and satisfaction improve as costs decrease.^1^ More than 68 million US persons speak a non-English language at home.^2^ Despite legal and Joint Commission standards, physicians often resort to limited language skills and underuse interpreters. Clinical learning environments may be underequipped to identify the language skills of trainees and provide accessible resources to ensure safe patient care in non-English languages.^3^
The aims of this study were to characterize the language skills of postgraduate year-1 (PGY1) resident physicians, explore factors associated with advanced multilingualism, and compare PGY1 resident physician languages with population language needs.
Methods
We conducted a retrospective cohort study, analyzing the languages and proficiency levels of physicians completing their first year of residency between 2022 and 2024. We included resident physicians with an Association of American Medical Colleges ID and Electronic Residency Application System (ERAS) language data and who were in the Accreditation Council for Graduate Medical Education (ACGME) database (eMethods in Supplement 1). This study was deemed exempt by the American Institutes for Research Institutional Review Board as secondary analysis of existing data and followed the STROBE reporting guideline.
The primary outcome was self-assessed language proficiency^4^ from the ERAS application (eTable in Supplement 1). Secondary variables included heritage language exposure (non-English language use in childhood homes), race and ethnicity, and medical school type (eTable in Supplement 1). Race and ethnicity are reported as given in the ACGME database.
For each of the top 40 languages reported by the American Community Survey,^2^ we calculated the number of PGY1 resident physicians with advanced or native skills per 100 000 US persons with limited English proficiency (LEP). Data were analyzed using R version 4.5.0 (R Foundation for Statistical Computing). A 2-sided P < .05 was considered statistically significant.
Results
Of 116 552 PGY1 resident physicians, 107 610 had sufficient data to be included. Of these, 77 862 (72.3%) reported non-English language skills at any proficiency level. Across PGY1 resident physicians, 40 286 (37.4%) reported advanced or native and 37 576 (34.9%) indicated novice or intermediate multilingualism (Table). Compared with White PGY1 resident physicians, Asian residents had higher odds of advanced or native multilingualism (odds ratio [OR], 8.5 [95% CI, 8.2-8.8]; P < .001); as did Black or African American residents (OR, 1.9 [95% CI, 1.8-2.0]; P < .001); residents who identify as Hispanic, Latino, or of Spanish origin (OR, 11.3 [95% CI, 10.8-11.8]; P < .001); and Native Hawaiian or Other Pacific Islander residents (OR, 4.5 [95% CI, 3.5-5.8]; P < .001).
Of the 80 972 (75.2%) PGY1 resident physicians with heritage language data, 94.7% (76 654) were US medical graduates and 34.8% (28 211) reported frequent non-English language childhood exposure (termed heritage learners) (Table). Heritage learners had higher odds of advanced or native proficiency compared with nonheritage learners (OR, 13.9 [95% CI, 13.3-14.6]; P < .001).
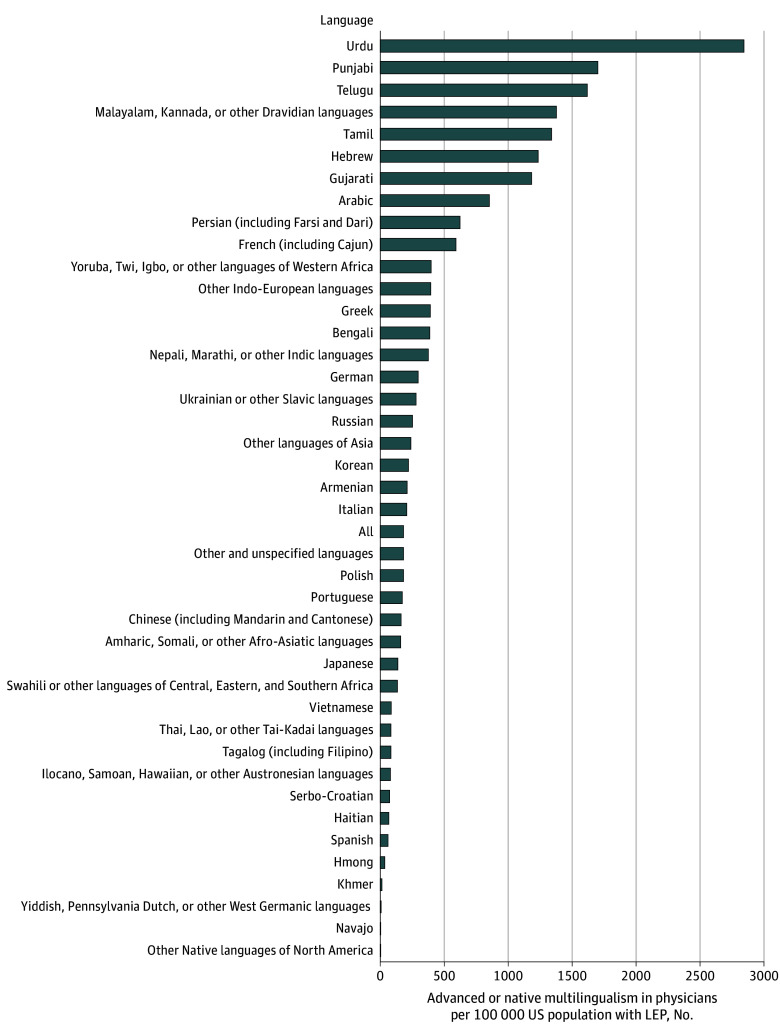
For every 100 000 US persons with LEP, 182 PGY1 resident physicians reported advanced or native skills across all non-English languages (Figure). Four of the top 5 population languages (Spanish, Tagalog, Vietnamese, and Chinese) had among the lowest ratios of language-concordant physicians.
Languages Spoken With Advanced or Native Proficiency by First-Year Resident Physicians From 2022-2024 Relative to US Population NeedUS population data are an average of yearly estimates for 2021-2023 from the American Community Survey, which reports the number of persons aged 5 years and over who speak English less than “very well” and are thus categorized as having limited English proficiency (LEP). The term all denotes all languages represented by persons who indicated speaking a non-English language at home and were categorized as LEP; in the study time frame, there were 182 postgraduate year-1 resident physicians with at least advanced proficiency across all reported non-English languages for every 100 000 persons with LEP.
Discussion
Multilingualism is common among resident physicians. The prevalence of PGY1 advanced or native-level skills in our study (37.4%) contrasts with 49.7% previously reported among 2013 ERAS applicants.^5^ This difference may point to a more linguistically diverse population of applicants compared with those who successfully match.
More than two-thirds of heritage learners reported advanced or native proficiency compared with one-tenth of nonheritage learners. This finding supports prior work^6^ indicating that heritage exposure is associated with, but not a proxy for, advanced proficiency. Heritage learners, who often have valuable cultural ties to the language and community, should not be assumed to be ready for language-concordant care without training and testing.^6^
Limitations include lack of language data from sources outside of ERAS and American Medical College Application Service, potentially underestimating international and Canadian medical school graduates who did not complete those applications. Also, the available data did not capture signed languages and did not disaggregate certain language groupings (eg, Chinese).
Understanding the self-assessed language skills of medical student, resident, and faculty applicants may help institutions tailor language resources—such as interpreters, education, and testing^6^—to learner and clinician proficiency levels for locally prevalent languages. Future research should evaluate patient outcomes and language-specific population needs.
The reference list from the paper itself. Each links out to its DOI / PubMed record.
- 1Diamond L, Izquierdo K, Canfield D, Matsoukas K, Gany F. A systematic review of the impact of patient-physician non-English language concordance on quality of care and outcomes. J Gen Intern Med. 2019;34(8):1591-1606. doi:10.1007/s 11606-019-04847-5 31147980 PMC 6667611 · doi ↗ · pubmed ↗
- 2U.S. Census Bureau. Language Spoken at Home by Ability to Speak English for the Population 5 Years and Over. American Community Survey, ACS 5-Year Estimates Detailed Tables, Table B 16001, 2021, 2022, and 2023. Accessed on August 24, 2025. https://data.census.gov/table?q=B 16001
- 3Dube AR, Ortega P, Hardin DM Jr, . Improving assessment and learning environments for graduate medical trainees to advance healthcare language equity. J Gen Intern Med. 2024;39(4):696-705. doi:10.1007/s 11606-023-08527-3 38093027 PMC 10973305 · doi ↗ · pubmed ↗
- 4Diamond L, Toro Bejarano M, Chung S, . Factors associated with accuracy of self-assessment compared with tested non-English language proficiency among primary care providers. Med Care. 2019;57(5):385-390. doi:10.1097/MLR.0000000000001105 30844905 PMC 6459717 · doi ↗ · pubmed ↗
- 5Diamond L, Grbic D, Genoff M, . Non-English-language proficiency of applicants to US residency programs. JAMA. 2014;312(22):2405-2407. doi:10.1001/jama.2014.15444 25490332 PMC 4512180 · doi ↗ · pubmed ↗
- 6Ortega P, Figueroa JA, Gregorich SE, . An exploratory investigation of heritage and educational language exposures as factors in medical student Spanish language proficiency. J Gen Intern Med. 2025;40(8):1789-1796. doi:10.1007/s 11606-025-09357-1 39843665 PMC 12119402 · doi ↗ · pubmed ↗