Domain-substituted IGF2 tag modulates targeting of lentiviral gene therapy for Hunter syndrome
Fabio Catalano, Dejan Stevic, Giacomo Zundo, Tessa F Huizer, Zina Dammou, Eva C Vlaar, Drosos Katsavelis, Jeroen C van den Bosch, Hannerieke J M P van den Hout, Esmeralda Oussoren, Ans T van der Ploeg, George J G Ruijter, Gerben Schaaf, W W M Pim Pijnappel

TL;DR
A new IGF2-based tag called SWAP improves gene therapy for Hunter syndrome by targeting specific receptors while avoiding others.
Contribution
The SWAP tag design allows modular receptor targeting while preserving lysosomal delivery and reducing off-target interactions.
Findings
Deleting IGF2's central loop preserves CI-M6P/IGF2R binding but eliminates IR-A and IGF1R binding.
Replacing the central loop with ApoE or RAP12 epitopes enables new receptor targeting like LRP-1.
SWAP-tagged IDS gene therapy corrected Hunter syndrome pathology in multiple tissues in mice.
Abstract
We present the SWAP design, a novel, structurally cohesive IGF2-based tag for modular receptor targeting during gene therapy for lysosomal storage disorders (LSDs). We found that IGF2’s central loop is critical for high-affinity binding to the insulin receptor (IR) and IGF1 receptor (IGF1R)—both involved in glucose homeostasis—but is not required for interaction with the cation independent mannose 6-phosphate/IGF2 receptor (CI-M6P/IGF2R)—a key target for lysosomal delivery. This formed the basis for designing the Substitution of the central-loop With Augmenting Peptides (SWAP) tag. By replacing the central loop with alternative epitopes, SWAP ensures high-affinity multimodal receptor targeting while maintaining structural integrity. In vivo, lentiviral gene therapy employing IDS fused to SWAP variants containing ApoE and RAP12x2 inserts corrected Hunter disease pathology across multiple…
Genes, proteins, chemicals, diseases, species, mutations and cell lines named across the full text — each resolved to its canonical identifier and authoritative record.
Click any figure to enlarge with its caption.
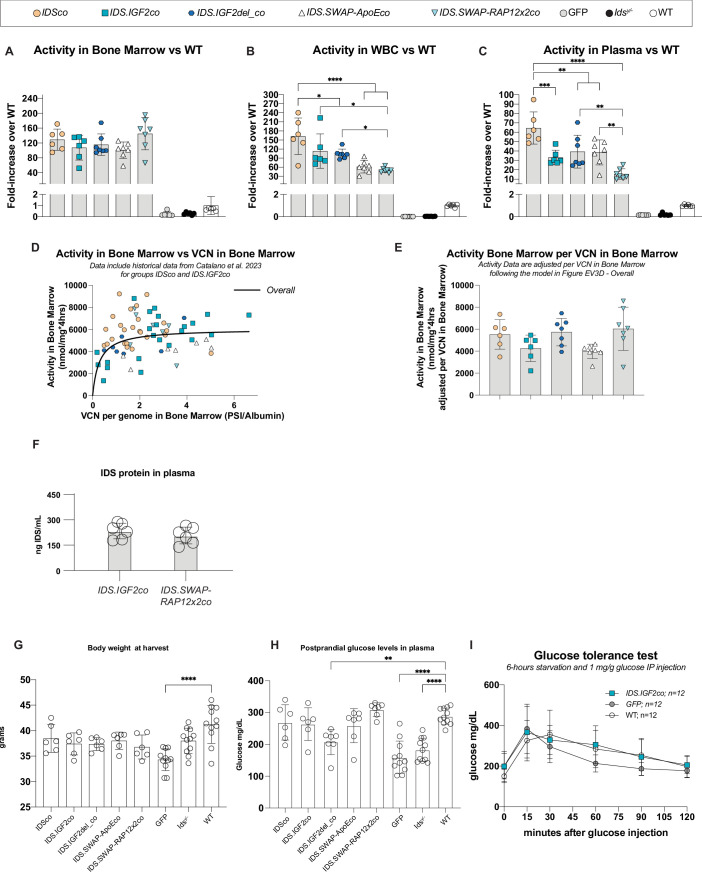 Figure 10
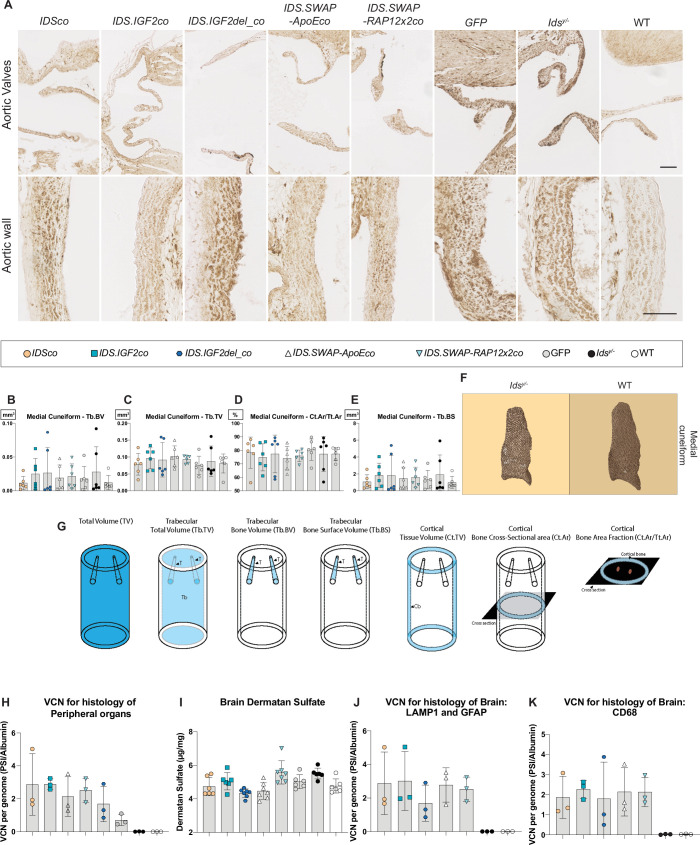 Figure 11
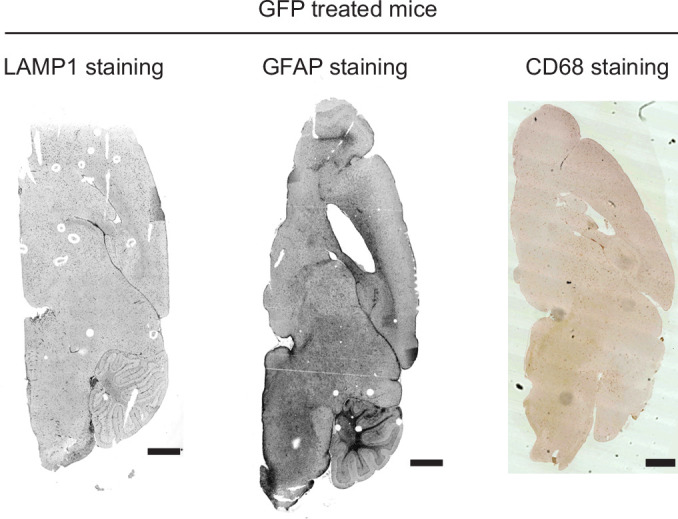 Figure 12
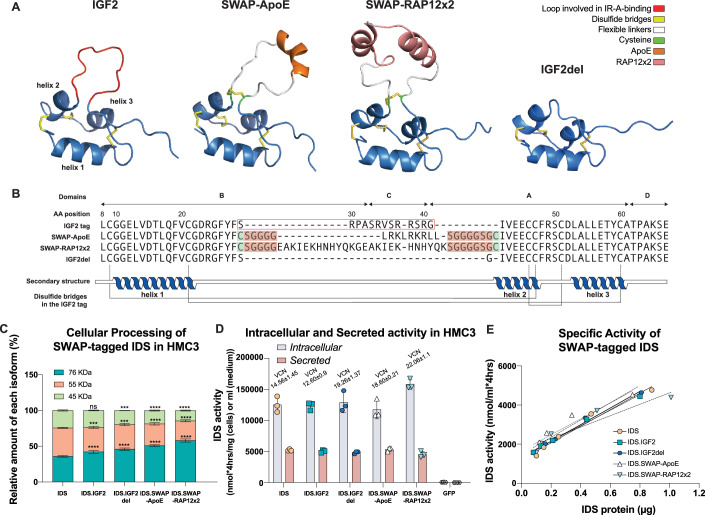 Figure 1
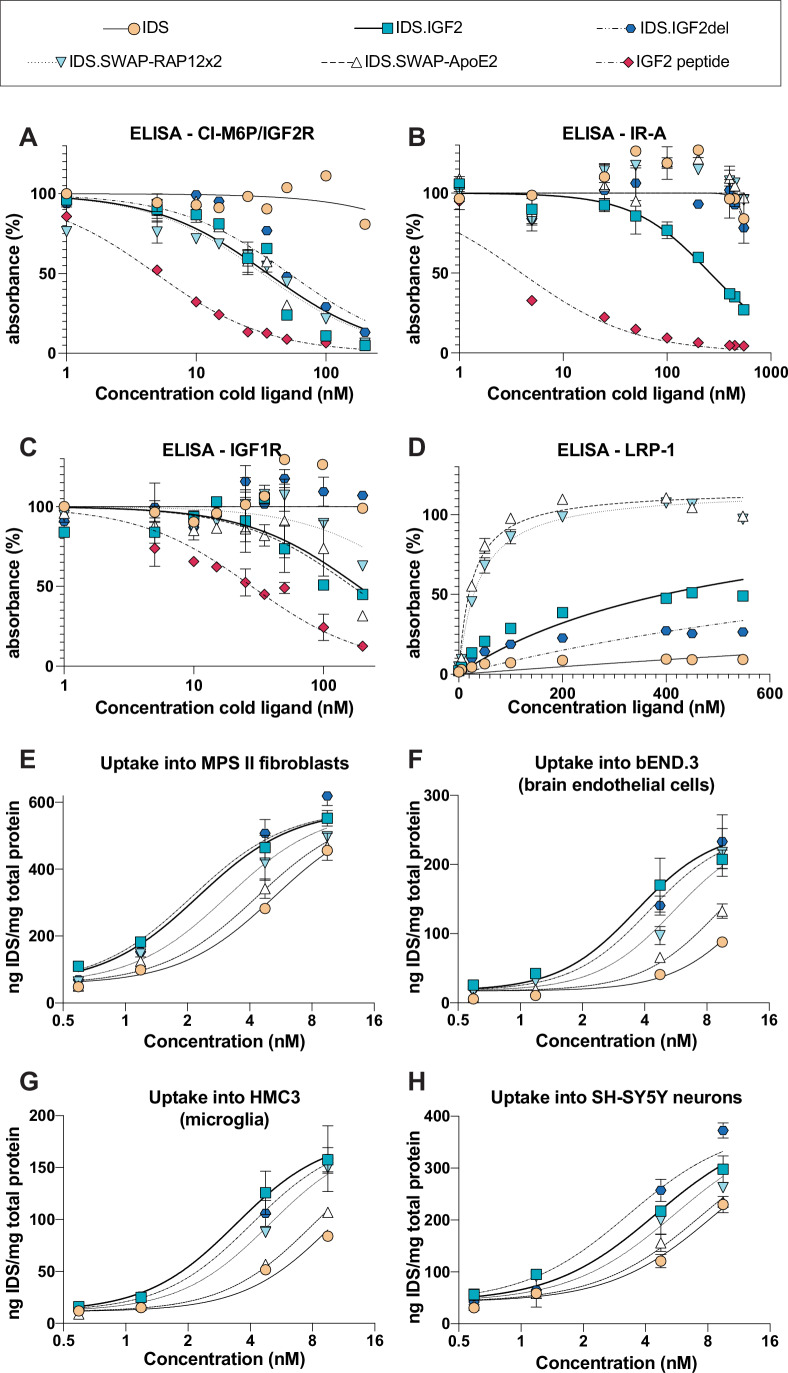 Figure 2
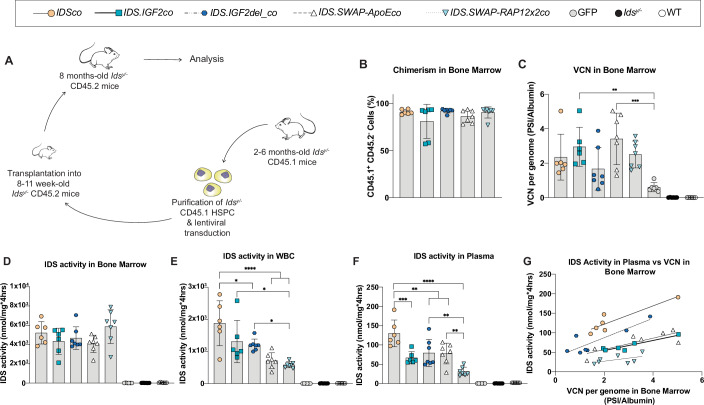 Figure 3
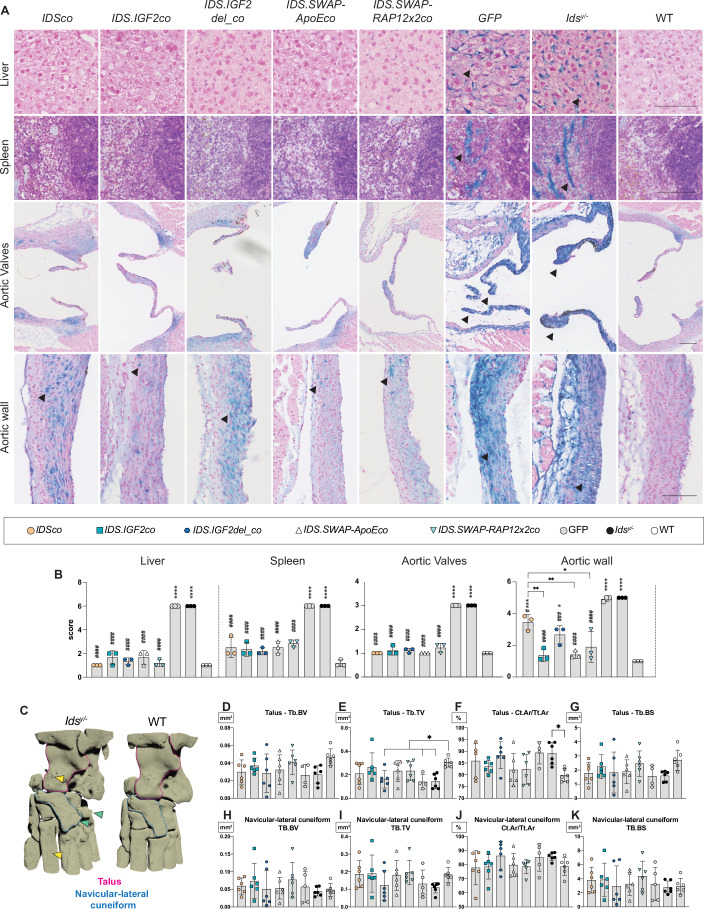 Figure 4
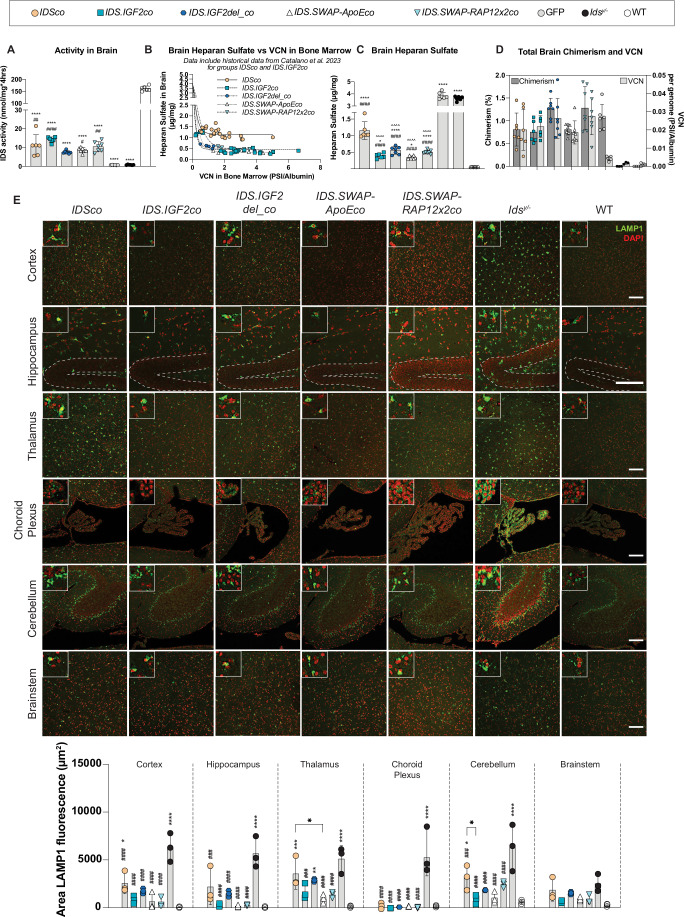 Figure 5
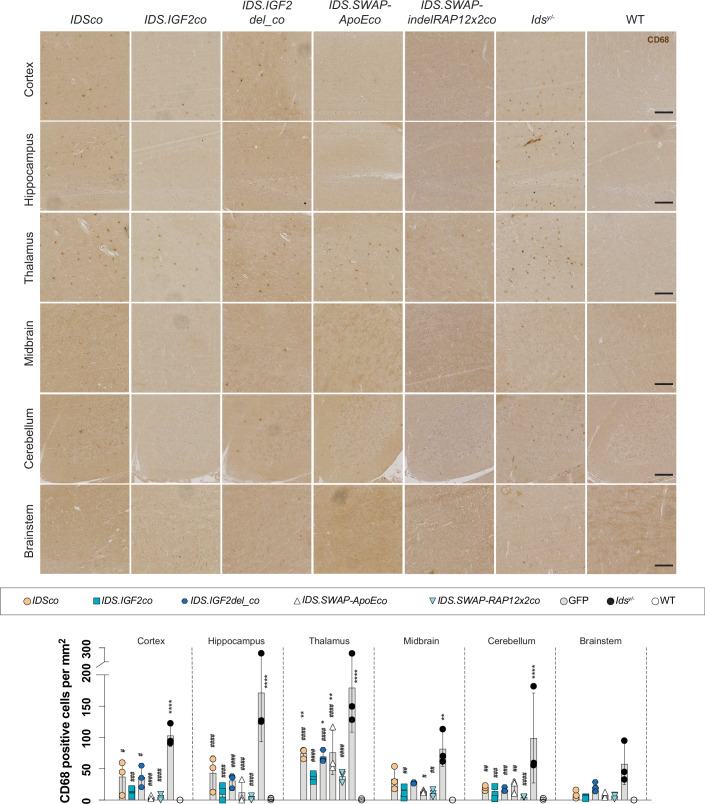 Figure 6
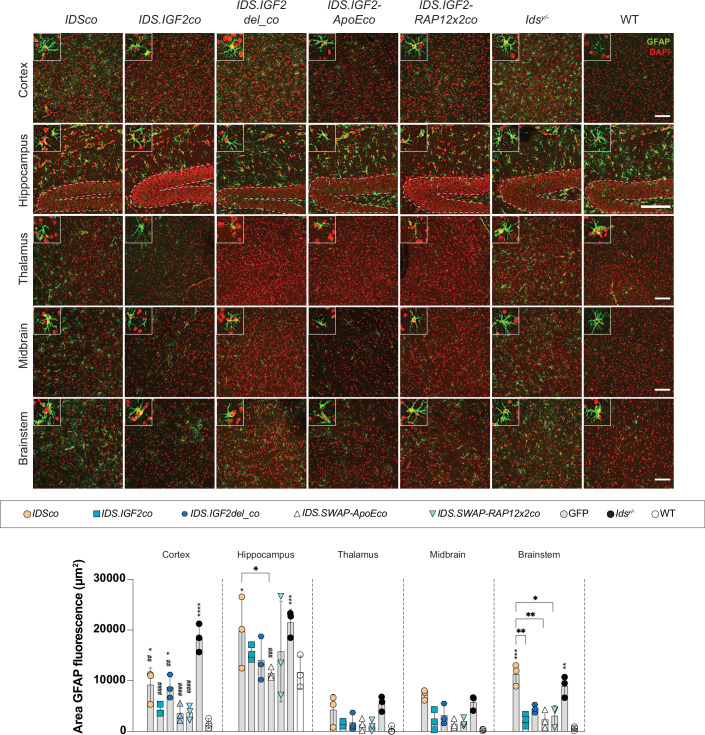 Figure 7
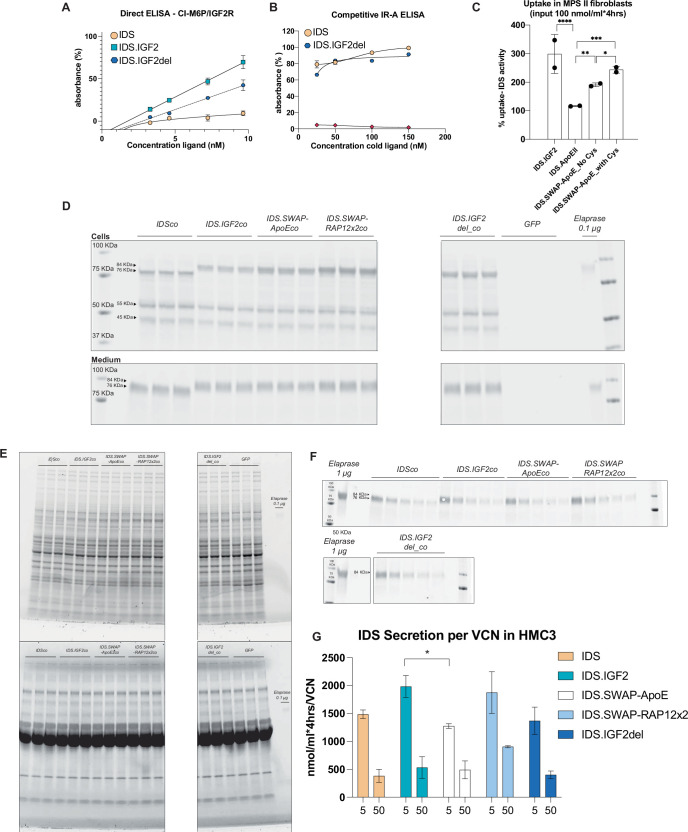 Figure 8
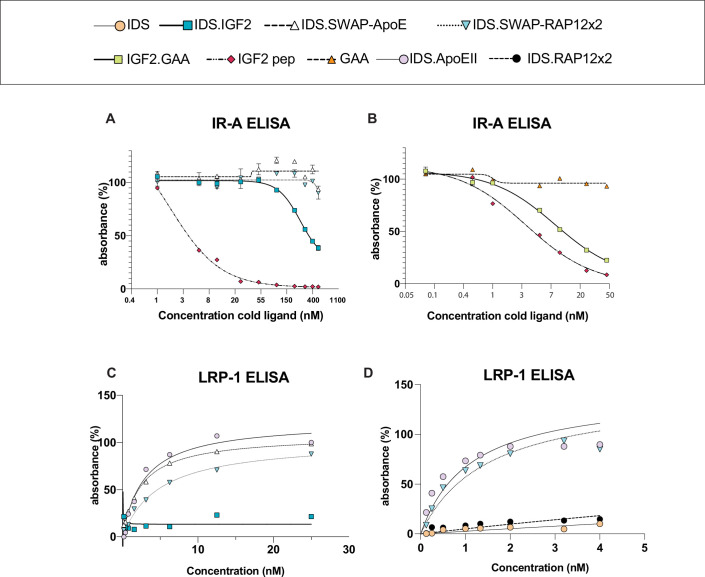 Figure 9
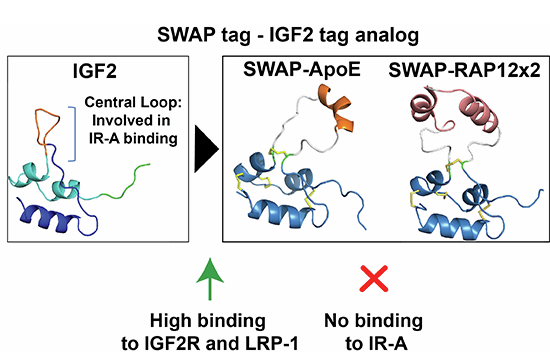 Figure 13
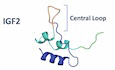 Figure 14
- —http://dx.doi.org/10.13039/100016062Stichting Metakids (Metakids)
- —http://dx.doi.org/10.13039/100030872EMC | Erasmus MC Sophia Kinderziekenhuis (Erasmus MC Sophia)
- —http://dx.doi.org/10.13039/501100004243Prinses Beatrix Spierfonds (Het Prinses Beatrix Spierfonds)
- —http://dx.doi.org/10.13039/501100008358Hersenstichting (Hersenstichting Nederland)
- —http://dx.doi.org/10.13039/501100010573Stichting Dioraphte (Dioraphte)
- —For Wishdom Foundation
- —http://dx.doi.org/10.13039/501100003246Nederlandse Organisatie voor Wetenschappelijk Onderzoek (NWO)
Peer Reviews
No public reviews on file for this paper yet. If you reviewed it on a platform where reviews are public (OpenReview, ICLR, NeurIPS, ICML), you can paste yours below so the community can read it here.
Videos
No videos yet. Explain this paper in a talk, walkthrough, or lecture? Add one.
Taxonomy
TopicsHereditary Neurological Disorders · Lysosomal Storage Disorders Research · Neurogenetic and Muscular Disorders Research
Introduction
Lysosomal storage disorders (LSDs) are monogenic inherited conditions caused by defects in lysosomal function. The collective incidence of LSDs is approximately 1 in 5000 living newborns, with manifestations affecting multiple tissues and organs (Kido et al, 2023). Gene therapy is a promising one-time treatment option (Kido et al, 2023; Sevin and Deiva, 2021; Massaro et al, 2021), though it may be limited in efficacy by suboptimal delivery of therapeutic enzymes to critical tissues (Miwa et al, 2020; Smith et al, 2022; Liang et al, 2022a; Gleitz et al, 2018; Concolino et al, 2018; Vollebregt et al, 2022). To address this limitation, we previously tested insulin-like growth factor type 2 (IGF2) tagging during hematopoietic stem and progenitor cell-mediated lentiviral gene therapy (HSPC-LVGT). IGF2 tagging confers high-affinity binding to the cation-independent mannose 6-phosphate/insulin-like growth factor type 2 receptor (CI-M6P/IGF2R), resulting in enhanced delivery to the lysosome of HSPC-produced therapeutic enzymes. Using this strategy, we observed a dose-dependent enhancement of therapeutic efficacy of HSPC-LVGT upon IGF2 fusion to GAA (Pompe disease; Liang et al, 2022a) or IDS (Hunter disease; Catalano et al, 2023), with the most significant effects observed in the brain and skeletal muscles (Liang et al, 2022a; Catalano et al, 2023, 2024; Liang et al, 2024). These results have been reproduced by others, both in the context of HSPC-LVGT (Dogan et al, 2022; Yoon et al, 2024) and during AAV gene therapy (Meena et al, 2023), effectively illustrating that IGF2-tagging could be a general strategy to improve therapeutic outcomes of gene therapies for LSDs.
Together with insulin and IGF1, IGF2 is a key component of the Insulin-like Growth Factor (IGF) system, which plays a vital role in growth, development, and metabolism (Blyth et al, 2020). The “Insulin-like” attribute was assigned to IGF2 in 1976, when Rinderknecht and Humbel observed its remarkable structural similarity to pro-insulin (Miller et al, 2022). In fact, like pro-insulin, IGF2’s B domain (amino acids (AA) 1–32) and A domain (AA 41–61) form three alpha helices held together by three disulfide bonds, while domain C (AA 33–40) and domain D (AA 62–67) fold into a random-coil central loop and an N-terminal tail, respectively (Blyth et al, 2020). This structural organization is shared also by IGF1, and is accompanied by a high degree of homology in the helical cores of all these ligands (Blyth et al, 2020). Given these similarities, it is not surprising that IGF2, aside from binding to the CI-M6P/IGF2 receptor, also binds with high affinity to both insulin receptor isoform A (IR-A) and the IGF1 receptor (IGF1R) (Blyth et al, 2020). As a result, concerns arise that the use of IGF2-based therapeutics could lead to unintended activation of the IR-A and IGF1R, potentially triggering both metabolic and mitogenic pathways. An example of this concern is the clinical trial assessing the safety of reveglucosidase alpha—a GAA analog fused with IGF2 and administered intravenously as enzyme replacement therapy (ERT) for late-onset Pompe disease patients—which documented dose-dependent hypoglycemic events shortly after drug infusion. This effect was attributed to IGF2’s ability to bind the insulin receptor (IR) (Byrne et al, 2017). The ability of IGF2 to engage IR and IGF1R is primarily mediated by interactions involving its B and A domains, which are also crucial for high-affinity binding to CI-M6P/IGF2R (Frago et al, 2016). However, IGF2 binding to IR-A and IGF1R is also mediated by its central loop (Xu et al, 2020; An et al, 2024), which is not directly involved in binding to CI-M6P/IGF2R (Brown et al, 2008; Frago et al, 2016). In fact, the central loop residues R37 and R38 have been observed to interact with IR-A in structural and mutagenesis studies (An et al, 2024), while residues R30 and R38 have been observed to interact with the IGF1R in structural studies (Xu et al, 2020). This makes IGF2’s central loop a preferential engineering target to modulate receptor binding of the IGF2 tag, while preserving its interaction with the CI-M6P/IGF2R.
With the goal of developing an IGF2 tag with a more favourable ligand–receptor interaction profile, we assessed the role of IGF2’s central loop in binding to IR-A and IGF1R, and we built on this to generate a new variant called SWAP (Substitution of the central-loop With Augmenting Peptides), characterized by the replacement of the central loop of IGF2 with ligands for other receptors (ApoE and Rap12x2). SWAP retained high affinity for the CI-M6P/IGF2 receptor and now effectively also engaged LRP-1, a blood-brain barrier receptor, while showing complete loss of affinity for IR and reduced affinity for IGF1R depending on the inserted epitope (only SWAP-RAP12x2 exhibited reduced binding to IGF1R). When tested in a Mucopolysaccharidosis type II (MPS II) murine model during HSPC-LVGT using pCCL.MND lentiviral vectors (Catalano et al, 2023, 2024), tagging of IDS (Iduronate 2-sulfatase, defective in MPS II) with SWAP variants resulted in a therapeutic outcome that matched unmodified IDS.IGF2, trended superior compared to central loop-deleted IGF2 (IGF2del), and outperformed untagged IDS. This supports SWAP as an alternative to existing IGF2 tags offering modular targeting of receptors and a more favourable ligand–receptor interaction profile that has significant potential to advance gene therapy for lysosomal storage disorders.
Results
The central loop of IGF2 can be deleted or replaced to form a modular, domain-substituted IGF2 tag (SWAP tag)
With the goal of reducing binding to the IR and IGF1R while maintaining high-affinity binding to the CI-M6P/IGF2R, we first investigated whether the central loop of IGF2 is essential for its binding to the CI-M6P/IGF2R. To this end, we tested a previously optimized variant of IGF2 with a deletion of residues 30–40, corresponding to the removal of domain C and a partial removal of domains B and A of IGF2 (LeBowitz & Maga, 2012). We show here using structural modelling that this results in a complete deletion of the central loop of IGF2 (Fig. 1A,B). We referred to this version of IGF2 as IGF2del (Fig. 1B). To assess its functionality, we fused IGF2del to the C-terminus of Iduronate 2-sulfatase (IDS; IDS.IGF2del) and evaluated whether IDS.IGF2del could bind to the CI-M6P/IGF2R using a direct ELISA, as we previously showed for IDS.IGF2 (Catalano et al, 2023). In this assay, different concentrations of IDS, IDS.IGF2, or IDS.IGF2del were incubated with immobilized domain 11–13, corresponding to the IGF2 binding domain of CI-M6P/IGF2R (Catalano et al, 2023), while ligand binding was measured using an anti-IDS antibody. As expected, no appreciable binding of IDS to the CI-M6P/IGF2R was observed, while IDS.IGF2 and IDS.IGF2del bound efficiently, though IDS.IGF2del showed a slight decrease in binding affinity (Fig. EV1A).Figure 1. The central loop of IGF2 can be replaced by epitopes to form a modular, domain-substituted IGF2-based SWAP tag.(A) Structure prediction using AlphaFold (Abramson et al, 2024) of IGF2 peptide (left), SWAP with ApoE and RAP12x2 inserts, and central loop-deleted IGF2 peptide (SWAP-ApoE, SWAP-RAP12x2, IGF2del, respectively). Note that the inserted epitopes are predicted to be exposed on the surface without disrupting the native IGF2 tag structure. IGF2 sequence, linkers, inserts, helices and disulfide bonds are indicated. (B) Alignment of sequences from (A). The IGF2 peptide consists of AA 1, 8–67 of mature human IGF2. In the SWAPs, AA 29–41 of the IGF2 peptide (boxed in red) are substituted with AA 141–149 of mature human Apolipoprotein E (ApoE) flanked by flexible linkers, or AA 251–262 of the mature human receptor associated protein (RAP) in a glycine-spaced tandem repeat (RAP12x2), flanked by flexible linkers (flexible linkers are highlighted in white (A) and in red in (B)). Note that the two cysteine residues located at the edges of the insertion (marked in green in (A) and highlighted in green (B) are predicted to form a disulfide bridge (highlighted in yellow in (A)). (C) Quantification of intracellular processing of tagged IDS proteins. HMC3 cells were transduced followed by immunoblot analysis of IDS protein 10 days after transduction. See Fig. EV1D for immunoblot analysis. Results are expressed as percentage of the total amount of IDS protein. Significance versus IDS is shown. The adjusted P values were as follows: 76 KDa, IDS vs. IDS.IGF2 P = 0.000014, IDS vs. IDS.SWAP-ApoE P = <0.000001, IDS vs. IDS.SWAP-RAP12x2 P = <0.000001, IDS vs. IDS.IGF2del P = <0.000001. 55 KDa, IDS vs. IDS.IGF2 P = 0.000105, IDS vs. IDS.IGF2del P = 0.000121, IDS vs. IDS.SWAP-ApoE P = <0.000001, IDS vs. IDS.SWAP-RAP12x2 P = <0.000001. 45 KDa, IDS vs. IDS.IGF2del P = 0.000696, IDS vs. IDS.SWAP-ApoE P = 0.000048, IDS vs. IDS.SWAP-RAP12x2 P = <0.000001. (D) As (C), but now assayed for intracellular and secreted IDS enzyme activity. Lentivirus expressing GFP was included as control. Average Vector Copy Number (VCN) is shown. The adjusted P values were >0.9999, except for IDS vs IDS.SWAP-RAP12x2 (P = 0.0651), and IDS vs GFP (P = <0.0001). (E) Specific activities of tagged IDS proteins. See also Fig. EV1F and Table EV1. Data information: data represent means ± SD and were analyzed by two-way ANOVA followed by Bonferroni’s multiple testing correction (C, D) without interaction (D), or by regression analysis (E). In (C, D), a total of 6 (C) and 7 (D) conditions were analyzed; significant pairwise differences among the 5 (C) and 6 (D) relevant conditions are reported. In (C, D) comparisons vs. IDS were performed. (C–E) n = 3 biological replicates per condition. Significant comparisons are indicated by brackets. ***P ≤ 0.001; ****P ≤ 0.0001. Source data are available online for this figure.
We next tested the binding of IDS.IGF2del to the IR-A via competitive ELISA, where immobilized IR-A was incubated with a fixed concentration of biotinylated insulin in combination with varying concentrations of non-biotinylated ligands. Untagged IDS or IGF2del-tagged IDS failed to compete with insulin for binding to IR-A, whereas IDS.IGF2 competed moderately, and IGF2 peptide strongly (Fig. EV1B). These results demonstrated that the deletion of IGF2 AA 30-40 results in the loss of binding to the IR-A, while preserving binding to the CI-M6P/IGF2R.
Based on these results, we explored whether exogenous epitopes could replace the central loop of IGF2, potentially conferring binding to new, clinically relevant receptors, while abolishing binding to IR-A and retaining binding to CI-M6P/IGF2R. We therefore substituted residues 29–41 of IGF2— corresponding to a partial deletion of domain B and A and a complete deletion of domain C—with exogenous epitopes able to bind to receptors other than those normally bound by IGF2 (Fig. 1A,B). In this design, residues 29 and 41 of IGF2—a serine and a glycine, respectively, which were present at both ends of the deletion in the IGF2del—are replaced with a cysteine, while the inserted epitopes are flanked by flexible linkers (Fig. 1A,B). These modifications were based on the prediction that the inclusion of cysteines at the sides of the insertion would form a disulfide bond, helping to stabilize the helical core of IGF2 and mimicking the structural arrangement of IGF2del, while the flexible linker would ensure the correct exposure of the inserted epitopes (Fig. 1A). In line with this prediction, when this IGF2 variant was fused to IDS, the inclusion of a cysteine at both ends of an ApoE (Croy et al, 2004) insert (IDS.IGF2-central loop substituted-ApoE_with Cys; ApoE AA sequence: LRKLRKRLL) provided an advantage in an uptake assay compared to the same design without cysteine (IDS.IGF2-central loop substituted-ApoE_No Cys). We refer to this design as Substitution of the central-loop With Augmenting Peptides (SWAP) (Fig. EV1C). It is characterized by an “SGGG” linker at the N-terminus of the insertion, an “SGGGGSG” linker at the C-terminus of the insertion, and a cysteine residue at both ends of the insertion (Fig. 1A,B).
We next tested SWAP variants with ApoE (9 AA) and RAP12x2 (25 AA) inserts. These inserts were chosen for their documented ability to undergo transcytosis across the blood-brain barrier via engagement of receptors such as LRP-1 (Catalano et al, 2023; Gleitz et al, 2018; Pflanzner et al, 2011). We fused these SWAP variants to IDS (IDS.SWAP-ApoE, IDS.SWAP-RAP12x2) and proceeded to test their functionality. First, we produced lentiviral vectors encoding IDS.SWAPs and controls, and transduced a human microglia cell line (HMC3). Then, we assessed the effect of SWAP tagging on IDS processing by performing SDS-PAGE analysis of the cell lysate and medium supernatant of transduced HMC3 cells 10 days post-transduction (Figs. 1C and EV1D; total protein load is shown in Fig. EV1E). In cells, untagged IDS was present as a precursor protein of apparent molecular weight of 76 KDa, while tagged version of IDS resulted in a precursor with a noticeably higher apparent molecular weight of ~84 KDa (IDS.IGF2 and IDS.SWAP versions) or ~80 KDa (IDS.IGF2del) (Fig. EV1D, top panel). All the examined proteins underwent processing into the mature forms (apparent molecular weight of 55 KDa and 45 KDa). Importantly, all tagged IDS variants exhibited a significant but modest skew toward the precursor isoform, with the degree of skew increasing from IDS.IGF2 < IDS.IGF2del <IDS.SWAP-ApoE <IDS.SWAP-RAP12x2 (Figs. 1C and EV1D, top panel), suggesting that the tagging strategy might partially interfere with the cleavage event occurring at the C-terminus of IDS between amino acids 455 and 456 (Millat et al, 1997; Froissart et al, 1995). In medium supernatant, we observed the precursor form of IDS at the same apparent molecular weight as the precursor form observed intracellularly (Fig. EV1D, lower panel). Intracellular and secreted protein levels documented in the SDS-PAGE analysis correlated with the IDS enzyme activity levels observed in the same samples (Fig. 1D). To assess secretion in more details, we transduced HMC3 cells at MOI 5 and 50, and we measured IDS activity in the medium supernatant after 24 h (Fig. EV1G). IDS activity per VCN was consistent across the conditions, with only a slight reduction for IDS.SWAP-ApoE at low MOI (Fig. EV1G). These findings demonstrate that the SWAP design does not interfere with intracellular or secreted IDS activity, although it might slightly affect intracellular processing. We next measured specific activity of IDS tagged with SWAP variants—carried out by quantifying the protein levels and enzyme activity levels in medium supernatant (only precursor protein) obtained from a 24 h culture of transduced HMC3 cells—which confirmed that SWAP tagging does not affect specific activity of IDS (Fig. 1E; Table EV1).
These results demonstrate that, while the central loop of IGF2 is essential for binding to the insulin receptor, it is not for binding to the CI-M6P/IGF2R and can be replaced by an insertion/deletion configuration to form an epitope tag that can be fused to IDS protein without affecting its function.
SWAP variants display a modified ligand–receptor interaction profile
To investigate binding of SWAP variants to the CI-M6P/IGF2R, we performed a competitive binding ELISA as described above, but now with immobilized domain 11–13 of the CI-M6P/IGF2R and a fixed concentration of biotinylated IGF2 in combination with varying concentrations of non-biotinylated ligands. Whereas IDS failed to compete with IGF2 for binding, IDS.IGF2 and IDS.IGF2del competed with similar efficacy with IC50 values ranging from 35 nM to 60 nM, although IGF2 peptide was the most efficient competitor (Fig. 2A; Table EV1), suggesting that binding of IGF2 to the CI-M6P/IGF2R is partially inhibited when tagged to IDS. IDS.IGF2del displayed a slightly lower affinity than IDS.IGF2, as previously shown (LeBowitz & Maga, 2012), with an IC50 of about 50 nM (Fig. 2A; Table EV1). IDS.SWAP variants exhibited similar or slightly higher binding affinities than IDS.IGF2, with IC50 values around 30 nM for IDS.SWAP-ApoE and IDS.SWAP-RAP12x2 (Fig. 2A; Table EV1). Importantly, binding of IGF2 to the CI-M6P/IGF2R differed when used as a peptide or when fused to IDS, with IDS.IGF2 showing a 7–10 times increased IC50 values compared to the untagged IGF2 peptide (~5 nM; Fig. 2A; Table EV1).Figure 2. Ligand-receptor binding profiles of IDS.SWAP proteins.(A–C) Competitive IGF2R ELISA using biotinylated IGF2 (A), IR-A ELISA using biotinylated insulin (B) and IGF1R ELISA using biotinylated IGF1 (C) with the indicated competing ligands at the indicated concentrations. (D) Direct LRP-1 ELISA with the indicated ligands at the indicated concentrations. IC50 (A–C) or Kd (D) affinity values are shown in Table EV1. (E–H) Uptake into MPS II fibroblasts (E), bEND.3 cells (F), HMC3 (G), or SH-SY5Y cells (H) over 24 h at the indicated input concentrations. Data information: data represent means ± SD. Regression analyses of (A–H) are shown in Table EV1. In (A–D), n = 2 technical replicates per condition; in (E–H) n = 3 biological replicates per condition. Source data are available online for this figure.
None of the tested IDS.SWAP variants, as well as untagged IDS and IDS.IGF2del, exhibited an appreciable binding to the IR-A in a binding assay as described above, as evidenced by the near-complete lack of competition against biotinylated insulin (Figs. 2B and EV2A; Table EV1). In contrast, IDS.IGF2 bound the IR-A with an IC50 of ~250 nM (Fig. 2B; Table EV1). Also in this case, we observed an impact of tagging on binding of IGF2 to the IR-A. Specifically, IDS.IGF2 bound the IR-A with an affinity that was ~65–93-fold lower than the affinity of untagged IGF2 peptide (Table EV1), suggesting a partial hindrance of IGF2 binding to IR-A when tagged to IDS. We also tested binding to the IR-A of IGF2.GAA, the same fusion protein used in the reveglucosidase alpha trial and that caused transient hypoglycemia events after bolus infusions (Byrne et al, 2017). IGF2.GAA was able to bind the IR-A with an affinity that was ~24–34-fold higher compared to IDS.IGF2, and only 2.69 lower than untagged IGF2 peptide (Fig. EV2B; Table EV1). This shows that the IGF2.GAA—fusion at the N-terminus of IGF2—but not IDS.IGF2—fusion at the C-terminus of IGF2—retains significant binding affinity to IR-A. Overall, these findings highlight the pivotal role of the central loop of IGF2 in binding to IR-A, a role that cannot be replaced by the epitopes inserted in the SWAP design (ApoE, RAP12x2). As a result, the SWAP modifications significantly disrupt IGF2’s ability to bind the IR-A.
To assess binding to the IGF1R, we performed a competitive ELISA assay using immobilized IGF1R and biotinylated IGF1 peptide (Fig. 2C; Table EV1). In this assay, untagged IDS and IDS.IGF2del exhibited no significant binding to the IGF1R compared to IDS.IGF2. In contrast, IDS.SWAP-ApoE bound to the IGF1R with an affinity similar to that of IDS.IGF2, while IDS.SWAP-RAP12x2 bound with an affinity that was ~3.5 times lower compared to IDS.IGF2. Also in this case, IDS.IGF2 showed an affinity for the IGF1R that was ~6 times lower compared to untagged IGF2 peptide. These findings demonstrate for the first time that deletion of amino acids 30–40 of IGF2 disrupts IGF1R binding, highlighting the critical role of the central loop in this interaction, but they also show that replacing amino acids 30–40 with epitopes can also result in retainment of IGF1R affinity (in the case of IDS.SWAP-ApoE). There are several scenarios that may explain why SWAP variants showed some affinity for the IGF1R, including either the presence of IGF1R binding motifs within the SWAP sequences, and/or a structural, sequence-independent requirement of a central loop structure in IGF2 and IGF2-derived tags for binding to the IGF1R, as further elaborated on in the “Discussion”.
The ApoE (Croy et al, 2004) and RAP12 (Ruan et al, 2018) peptides have been reported to bind to cluster IV of the LRP-1 receptor. To investigate whether these peptides are functional while inserted within SWAP, we performed a direct ELISA assay with immobilized LRP-1 (Figs. 2D and EV2C,D). IDS.IGF2 and IDS.IGF2del bound LRP-1 with low affinity, while untagged IDS showed no binding (Table EV1). In contrast, insertion of ApoE and RAP12x2 caused a strong increase in the affinity for the LRP-1, with apparent Kd of either 25.63 nM (IDS.SWAP-ApoE) or 38.08 nM (IDS.SWAP-RAP12x2) (Table EV1). In separate LRP-1 ELISAs assay, we compared these two SWAP variants to IDS.ApoEII (tandem repeat of the ApoE sequence “LRKLRKRLL”) and IDS.RAP12x2 (Fig. EV2C,D) (Catalano et al, 2023, 2024; Gleitz et al, 2018). All the IDS.SWAP variants showed apparent Kd values that were comparable to those of IDS.ApoEII (Fig. EV2C,D; Table EV1), while IDS.RAP12x2 showed no binding to LRP-1 (Fig. EV2D), as previously shown (Catalano et al, 2023). These findings demonstrate that, when incorporated into SWAP, ApoE binds to LRP-1 with an affinity comparable to that of its tandem-repeat variant (ApoEII). Importantly, these data also show that IDS.SWAP-RAP12x2, but not IDS.RAP12x2, can effectively engage LRP-1. This is elaborated upon in the “Discussion”.
Next, we assessed uptake of IDS.SWAP versions into MPS II fibroblasts after 24 h incubation in conditioned media generated by transduction of HMC3 cells (Fig. 2E). All the IDS-tagged versions exhibited EC50 at lower values compared to untagged IDS, which resulted in increased uptake across the range of concentrations tested. Specifically, IDS.IGF2 and IDS.IGF2del uptake resulted in EC50 at values that were 2.3 and 2.4 times lower than those of untagged IDS, respectively, while uptake of IDS.SWAP-ApoE and IDS.SWAP-RAP12x2 showed EC50 at values that were 1.2 and 1.5 times lower than untagged IDS (Table EV1). We also assessed uptake of IDS.SWAP variants into a murine brain endothelial cell line (bEND.3), a human microglia cell line (HMC3), and SH-SY5Y cells differentiated into neurons (Fig. 2F–H). In these cell lines, IDS-tagged versions exhibited increased cellular uptake across the range of concentrations tested. Specifically, EC50 values were 3.9, 1.4, 2.4, and 3.1 times lower than untagged IDS in bEND.3 cells for IDS.IGF2, IDS.SWAP-ApoE, IDS.SWAP-RAP12x2, and IDS.IGF2del, respectively (Fig. 2F). In HMC3, EC50 values were 3.0, 1.3, 2.0, and 2.5 times lower than untagged IDS for IDS.IGF2, IDS.SWAP-ApoE, IDS.SWAP-RAP12x2, and IDS.IGF2del, respectively (Fig. 2G). In SH-SY5Y, EC50 values were 1.9, 1.1, 1.6, and 2.6 times lower than untagged IDS for IDS.IGF2, IDS.SWAP-ApoE, IDS.SWAP-RAP12x2, and IDS.IGF2del, respectively (Fig. 2H). Overall, IDS-SWAP variants mediated enhanced uptake compared to untagged IDS across various cell types at levels that varied depending on the inserted epitope. IDS.SWAP-ApoE variant showed the lowest enhancement of uptake levels over 24 h, similar to what we previously observed for IDS.ApoEII (Catalano et al, 2023).
These data show that the SWAP design decreases IGF2’s binding affinity for IR-A and reduces binding to IGF1R depending on the inserted epitope, with only IDS.SWAP-RAP12x2 showing lower binding affinity for IGF1R. Importantly, the SWAP design maintained high-affinity binding to the CI-M6P/IGF2R and conferred binding to an additional receptor targeted by the inserted epitope, resulting in increased cellular uptake compared to untagged IDS across various cell lines.
Ex vivo lentiviral gene therapy with IDS.SWAP variants
Next, pCCL lentiviral vectors with transgene expression driven by the MND promoter (Catalano et al, 2023) were used to compare IDS.SWAP-ApoEco, IDS.SWAP-RAP12x2co and IDS.IGF2del_co with untagged IDSco and IDS.IGF2co during hematopoietic stem and progenitor cell (HSPC)-mediated lentiviral gene therapy (LVGT) for their efficacy in correction of pathology in a murine model for Hunter disease (Ids^y/−^) (Chen et al, 1999; Garcia et al, 2007). We transplanted CD45.1-Ids^y/−^ HSPCs transduced with lentiviral vectors expressing either the test transgenes or GFP as a control into 8–11 week-old CD45.2-Ids^y/−^ mice and analyzed pathology in disease-relevant tissues six months after transplantation (Fig. 3A). Flow cytometry analysis of chimerism in bone marrow revealed efficient engraftment of transplanted cells 6-months after transplantation, with chimerism values that were comparable across the conditions tested at values of ~80–95% (Fig. 3B). Similarly, VCN in bone marrow varied among the treatment groups and ranged from as low as 0.5 copies per genome to 5 copies per genome, with some groups showing slightly higher (IDS.IGF2co and IDS.SWAp-ApoEco) or slightly lower (IDS.IGF2del_co and GFP) average values (Fig. 3C). Gene therapy with all *IDS-*containing vectors resulted in supraphysiological levels of IDS activity in bone marrow, WBC and plasma at levels several times above Ids^y/−^ and WT animals (Figs. 3D–G, EV3A–C). IDS activity in bone marrow was comparable across the treatment groups at values ~50–200-fold above WT (Figs. 3D and EV3A; Table EV1). To correct expression values for VCN in BM, we plotted all data points of this and our previous study (Catalano et al, 2023) and found a hyperbolic relationship, with saturation of average expression levels around VCN 2 (Fig. EV3D). Saturation of protein expression upon lentiviral transduction has been reported previously (Zielske et al, 2004; Larson et al, 2017) and may depend on experimental conditions. Using a hyperbolic relationship, IDS activities per VCN in BM were similar for all constructs tested (Fig. EV3E). In WBC, IDS activity of IDSco-treated animals was higher compared to activity measured in WBC of IDS.IGF2co, IDS.IGF2del_co, IDS.SWAP-ApoEco, IDS.SWAP-RAP12x2co-treated animals (Figs. 3E and EV3B). A similar pattern was observed in plasma (Figs. 3F and EV3C), with all the IGF2-containing versions displaying a lower plasma IDS activity compared to untagged IDS (this is further elaborated upon in the discussion). By plotting IDS activity in plasma against VCN in bone marrow, we observed a linear increase of IDS activity per VCN, with slope and intercept values that confirmed a tendency toward lower plasma activity levels for the vectors encoding tagged IDS variants compared to the IDSco vector (Fig. 3G; Table EV1). Specifically, IDS.SWAP-ApoEco resulted in values comparable to those observed after IDS.IGF2co gene therapy, while higher values were recorded for IDS.IGF2del_co, and lower levels for IDS.SWAP-RAP12x2co (Fig. 3G; Table EV1). Slightly lower plasma protein levels after gene therapy with IDS.SWAP-RAP12x2co compared to IDS.IGF2co were confirmed by IDS ELISA (Fig. EV3F).Figure 3. Lentiviral gene therapy with IDS.SWAP variants results in supraphysiological transgene expression.(A) Cartoon of the experiment. 2-month-old Ids^y/−^ mice were treated with HSPC-LVGT and analyzed at 8 months of age as previously described (Catalano et al, 2023, 2024). (B) Flow cytometry analysis of chimerism in bone marrow. Values are expressed as percentage of CD45.1^+^/ CD45.2^−^ cells. (C) Analysis of VCN per genome in bone marrow by qPCR analysis on the PSI and Albumin loci. The adjusted P values were as follows: IDS.IGF2co vs. GFP P = 0.0048, IDS.SWAP-ApoEco vs. GFP P = 0.0002. (D–F) IDS enzyme activity in bone marrow (D), white blood cells (E, WBC), and plasma (F). In (D), all comparisons among the treatment groups showed P values > 0.9999, except for IDS.IGF2co vs. IDS.SWAP-RAP12x2co (P = 0.3553) and IDS.SWAP-ApoEco vs. IDS.SWAP-RAP12x2co (P = 0.0753). For (E, F), the adjusted P values were as follows: (E) IDSco vs. IDS.SWAP-ApoEco P = <0.0001, IDSco vs. IDS.SWAP-RAP12x2co P = <0.0001, IDSco vs. IDS.IGF2del_co P = 0.0317, IDS.IGF2del_co vs. IDS.SWAP-RAP12x2co P = 0.0492. (F) IDSco vs. IDS.SWAP-RAP12x2co P = <0.0001, IDSco vs. IDS.IGF2del_co P = 0.0030, IDSco vs. IDS.SWAP-ApoEco P = 0.0020, IDSco vs. IDS.IGF2co P = 0.0002, IDS.IGF2del_co vs. IDS.SWAP-RAP12x2co P = 0.0038, IDS.SWAP-ApoEco vs. IDS.SWAP-RAP12x2co P = 0.0058. (G) Relationship between VCN per genome in bone marrow and IDS enzyme activity in plasma. Regression analysis is shown in Table EV1. Data information: data represent means ± SD and were analyzed by one-way ANOVA followed by Bonferroni’s multiple testing correction. IDSco, GFP, Ids^y/−^ and WT n = 6; IDS.IGF2del_co, IDS.SWAP-ApoEco and IDS.SWAP-RAP12x2co n = 7. *P ≤ 0.05; **P ≤ 0.01; ***P ≤ 0.001; ****P ≤ 0.0001. Significant results are indicated by brackets. Source data are available online for this figure.
At harvest (8.5 months), Ids^y/−^ mice showed body weights that were ~8% lower compared to WT mice (Ids^y/−^: 37.98 g; WT: 41.22 g), as previously reported (Fig. EV3G) (Garcia et al, 2007). After gene therapy, GFP-treated mice showed an average body weight at even lower levels compared to Ids^y/−^ mice (GFP:34.27 g), which was likely caused by the preconditioning treatment. Gene therapy with the therapeutic vectors resulted in body weights of values raging from 36.78 g (IDS.SWAP-RAP12x2co) to 38.47 g (IDSco). The average body weight of animals treated with therapeutic vectors (37.6 g) was ~9% higher than that of GFP-treated animals, therefore showing a difference similar to that observed between Ids^y/−^ and WT mice (Fig. EV3G). Post-prandial glucose levels in plasma were lower for GFP-treated and untreated Ids^y/−^ animals compared to WT (Fig. EV3H). This could be caused by the lethargy that we observed in GFP-treated and untreated Ids^y/−^ mice compared to WT, which could result in reduced feeding behavior. Importantly, treatment with the therapeutic vectors restored the postprandial plasma glucose at levels comparable to WT animals (Fig. EV3H). As IDS.IGF2 was the only fusion protein that could bind IR-A, albeit with low affinity, we tested whether gene therapy with the IDS.IGF2co vector could impact glucose homeostasis by performing a glucose tolerance test (GTT) in mice 6-month post transplantation (aged 8 months). GTT was performed in starved mice (6 h) by intraperitoneal injection of glucose and monitoring of the resulting glycemic levels in blood before and after glucose injection (Fig. EV3I). Overall, during the GTT, glucose levels followed a similar curve across all conditions, with the GFP-treated group showing a faster return to basal levels compared to WT and IDS.IGF2-treated mice. At the 120 min time point, blood glucose levels returned to basal values for all groups tested. This indicates that HSPC-LVGT with IDS.IGF2co does not impact glucose tolerance under the conditions employed.
In conclusion, HSPC-LVGT with all the vectors tested resulted in supraphysiological expression in relevant hematological tissues, while plasma glucose levels were not affected.
Gene therapy with IDS.SWAP variants corrects Idsy/− peripheral pathology
GFP-treated and untreated Ids^y/−^ mice showed prominent pathology in liver and spleen characterized by increased alcian blue reactivity in sinusoidal structures (Fig. 4A). To assess correction of peripheral pathology using histology, three mice per treatment group were selected that had a similar VCN in BM to allow a fair comparison (Fig. EV4H). All tested gene therapy vectors resulted in complete correction of alcian blue-related pathology in liver (Fig. 4A,B), and caused complete or near-complete reduction of alcian blue-related pathology in spleen (Fig. 4A,B). Strong alcian blue staining was present in aortic valves and the tunica media of the aortic wall of Ids^y/−^ and GFP-treated mice (Fig. 4A,B), which was paralleled by increased levels of LAMP1 immunoreactivity in the same tissues (Fig. EV4A), as we previously reported (Catalano et al, 2024). Gene therapy with all the vectors tested caused a complete correction of alcian blue and LAMP1-related pathology in aortic valves (Figs. 4A,B and EV4A). Importantly, complete correction of pathology in aortic wall was achieved only after gene therapy with IDS.IGF2co and IDS.SWAP-ApoEco (Figs. 4A,B and EV4A). Among the other treatment groups, IDS.SWAP-RAP12x2co gene therapy caused a nearly complete correction, while significant residual pathology was observed after IDS.IGF2del_co and IDSco gene therapy (Figs. 4A,B and EV4A).Figure 4. Gene therapy with IDS.SWAP variants shows efficient correction of peripheral pathology.(A, B) Representative images of alcian blue staining of liver, spleen, aortic valves and aortic walls from gene therapy-treated mice and from controls. Arrowheads indicate alcian blue-positive cells. Scale bars = 100 µm. Scoring of alcian blue pathology is shown in (B). Scoring rules are shown in Table EV2. All significant comparisons in (B) showed P values < 0.0001, except for: Aortic Wall, IDSco vs. IDS.IGF2co P = 0.0016, IDSco vs. IDS.SWAP-ApoEco P = 0.0018, IDSco vs. IDS.SWAP-RAP12x2co P = 0.0243, IDSco vs. WT P = 0.0002, IDS.IGF2del_co vs. WT P = 0.0139, IDSco vs. Ids^y/−^ P = 0.0264, IDS.IGF2del_co vs. Ids^y/−^ P = 0.0004. (C) Representative 3D renderings of reconstructed μCT images of the left hindlimb ankles are shown. Green arrowheads indicate osteophytes in untreated Ids^y/−^ mice. Yellow arrowheads indicate bone surface features such as pores and irregular surface in untreated Ids^y/−^ mice. (D–K) μCT quantification of bone microarchitecture of talus (D–G) and navicular-lateral cuneiform (H–K) in gene therapy-treated animals. Explanatory drawings are shown in Fig. EV4G. In (E, F), the adjusted P values were as follows: (E) IDS.IGF2del_co vs. WT P = 0.0297, GFP vs. WT P = 0.0241, Ids^y/−^ vs. WT P = 0.0107. (F) Ids^y/−^ vs. WT P = 0.0337. Data information: data are presented as means ± SD. Data were analyzed by one-way ANOVA with Bonferroni’s correction. In (D–K), comparisons were performed against WT. Asterisks (*) represent significance versus WT; hashes (#) represent significance versus Ids^y/−^. Other significant comparisons are identified by brackets. In (A, B), n = 3; in (D–K) n = 6 for all groups except for GFP navicular-lateral cuneiform (n = 5) and GFP talus (n = 4). *P ≤ 0.05; **P ≤ 0.01; ***P ≤ 0.001; ****P ≤ 0.0001. ^#^P ≤ 0.05; ^###^P ≤ 0.001; ^####^P ≤ 0.0001. Source data are available online for this figure.
Ids^y/−^ mice displayed a partially penetrant phenotype of the ankle that was characterized by swelling of the joint and limited mobility. This phenotype was previously characterized by micro-computed tomography (μCT) analysis in the original study describing this Ids^y/−^ mouse model (Garcia et al, 2007). To analyse this in more detail, we performed μCT of the ankle bones of gene therapy-treated and control mice. μCT scans revealed the presence of abnormal bone surface features in Ids^y/−^ mice compared to WT mice (Fig. 4C; yellow arrowheads indicate surface pores; green arrowheads indicate osteophytes). We also conducted a bone microarchitecture analysis of talus, navicular-lateral cuneiform and medial cuneiform (Figs. 4D–K and EV4B–F; explanatory drawings for the μCT parameters tested are shown in Fig. EV4G). In talus of Ids^y/−^ animals, we observed a tendency toward a decreased trabecular bone volume (Tb.BV), with a 43% reduction compared to WT animals (Fig. 4D), while a significant 53% decrease of the trabecular tissue volume (Tb.TV) was observed in Ids^y/−^ mice compared to WT (Fig. 4E). In addition, talus of Ids^y/−^ mice showed a significant increase of the cortical bone area (Ct.Ar/Tt.Ar), with a 13% increase compared to WT animals (Fig. 4F), and a tendency toward a decreased trabecular bone surface (Tb.BS), with ~41% reduction compared to WT mice (Fig. 4G). The navicular-lateral cuneiform of Ids^y/−^ mice showed a tendency toward decreased Tb.TV (41% reduction compared to WT; Fig. 4I) and increased Ct.Ar/Tt.Ar (10% increase compared to WT; Fig. 4J), while no differences were observed in Tb.BV and Tb.BS (Fig. 4H,K). The medial cuneiform of Ids^y/−^ mice did not present noticeable differences for any of the parameters tested compared to WT animals (Fig. EV4B–E). Depending on the vector tested, gene therapy had a variable effect on bone microarchitecture of the talus and the navicular-lateral cuneiform. Mock treatment with GFP vector had no impact on the bone microarchitecture parameters measured, and resulted in values comparable to those observed in untreated Ids^y/−^ mice for all the bones examined (Figs. 4D–K and EV4B–E). IDSco gene therapy resulted in partial correction of Tb.TV and the Ct.Ar/Tt.Ar of the talus (Fig. 4E,F) and a more substantial correction of the same parameters in the navicular-lateral cuneiform (Fig. 4I,J), but had no effect on the Tb.BV and the Tb.BS of the talus (Fig. 4D,G). On the other hand, IDS.IGF2del_co gene therapy resulted in no correction for all the parameters analyzed in both talus and navicular-lateral cuneiform (Fig. 4D–K). Importantly, IDS.IGF2co and IDS.SWAP-RAP12x2co showed a general improvement of all the parameters tested compared to both IDSco and IDS.IGF2del_co. Specifically, when compared to IDSco, the correction provided by the IDS.IGF2co and IDS.SWAP-RAP12x2co vectors was more pronounced for the Tb.BV, the Tb.TV and the Tb.BS of the talus (Fig. 4D–G). In contrast, IDS. IDS.SWAP-ApoEco treatment was comparable to IDSco for most of the parameters, but not for the Ct.Ar/Tt.Ar of the talus, for which it resulted in an improved correction (Fig. 4D–J).
These results demonstrate that gene therapy with SWAP vectors effectively prevented alcian blue and LAMP1-related pathology in liver, spleen and cardiac muscle, and nearly fully restored those bone microarchitecture parameters that were significantly different between Ids^y/−^ and wild-type mice, although these improvements did not reach statistical significance. This highlights the potential of SWAP vectors for addressing both peripheral and skeletal pathologies in lysosomal storage disorders.
Superior correction of brain pathology by gene therapy with IDS.SWAP variants
Gene therapy with all vectors tested resulted in comparable IDS activity in brain homogenates at levels that were ~10–20 times higher compared to untreated Ids^y/−^ animals, and ~10–30 times lower compared to untreated WT mice (Fig. 5A), as previously reported (Catalano et al, 2023; Gleitz et al, 2018). Using mass spectrometry, we observed a significant increase of the heparan sulfate levels in brain homogenates of Ids^y/−^ mice compared to WT mice (~70-fold above WT; Fig. 5B,C), but not a significant increase of the dermatan sulfate levels (Fig. EV4I), as shown previously (Catalano et al, 2023). Gene therapy with all vectors tested caused a significant reduction of the heparan sulfate at levels depending on the vector tested (Fig. 5B,C). We plotted all data points of this and our previous study (Catalano et al, 2023) and found that heparan sulfate decreased exponentially per VCN in bone marrow (Fig. 5B; Table EV1). Gene therapy with the mock GFP vector had no effect on the heparan sulfate, resulting in levels that were comparable to untreated Ids^y/−^ mice. IDSco gene therapy reduced heparan sulfate at levels that were three times lower than Ids^y/−^ mice, but that remained 23 times higher than WT mice. Tagging of IDS with IGF2 versions caused a further reduction of heparan sulfate at levels that were two- to threefold lower than those observed after gene therapy with untagged IDS (Fig. 5C; IDS.IGF2co and IDS.SWAP-ApoEco ~ three times lower than IDSco, 10 times lower than untreated Ids^y/−^ mice, and 7.5 times higher than WT mice; IDS.SWAP-RAP12x2co and IDS.IGF2del_co ~ 2.1 times lower than IDSco, 7 times lower than Ids^y/−^ mice, and 11 times higher than WT mice).Figure 5. Correction of brain heparan sulfate and lysosomal pathology by gene therapy with IDS.SWAP variants.(A) IDS enzyme activity in brain. All significant comparisons in (A) showed P values < 0.0001, except for IDSco vs. Ids^y/−^ P = 0.0031, IDS.SWAP-ApoEco vs. Ids^y/−^ P = 0.0442, IDS.SWAP-RAP12x2 vs. Ids^y/−^ P = 0.0042. (B) Relationship between heparan sulfate in brain after gene therapy and VCN in bone marrow. Regression analysis of (B) is shown in Table EV1. (C) Heparan sulfate quantification in total brain homogenates by mass spectrometry. All significant comparisons in (C) showed P values < 0.0001, except for IDS.IGF2co vs. WT P = 0.0113, IDS.SWAP-ApoEco vs. WT P = 0.0353. (D) Analysis of Chimerism and VCN per genome in brain by qPCR analysis on the PSI and Albumin loci (VCN) and by allele specific qPCR on the Cd45.1 locus (Chimerism). (E) LAMP1 (green) staining of sagittal sections of cortex, hippocampus, thalamus, choroid plexus, cerebellum and brainstem. Scale bars = 100 µm. Nuclei are stained in red. Dashed lines outline the Cornu Ammonis (CA) fields 2 and 3. Quantification of the area of LAMP1 fluorescence is shown. VCN in bone marrow of the mice used for histology is shown in Fig. EV4J. An example of LAMP1 staining on GFP-treated Ids^y/−^ mice is shown in Fig. EV5. All significant comparisons in (E) showed P values < 0.0001, except for: Cortex, IDSco vs. WT P = 0.0174. Hippocampus, IDSco vs. Ids^y/−^ P = 0.0001. Thalamus, IDSco vs. WT P = 0.0002, IDS.IGF2del_co vs. WT P = 0.0058, IDS.IGF2co vs. Ids^y/−^ P = 0.0002, IDSco vs. IDS.SWAP-ApoEco P = 0.0104. Cerebellum, IDSco vs. WT P = 0.0139*, IDSco* vs. Ids^y/−^ P = 0.0007, IDSco vs. IDS.IGF2co P = 0.0475. Data information: data are presented as means ± SD and were analyzed by one-way ANOVA with Bonferroni’s correction. Asterisks (*) represent significance versus WT; hashes (#) represent significance versus Ids^y/−^; carets (^) represent significance versus IDSco. In (A–D): IDSco, GFP, Ids^y/−^ and WT n = 6; IDS.IGF2del_co, IDS.SWAP-ApoEco and IDS.SWAP-RAP12x2co n = 7. In (E), n = 3. *P ≤ 0.05; **P ≤ 0.01; ****P ≤ 0.0001. ^###^P ≤ 0.001; ^####^P ≤ 0.0001. Significant results are indicated by brackets. Source data are available online for this figure.
As HSPC-LVGT is expected to result in engraftment of donor HSPC-derived cells in brain, we investigated the levels of engraftment in brain via measuring the levels of VCN and total chimerism (Fig. 5D) in brain homogenates. Following gene therapy, we observed comparable levels of brain VCN across all the tested vectors, which were ~0.025 copies per genome (Fig. 5D). Treatment with the GFP vector resulted in values that were approximately 5 times lower compared to the other groups (Fig. 5D) and that were consistent with the difference in bone marrow VCN between this treatment group and the others (Fig. 3D). This has likely a technical reason due to the virus titration process. Importantly, we note that a lower VCN would not compromise this experimental group’s role as a control for the preconditioning procedure. Analysis of chimerism in brain demonstrated similar levels across the vectors tested of ~1% (Fig. 5D), ruling out that the transduction with lentiviral vectors affected engraftment of HSPC-derived cells in the brain.
To assess correction of brain pathology using histology, three mice per treatment group were selected that had a similar VCN in BM to allow a fair comparison (Fig. EV4J,K). To analyse correction of brain lysosomal pathology by gene therapy, we performed immunostaining of LAMP1 protein on brain sagittal sections. As previously reported (Catalano et al, 2023), we observed a widespread increased of LAMP1 immunoreactivity in brain sections of Ids^y/−^ mice compared to WT mice (Fig. 5E), which was not affected by GFP-treatment (Fig. EV5). Gene therapy with all the tested vectors resulted in reduced LAMP1 fluorescence, with levels that varied among the different vectors, with IDS.IGF2co and IDS.SWAP variants showing the most significant reduction (Fig. 5E). Specifically, gene therapy with IDSco caused a ~2–2.5-fold reduction of LAMP1 levels in cortex, hippocampus and cerebellum, and a milder reduction of LAMP1 levels in thalamus and brainstem (~1.4-fold). IDS.IGF2co led to further reductions in all regions (~8 fold in the cortex, ~21-fold in the hippocampus, ~3-fold in the thalamus, ~7-fold in the cerebellum, and ~4 fold in the brainstem), with levels comparable to those observed with IDS.SWAP-ApoEco and IDS.SWAP-RAP12x2co gene therapies, although these vectors demonstrated even greater correction in some areas. Specifically, LAMP1 immunoreactivity in hippocampus and thalamus was 1.76 times lower after IDS.SWAP-ApoEco treatment compared to IDS.IGF2co treatment, while no differences were observed in cortex, brainstem and cerebellum. A similar pattern was observed comparing IDS.SWAP-RAP12x2 and IDS.IGF2co treatments, with exceptions in thalamus—where LAMP1 immunoreactivity levels were comparable—and in cerebellum—where LAMP1 levels were 2.7 times higher after IDS.SWAP-RAP12x2 compared to IDS.IGF2co. Gene therapy with IDS.IGF2del_co caused a reduction of brain LAMP1 immunoreactivity at levels that ranged from comparable to slightly lower than those observed after IDSco treatment (cortex and hippocampus: ~1.5 times reduction compared to IDSco treatment; cerebellum: 1.73 times reduction compared to IDSco treatment), and ~2–5 times higher than the other vectors (cortex, hippocampus and brainstem: ~2 times increase compared to IDS.IGF2co treatment; thalamus: ~1.7 times increase compared to IDS.IGF2co treatment; hippocampus: 5 times increase compared to IDS.IGF2co treatment).
We also analyzed correction of neuroinflammation by performing immunostaining for CD68, a marker of activated microglia when used in brain (Figs. 6 and EV5), and GFAP, a marker for astrocytes (Figs. 7 and EV5) (Catalano et al, 2023). Ids^y/−^ mice presented a widespread increased of the number of CD68-positive cells compared to WT animals (Fig. 6), which was not affected by the GFP-treatment (Fig. EV5). Gene therapy with all tested vectors resulted in a reduction of CD68 levels, with variations among the different vectors, and the lowest levels observed following therapy with IDS.IGF2co and IDS.SWAP vectors. Specifically, IDSco and IDS.IGF2del_co caused a reduction of CD68-positive cells in all areas analyzed and at levels that were on average ~3.5-fold lower than those observed in Ids^y/−^ mice, with a more prominent reduction observed in hippocampus, cerebellum and brainstem (~4.5-fold reduction compared to Ids^y/−^ mice). IDS.IGF2co gene therapy further reduced the CD68 pathology to levels that were on average 2-fold lower than IDSco and 7-fold lower than Ids^y/−^ mice. Gene therapy with IDS.SWAP vectors resulted in a reduced number of CD68-positive cells in midbrain and cerebellum at levels that were comparable to those observed after IDS.IGF2co gene therapy, while resulting in a 5.6 times (IDS.SWAP-ApoEco) or 2.3 times (IDS.SWAP-RAP12x2co) further reduction in cortex, and 2 times (IDS.SWAP-ApoEco) or 5 times (IDS.SWAP-RAP12x2co) further reduction in hippocampus compared to IDS.IGF2co gene therapy. However, IDS.SWAP-ApoEco gene therapy was less effective in thalamus, where levels of CD68-positive cells were comparable to IDSco and IDS.IGF2del_co treatments and ~1.5 times higher than IDS.IGF2co and IDS.SWAP-RAP12x2co treatment.Figure 6. Correction of CD68 pathology by gene therapy with IDS.SWAP variants.Representative images of CD68 staining of sagittal sections of cortex, hippocampus, thalamus, midbrain, brainstem and cerebellum of gene therapy-treated Ids^y/−^ mice and controls. Scale bars = 100 µm. Quantification of CD68-positive cells is shown. VCN in bone marrow of the mice used for histology is shown in Fig. EV4K. An example of CD68 staining on GFP-treated Ids^y/−^ mice is shown in Fig. EV5. All significant comparisons in showed P values < 0.0001, except for: Cortex, IDSco vs. Ids^y/−^ P = 0.0210, IDS.IGF2co vs. Ids^y/−^ P = 0.0003, IDS.IGF2del_co vs. Ids^y/−^ P = 0.0201. Thalamus, IDSco vs. WT P = 0.0047, IDS.IGF2del_co vs. WT P = 0.0123, IDS.SWAP-ApoEco vs. WT p = 0.0038. Midbrain, IDS.IGF2co vs. Ids^y/−^ P = 0.0093, IDS.SWAP-ApoEco vs. Ids^y/−^ P = 0.0141, IDS.SWAP-RAP12x2co vs. Ids^y/−^ P = 0.0081. Cerebellum, IDSco vs. Ids^y/−^ P = 0.0016, IDS.IGF2co vs. Ids^y/−^ P = 0.0003, IDS.IGF2del_co vs. Ids^y/−^ P = 0.0010, IDS.SWAP-ApoEco vs. Ids^y/−^ P = 0.0031. Data information: data are presented as means ± SD and were analyzed by one-way ANOVA with Bonferroni’s correction. Asterisks (*) represent significance versus WT; hashes (#) represent significance versus Ids^y/−^. n = 3. *P ≤ 0.05; **P ≤ 0.01; ***P ≤ 0.0001. ^#^P ≤ 0.05; ^##^P ≤ 0.01; ^####^P ≤ 0.0001. Significant results are indicated by brackets. Source data are available online for this figure.Figure 7. Efficient correction of GFAP pathology by gene therapy with IDS.SWAP variants.Representative images of GFAP (green) staining of sagittal sections of cortex, hippocampus, thalamus, midbrain and brainstem of gene therapy-treated Ids^y/−^ mice and controls. Scale bar = 100 µm. Nuclei are stained in red. Dashed lines outline the Cornu Ammonis (CA) fields 2 and 3. Quantification of GFAP fluorescence area is shown. VCN in bone marrow of the mice used for histology is shown in Fig. EV4J. An example of CD68 staining on GFP-treated Ids^y/−^ mice is shown in Fig. EV5. All significant comparisons in showed P values < 0.0001, except for: Cortex, IDSco vs. WT = 0.0239, IDS.IGF2del_co vs. WT P = 0.0434, IDSco vs. Ids^y/−^ = 0.0023, IDS.IGF2del_co vs. Ids^y/−^ P = 0.0012. Hippocampus, IDSco vs. WT P = 0.0140, Ids^y/−^ vs. WT P = 0.0010, IDS.SWAP-ApoEco vs. Ids^y/−^ P = 0.0007, IDSco vs. IDS.SWAP-ApoEco P = 0.0106. Brainstem, IDSco vs. WT P = 0.0002, Ids^y/−^ vs. WT P = 0.0087, IDSco vs. IDS.IGF2co P = 0.0033, IDSco vs. IDS.SWAP-ApoEco P = 0.0037, IDSco vs. IDS.SWAP-RAP12x2co P = 0.0110. Data information: data are presented as means ± SD and were analyzed by one-way ANOVA with Bonferroni’s correction. Asterisks () represent significance versus WT; hashes (#) represent significance versus Ids^y/−^. n = 3. *P ≤ 0.05; **P ≤ 0.01; ***P ≤ 0.001; ****P ≤ 0.0001. ^#^P ≤ 0.05; ^##^P ≤ 0.01; ^###^P ≤ 0.001; ^####^P ≤ 0.0001. Significant results are indicated by brackets. Source data are available online for this figure.
Similarly, immunostaining of GFAP showed a regional increase of GFAP immunoreactivity in brain sections of Ids^y/−^ mice (Fig. 7), which was not affected by GFP-treatment (Fig. EV5). Following gene therapy, GFAP fluorescence decreased with varying levels across treatments. The greatest reductions were observed with IDS.IGF2co and IDS.SWAP vectors. IDSco caused a ~2-fold reduction of GFAP fluorescence levels in cortex, but had no effect in thalamus, midbrain and brainstem. IDS.IGF2co and IDS.SWAP vectors gene therapy further reduced GFAP immunoreactivity in cortex, thalamus, midbrain and brainstem at levels that were ~4.4, ~3.6, ~2.6, ~3.9 times lower than those observed in Ids^y/−^ mice, respectively. IDS.IGF2del_co treatment caused a reduction of GFAP fluorescence in thalamus, midbrain and brainstem—but not in cortex—at levels that were ~2.5-fold lower than IDSco treatment, but that were ~2-fold higher than after IDS.IGF2co treatment.
These findings indicate that IDS.SWAP variants and IDS.IGF2 achieved similar efficacy in the brain, showed a trend towards superior efficacy on histopathology markers compared to IDS.IGF2del in some brain areas and showed clearly enhanced efficacy compared to IDSco, as evidenced by greater reductions in cerebral heparan sulfate, alleviation of astrogliosis, and enhanced LAMP1 clearance.
Discussion
In this study, we found that the central loop of IGF2 is not required for binding to CI-M6P/IGF2R but is essential for high-affinity binding to IR-A and IGF1R. This insight led to the development of the SWAP design, a structurally cohesive IGF2-based tag with a more favourable receptor interaction profile than the original IGF2 tag. We showed that the SWAP design retains binding to the CI-M6P/IGF2R, reduces binding to the IR-A (SWAP-ApoE and SWAP-RAP12x2) and IGF1R (only SWAP-RAP12x2), and includes the option for binding additional receptors (or protein) such as LRP-1. This offers a promising novel tagging platform to enhance gene therapy treatment of lysosomal storage disorders such as Hunter syndrome.
Upon deletion of the central loop of IGF2 (IGF2del) or its substitution with other epitopes (SWAP-ApoE or SWAP-RAP12x2), we observed a complete loss of binding affinity to the IR-A. On the other hand, binding to the IGF1R was reduced either upon deletion of the central loop or its substitution with RAP12x2, but not upon substitution with ApoE. For the IR-A, these findings align with structural and mutagenesis studies demonstrating that the central loop residues R37 and R38 are essential for high-affinity binding (An et al, 2024). Therefore, this loss of key interactions likely explains the reduced affinity of IGF2del to the IR-A, and indicates that the inserted epitopes (ApoE and RAP12x2) could not replicate these interactions. Similarly, for IGF1R, structural studies have suggested possible interactions between residues R30 and R38 of IGF2’s central loop and IGF1R (Xu et al, 2020). As for the IR-A, this suggests that the loss of these interactions between the IGF2’s central loop and IGF1R is responsible for the lack of IGF1R binding of IGF2del. However, SWAP-ApoE, but not SWAP-RAP12x2, retained IGF1R binding at levels similar to unmodified IGF2, suggesting that the ApoE, but not RAP12x2, could replicate these interactions. One possible explanation for this finding is the presence of the “RKL” and “KRL” motifs in ApoE, which mimic the “RRA” motif found in IGF1 (R36, R37 and A38), and known to be critical for IGF1 binding to the IGF1R (Blyth et al, 2020; Xu et al, 2020). This motif is absent in SWAP-RAP12x2, possibly explaining the lower binding affinity of SWAP-RAP12x2 for IGF1R compared to SWAP-ApoE. Alternatively, a structural, sequence-independent requirement for a flexible central loop in IGF2 and SWAP-derived tags may explain our findings regarding their binding to the IR-A and IGF1R. For example, An et al, 2024 showed that IGF2’s central loop undergoes structural rearrangements to accommodate the IR-A’s α-CT domain during binding. This could suggest that a loss of structural flexibility—due to the lack of a flexible central loop in the IGF2del, or the presence of a disulfide bond at the ends of the insertion in the SWAP design (predicted for the SWAP variants in Fig. 1A) —may be involved in the reduced affinity to the IR. Similarly, studies have proposed structural rearrangements of IGF2 during binding to the IGF1R. Examples are the folding out of IGF2’s B-chain, or the opening of the central loop for accommodation of the αCT domain of IGF1R (Xu et al, 2020). Therefore, beside engaging the receptor via polar interactions, the central loop of IGF2 could play a critical role in facilitating the structural rearrangements needed for receptor engagement. In this context, the RAP12x2 insert—larger than ApoE insert (25 AA vs. 9 AA)—in the SWAP design, but not the ApoE insert, could increase the enthalpic cost required for the necessary structural rearrangements, thereby reducing binding affinity to the IGF1R.
Besides mediating a reduced binding affinity for the IR-A and IGF1R, the SWAP design proved to be an effective modular platform for targeting multiple relevant receptors by switching inserted epitopes of different lengths. Specifically, we tested ApoE (9 AA) and RAP12x2 (25 AA) epitopes. These variants demonstrated simultaneous engagement of the CI-M6P/IGF2R and LRP-1 with high-affinity that was similar to single tagged IDS versions (IDS.IGF2 and IDS.ApoEII), without introducing the complexity or structural interference typically associated with double-tagging methods, or sometimes observed with simple N- or C-terminal fusion strategies. For example, we previously showed that C-terminal tagging of IDS with RAP12x2 failed to engage the LRP-1. As a result, IDS.RAP12x2 failed to provide a therapeutic advantage over untagged IDS in vivo (Catalano et al, 2023). In contrast, SWAP variants with either an ApoE or RAP12x2 inserts outperformed untagged IDS in correcting or preventing most peripheral and CNS manifestations in a murine Hunter syndrome model. Additionally, the IDS.SWAP variants more effectively normalized cardiac Alcian blue staining and LAMP1 pathology, matching the efficacy of IDS.IGF2, and showed a trend toward superior correction of histopathology compared with IDS.IGF2del. This might indicate that the C-domain of IGF2—deleted in IGF2del and involved in the binding to the insulin receptor and IGF1R (LeBowitz & Maga, 2012; Blyth et al, 2020)—partially exerts the IGF2-mediated enhancement of therapeutic efficacy during HSPC-LVGT, and that his role can be replaced by the epitopes inserted in the SWAP design.
In addition to testing IDS.RAP12x2, we also previously tested the IDS.ApoEII construct (Catalano et al, 2023). IDS.ApoEII comprises a tandem repeat of an ApoE-derived peptide (sequence LRKLRKRLL x 2), while IDS.SWAP-ApoE comprises a single repeat of the same sequence. While it was previously observed that the isolated single‐repeat peptide has a reduced biological activity compared to the tandem‐repeat ApoEII, this was mainly attributed to the failure of the short isolated single repeat to stably adopt the α-helical conformation characteristic of native Apolipoprotein E (Dobson et al, 2006; Minami et al, 2010). However, when embedded within a larger amino-acid context, such as in the native Apolipoprotein E sequence, a single LRKLRKRLL repeat can adopt an α-helical structure and binds LRP-1 with high affinity (Croy et al, 2004), a mechanism that may also operate in the SWAP design. Consistently, in Fig. EV2C we show that IDS.ApoEII and IDS.SWAP-ApoE bind Cluster IV of LRP-1 with very similar affinities, with the latter exhibiting only a slight decrease. In vivo, IDS.SWAP-ApoE largely mirrored IDS.IGF2 for the prevention of brain pathology, and showed a non-significant trend toward better cortex rescue. Both IDS.SWAP-ApoE and IDS-IGF2 showed near-complete rescue of disease hallmarks in brain, while IDS.ApoEII in previous studies showed complete rescue (Catalano et al, 2023; Gleitz et al, 2018). We noticed different pharmacokinetic properties of IGF2-based IDS including SWAP versions, which might be caused by scavenging to various tissues via the IGF2R and/or by binding plasma proteins, which should be assessed in future studies. We speculate that the lower plasma concentration of IGF2-based tags might limit the availability of transgene products to reach the brain via transcytosis, which should be addressed in future experiments (Catalano et al, 2023; Gleitz et al, 2018).
ERT with an IGF2-tagged GAA analog caused dose-dependent hypoglycemia shortly after drug administration in patients with Pompe disease. This was deemed to be caused by the pharmacological effect of the IGF2 moiety (Byrne et al, 2017). In this study, patients with hypoglycemic reactions showed a maximum plasma concentration (Cmax, observed shortly after administration) of ~50000–100,000 ng/ml, corresponding to ~450–900 nM of IGF2 moieties (IGF2.GAA: ~110 KDa). In our studies, gene therapy with IDS.IGF2co resulted in plasma levels of ~200 ng/ml (Fig. EV3F), corresponding to ~2.5 nM of IGF2 moieties (IDS.IGF2: ~80 KD), which is ~175 to 350-fold lower compared to the Cmax IGF2 moieties values observed after bolus administration of IGF2.GAA. This suggests that, during gene therapy, the level of expression of IGF2 moieties may be several fold lower compared to the previously observed concentration range associated with hypoglycemia. Despite this, IGF2-related toxicity could still manifest in gene therapy settings due to the constant and long-term exposure to supraphysiological levels of IGF2 moieties, compared to single administration during bolus ERT. In this respect, E20 mouse embryos systemically overexpressing IGF2 at levels 65% above control showed increased body weight and pancreatic islet cells hyperplasia (Petrik et al, 1999). Additionally, 5–10-weeks old mice overexpressing IGF2 systemically showed increased body weight and impaired glycolipid metabolism (Zhang et al, 2023). Here, after gene therapy, we did not observe specific effects of IGF2-tagging on body weight, nor an effect on post-prandial glucose levels or on glucose tolerance. This suggests that the levels of expression of IGF2 moieties of IDS.IGF2 do not interfere with glucose metabolism during lentiviral gene therapy. Another scenario in which IGF2 overexpression could lead to adverse effects is a high level of local expression in proximity of insulin-sensitive cells. In the context of gene therapy, such an effect might be caused by transgene-expressing macrophages engrafting in proximity of, for example, pancreatic islets. In this context, Devedjian and colleagues showed that, when IGF2 overexpression is restricted to β-cells, mice developed hyperinsulinemia, hyperglycemia and impaired response to glucose tolerance tests, even though serum levels of IGF2 were only ~twofold higher than WT animals and comparable to the levels observed by us after IDS.IGF2co gene therapy (Devedjian et al, 2000). Additionally, species differences in glucose regulation between mice and humans might still pose a risk for using IGF2-based therapeutics for gene therapy in humans, especially in a single dosing gene therapy setting resulting in long-term expression (Bruce et al, 2021). In all these scenarios, using IGF2-derived tags with abolished or lowered binding to IR or IGF1R is favourable over unmodified IGF2 tag given similar therapeutic efficacy. For this reason, the SWAP design, and SWAP-RAP12x2 in particular, represents a favourable transgene candidate for lentiviral gene therapy for Hunter syndrome, as well as for approaches involving IGF2-based therapeutics where peak plasma levels strongly exceed those achieved by HSPC‐LVGT (e.g., ERT).
In conclusion, this study extends our understanding of the role of the central loop of IGF2 in receptor binding and specificity, and builds on this to develop a modified version of IGF2 for enhancing efficacy of lentiviral gene therapies. This SWAP design enables modular targeting of therapeutically relevant receptors to achieve a more favourable receptor-targeting profile with reduced binding to IR-A and IGF1R and novel receptor binding properties, relevant for the clinical translation of lentiviral gene therapies for lysosomal disorders such as Hunter syndrome.
Methods
Reagents and tools tableReagent/resourceReference or sourceIdentifier or catalog number Experimental models B6.SJL-Ptprca Pepcb/BoyJ miceJackson Laboratory2014B6N.Cg-Idstm1Muen/J miceJackson Laboratory24744bEND.3 cellsATCCCRL-2299C57BL/6J miceJackson Laboratory664HMC3 cellsATCCCRL-3304MPS II fibroblastsPrimary, male, mut: p.Leu182Cysfs*31N/ASH-SY5Y cellsATCCCRL-2266 Recombinant DNA LV.IDScoCatalano et al, 2023N/ALV.IDS.IGF2coCatalano et al, 2023N/A Antibodies Anti-Rabbit Alexa Fluor® 488 secondary antibodyThermoFisher ScientificA-11008Anti-Rat Alexa Fluor® 488 secondary antibodyThermoFisher ScientificA-11006Biotinylated goat anti-rat secondary antibodyBD Pharmingen554014FITC-anti-mouse CD45.2BD Biosciences553772Goat anti-human IDS primary antibody (dilution 1:1000)R&D SystemsF2449IRDye 680RD secondary antibody (1:10,000)LI-COR Biosciences925-68071Mouse anti-His tag antibodyR&D SystemsMAB050Mouse IgG2a-FITC isotype controlBD Biosciences349051Mouse IgG2a-PE isotype controlBD Biosciences349053PE-anti-mouse CD45.1BD Biosciences553776Rabbit anti-GFAP IgGSigma-AldrichG9269Rat anti-CD68 primary antibodyBio-RadMCA1957TRat anti-LAMP1 primary antibodyAbcamab25245 Oligonucleotides and other sequence-based reagents Cd45.1 allele FW primer (5'-CTGAGCCTGCATCTAAACCTGATC-3')IDTN/ACd45.1 allele RV primer (5'-TCACCTTCATAAAAGCCTTGTAGCTC-3')IDTN/Amouse Albumin FW primer (5'-ACTTTGAGTGTAGCAGAGAGGAACC-3')IDTN/Amouse Albumin RV primer (5'-CTCTTCACTGACCTAAGCTACTCCC-3')IDTN/APSI FW primer (5'-CAGGACTCGGCTTGCTGAAG-3')IDTN/APSI RV primer (5'-TCCCCCGCTTAATACTGACG-3')IDTN/A Chemicals, enzymes and other reagents 3 M HCl-methanolMerck909644-Methylumbelliferyl-α-L-idopyranosiduronic acid-2-sulphate (4-MU)Biosynth/CarbosynthM-5430Alcian Blue 8GXSigma33864-99-2Aluminum sulfate hexadecahydrateSigma16828-11-8Avidin/biotin blocking kitVector LaboratoriesSP-2001B27 supplement (2%)Gibco17504044Biotinylated IGF1 peptideCellSciencesAQU050Biotinylated IGF2 peptideCellSciencesAXU020Biotinylated insulinCellSciencesAYU100Bovine serum albuminSigmaA3059Citrate Buffer (4%)Sigma6132-04-3DMEM/F-12Gibco11320033Elaprase™ (idursulfase)Takeda PharmaceuticalsN/AELISA substrate solutionR&D SystemsDY999Entellan mounting mediumSigma1079600500Equimolar dNTP mix, 25 mMThermoFisherR0181Fetal bovine serum (10%)Capricorn ScientificFBS-12AGlutaMAX (1%)Gibco35050-061Goat serumThermo Fisher Scientific50197ZHoechst 33258Life TechnologiesN/AHuman α-L-iduronidase (5 μg/mL)R&D Systems4119-GH-010Hydrogen peroxidasePHC CorporationBMS-2110-1EImpact DAB™Vector LaboratoriesSK-4105iTaq Universal SYBR Green SupermixBio-Rad172-5120Mature human IGF2 peptide des1-6CellSciencesMU100Neurobasal mediumGibco21103049Non-essential amino acids (NEAA)Gibco11140050Nuclear Fast RedSigma6409-77-4Penicillin/Streptomycin (1%)Gibco15070-063Phusion polymeraseNEBM0530LRecombinant murine Flt-3 ligandR&D Systems427-FL-005/CFRecombinant murine stem cell factorR&D Systems455-MC-010/CFRecombinant murine thrombopoietinR&D Systems488-TO-005/CFRetinoic acid (10 μM)SigmaR2625StemSpan™ SF Expansion MediumStemcell Technologies9600Streptavidin-HRPR&D SystemsDY998T5 ExonucleaseNEBM0663LTriton X-100Thermo Fisher ScientificT8787 Software AccuCT software (ASBMR module)PerkinElmerN/AAlphaFold3Abramson et al, 2024N/ACFX Manager 3.0Bio-RadN/AFACS-DIVA softwareBD BiosciencesN/AFiji 2.17ImageJN/AFlowJo v10BD BiosciencesN/AGraphPad Prism 9.0.0GraphPad SoftwareN/AImage Studio 6.0LI-COR BiosciencesN/AQuantum GX2 softwarePerkinElmerN/A Other Amicon protein concentrators (30 kDa cutoff)Thermo Scientific88536BD LSRFortessa™ flow cytometerBD BiosciencesN/ACFX96 real-time PCR detection systemBio-RadN/ACu 0.06 mm + Al 0.5 mm filterPerkinElmerN/ADuoSet® ELISA kit - IDSR&D SystemsDY449-05Gammacell® 40 irradiatorAtomic Energy of Canada LTDN/AGlucometerSwisspointofcareOGM-191Glucose solution (45% w/v)SigmaG8769HistokinetteN/AN/ALeica Stellaris5 confocal microscopeLeicaN/ALineage Cell Depletion Kit – mouseMiltenyi Biotec130-110-470NanoZoomer 2.0 slide scannerHamamatsu PhotonicsN/AOdyssey Infrared Imaging SystemLI-COR BiosciencesCLxPierce™ BCA Protein Assay KitThermo Fisher Scientific23225Quantum GX μCT imaging systemPerkinElmerN/ASciex 5500 QTrap mass spectrometerSciexN/ATrans-Blot Turbo Mini 0.2 µm Nitrocellulose TransferBio-Rad1704158Varioskan microplate readerThermo Fisher ScientificFlashWaters Acquity UPLC systemWatersN/A
Animals and procedures
The animal experiments were conducted as previously shown (Catalano et al, 2023). Ids^y/−^ and WT mice were generated breeding heterozygous female B6N.Cg-Ids^tm1Muen^/J mice with wild-type C57BL/6J males. CD45.1 donor Ids^y/−^ were generated following the same procedures using the B6.SJL-Ptprc^a^ Pepc^b^/BoyJ background.(Gleitz et al, 2018). Mice were bred according to standard procedures as previously delineated (Catalano et al, 2023). Mice were anesthetized and perfused with 50 ml of phosphate-buffered saline (PBS). For the glucose tolerance test (GTT), animals were weighed in the morning and starved for 6 h. GTT was performed in the afternoon via intraperitoneal injection. Glucose solution was purchased from Sigma (G8769; 45% glucose solution w:v) and diluted in PBS to a concentration of 1 mg/g of body weight in a total volume of 200 μl. Glucose levels were measured using a glucometer (Swisspointofcare) on blood derived from tail puncture. All animal experiments in this study were approved by the Animal Experiments Committee (DEC) in the Netherlands and these complied with the Dutch legislature to use animals for scientific procedures.
Lentiviral vector construction and production
IDSco and IDS.IGF2co constructs were generated as described before (Catalano et al, 2023). Briefly, the vector was based on a pCCL backbone, with transgene expression driven by the MND promoter. IDS.SWAP vectors were generated by Gibson assembly. The backbone for the Gibson assembly was prepared through PCR amplification of the entire IDS.IGF2co vector, excluding the sequence encoding amino acids 29–41 of the human IGF2 tag (Fig. 1B). The insert for the Gibson assembly was generated by PCR amplification of a primer encoding the inserted epitopes (Fig. 1B) and with 20 bp overlap at the 5’ and the 3’ of the backbone. The Gibson assembly reaction consisted in mixing of 10 μl of Gibson Mix, 50 ng of backbone, and the insert at 3 times the molar concentration of the backbone, totaling 20 μl in volume. This mixture was incubated for 1 h at 50 °C. The Gibson mix was prepared by combining 80 μl of 1 M Tris Base, pH 8 (648310-M), 8 μl of 1 M MgCl2 (M8266), 10 μl of Phusion polymerase (M0530L), 6.4 μl of a 25 mM equimolar dNTPs mix (R0181), and 0.64 μl of T5 Exonuclease (M0663L). The IDS.IGF2del_co variant was generated by PCR amplification of the entire IDS.IGF2co vector, excluding the sequence encoding amino acids 30–40 of the human IGF2 tag, using primers with a 20 bp overlap. Gibson assembly for the IDS.IGF2del_co vector was performed using only the backbone. GFP vector was generated as described previously (Catalano et al, 2023). Lentiviral particles were generated as previously shown (Liang et al, 2022a). Functional viral titers were measured by transduction of HeLa cells as previously shown (Liang et al, 2022a, 2022b).
Transduction of HMC3 and uptake of IDS versions
For analysis of processing and specific activity, HMC3 were transduced at MOI 13.5 with lentiviral vectors encoding the IDS versions under study. For analysis of secretion, medium was refreshed 24 h before harvest. For measuring of the relative specific activity, IDS activity levels were measured in five 2-fold dilution of media. IDS activity was measured in media samples and cell lysate using 4-Methylumbelliferyl-α-l-idopyranosiduronic acid 2-sulphate disodium salt (4 MU)-analysis as described below. Western blot analysis was performed on cell lysate and media samples as described below. For uptake experiments, HMC3 cells were transduced at MOI 10 and cultured for a week in complete medium (DMEM supplemented with 1% penicillin/streptomycin (PS, Gibco 15070) and 10% fetal bovine serum (FBS-12A Capricorn Scientific)) before producing conditioned media by refreshing with complete medium 24 h before harvest. Conditioned medium containing secreted IDS proteins was centrifuged at 300× g for 5 min and filtered (0.45-μm filter, Millipore). Media were aliquoted and stored at −70 °C. Protein concentration was measured by IDS sandwich ELISA. Uptake experiments were performed on primary MPS II fibroblasts, bEND.3 cells, HMC3 and SH-SY5Y (seeding density 24 h before start of uptake: 100,000 cells/cm^2^) via incubation in conditioned media for 24 h at the indicated IDS-protein concentration. SH-SY5Y were expanded in DMEM/F12 (Gibco, 11320033) supplemented with 10% FCS and 1% NEAA (Gibco, 11140050) and 1% Pen/Strep. Differentiated into neurons was performed via culturing in Neurobasal medium (Gibco, 21103049) supplemented with 2% B27 (Gibco, 17504044), 10 μM retinoic acid (Sigma, R2625) and 1% GlutaMax (Gibco, 35-050-061) and 1% Pen/Strep. Differentiation of SH-SY5Y cells was started at day 1, after plating at a confluency of 100,000 cells/cm^2^ at day 0. Uptake in SH-SY5Y cells was performed at day 7 after start of differentiation.
Western blotting
Protein extracts from HMC3 cells and media supernatant were obtained as described below (IDS activity section). Western blotting and protein concentration assay were performed as described previously (Catalano et al, 2023). Protein concentration was determined using a Pierce^TM^ BCA Protein Assay Kit (Thermo Fisher Scientific) according to the manufacturer’s instructions, while a total of 12.9 μg (transfection—cells) of total protein or 12 μl (transfection—medium) of samples were used for SDS-PAGE analysis. Proteins were transferred to nitrocellulose blotting membranes (GE Healthcare) and blocked with 5% non-fat milk powder in PBS and probed by overnight incubation at 4 °C with goat anti-human IDS (1:1000, R&D Systems) in 5% non-fat milk powder in PBS supplemented with 0.1% Tween. Proteins were detected with IRDye 680 RD secondary antibodies (1:10,000; LI-COR Biosciences, Lincoln, NE) and were imaged using the Odyssey Infrared Imaging System (LI-COR Biosciences, Lincoln, NE). Protein content was quantified using Fiji; equal loading was determined by quantification of the total bands using the stain-free signal on the same gel used for immunoblotting.
IDS enzyme activity and postprandial glucose levels
Brain samples (right hemisphere) were disrupted as described previously (Catalano et al, 2023). Extracts from HMC3, HEK 293T, bone marrow and WBC were obtained in 100 μl of deionized water by snap-freezing on dry-ice and mechanical disruption. Debris was pelleted by centrifugation at 10,000 rpm for 5 min. Medium from HMC3 and HEK 293T was centrifuged at 10,000 rpm for 5 min to remove debris. To obtain plasma, blood samples were mixed 3:1 with 4% Citrate Buffer (6132-04-3 Sigma) and plasma was separated by centrifugation at 2000 × g for 10 min at 4 °C. Postprandial glucose levels were measured in plasma using a glucometer (OGM-191, Swiss Point of Care). Lysate from HMC3 and HEK 293T cells was diluted 50 times in 0.2% bovine serum albumin (BSA) in water (BSA, Sigma) for measurement of IDS enzyme activity, and two times in water for measurement total protein. Medium from HMC3 and HEK 293T cells was diluted ten times in 0.2% BSA for measurement of IDS activity. Lysate from bone marrow was diluted 51 times in 0.2% BSA in water for measurement of IDS enzyme activity and 6 times in water for measurement of total protein. Plasma was diluted 21 times in 0.2% BSA in water for measurement of IDS enzyme activity and 31 times in water for measurement of total protein. Lysate from WBC was diluted 21 times in 0.2% BSA in water for measurement of IDS enzyme activity and 3 times in water for measurement of total protein. IDS activity was measured as described in previously (Catalano et al, 2023) and using 4-Methylumbelliferyl-α-l-idopyranosiduronic acid 2-sulphate disodium salt (Biosynth, Carbosynth; 2.5 mM in 0.2 M Na-acetate buffer, pH 5) substrate and human α-l-Iduronidase (5 μg/ml in 0.1% BSA; R&D Systems) for 4 h at 37 °C (Voznyi et al, 2001). 1, 0.1, 0.01, 0.003 ng/μl of Elaprase were measured as a control. For normalization of enzyme activity in bone marrow per VCN in bone marrow (Fig. EV3D,E), IDS activity and VCN were fitted to a Michaelis–Menten model (Activity = (5203VCN)/(0.6086 + VCN)). The cohort average VCN (VCN_ave_) was then used as a reference to normalize the measured activity of each sample using the formula: Activity_norm_ = measured activity(VCN_ave_/(0.6086 + VCN_ave_))*((0.6086 + measured VCN)/measured VCN)).
ELISA
IDS sandwich ELISA was performed using the DuoSet kit according to manufacturer’s instructions (R&D, DY449-05). For IDS ELISA in plasma, plasma samples were diluted 1:700 in 1% BSA (Sigma) in PBS. LRP-1 direct ELISA was performed as described previously (Catalano et al, 2023). For competition ELISAs with the IGF2R (repeats 11-13; R&D, 2447-GR-050), IGF1R (R&D, 305-GR-050) and IR-A (R&D, 1544-IR-050/CF), plates were coated with mouse anti-HIS tag antibody (R&D, MAB050) at a concentration of 1 μg/ml (IGF1R and IGF2R) or 2 μg/ml (IR-A) and incubated O/N at RT. The following day, plates were washed three times with 0.05% Tween (Sigma) in PBS and blocked for 2 h at RT with 1% BSA (Sigma) in PBS. Receptors were added after dilution in 1% BSA in PBS at a concentration of 1 μg/ml (IGF2R and IGF1R) or 2 μg/ml (IR-A) and incubated 2 h at RT. After washing, 100 μl of conditioned media containing IDS-tagged versions at the concentration indicated and either 8 μM of biotinylated IGF2 peptide (AXU020, CellSciences), 4 μM of biotinylated IGF1 peptide (AQU050, CellSciences), or 0.8 μM of biotinylated insulin (AYU100, CellSciences) were applied to the wells and incubated 2 h at RT. Biotinylated ligands were detected by incubation with 100 μl of streptavidin-HRP (R&D, DY998) for 20 min at RT and incubation in 100 μl of substrate solution (R&D, DY999) for 20 min at RT. Reactions were stopped with 50 μl of 2 N HCl and signal was measured using a microplate reader. For IGF2R, IGF1R, IR-A and LRP-1R ELISAs (Fig. 2Α–D), conditioned media was produced by transduction of HMC3 cells, and by incubation in DMEM 1% penicillin/streptomycin (PS, Gibco 15070) and 0.1% BSA (Sigma) for 24 h. Media were filtered through a 0.45-μm filter, and concentrated using protein concentrators (Thermo Scientific, 88536). Mature human IGF2 peptide was purchased (MU100, CellSciences).
Lentiviral hematopoietic stem cell transduction and transplantation procedures
HSPC-LVGT was conducted in one experiment comprising all the experimental groups. In the same experiment, other experimental groups were included and are shown in the second set of experiments (Experiment 2) reported in Catalano et al, 2023. For this reason, this article and Catalano et al, 2023 share the IDSco, IDS.IGF2co and GFP groups. Transplantation procedures were performed as previously shown (Catalano et al, 2023). Briefly, Hematopoietic stem and progenitor cells were enriched from 8-week to 4-month-old male Ids^y/−^ CD45.1 mice by lineage depletion using the Lineage Cell Depletion Kit – mouse (Miltenyi Biotec). Lin^-^ cells were cultured in StemSpan SF expansion medium (Stemcell Technologies) supplemented with recombinant murine thrombopoietin (10 ng/ml, R&D Systems), recombinant murine stem cell factor (100 ng/ml, R&D Systems) and recombinant murine FMS-like tyrosine kinase 3 murine ligand (50 ng/ml, R&D Systems). Cells were transduced without transduction enhancers over 24 h at the indicated multiplicity of infection (MOI) with concentrated lentiviral particles and incubated at 37 °C with 5% CO_2_. The day after, 1 × 10^6^ transduced Lin^-^ cells (200 μl of cells suspension in PBS) were transplanted intravenously into 8/11 weeks-old male Ids^y/−^ CD45.2 recipients, previously subjected to 9 Gy total body irradiation (TBI) using the Gammacell 40 irradiator (Atomic Energy of Canada LTD, Ontario, Canada). No normalization for body weight was applied to the number of cells transplanted.
Mass spectrometry analysis of heparan sulfate and dermatan sulfate in brain
Brain samples were prepared as described previously using highly sensitive liquid chromatography tandem-mass spectrometry (LC-MS/MS) (Tanaka et al, 2018; Catalano et al, 2023). Internal standard for the analysis of heparan sulfate and dermatan sulfate were obtained by deuterio-methanolysis of heparan sulfate and dermatan sulfate as described in Catalano et al, 2023. An internal standard working solution was prepared by 25-fold dilution of HS and DS internal standards in 10 mM ammonium acetate in 90:10% (v/v) acetonitrile:water. 125 μl of brain homogenates were transferred into borosilicate tubes and dried under nitrogen. After addition of 25 μl of 2,2-dimethoxypropane and 300 μl of 3 M HCl-methanol (Merck, 90964), samples were incubated for 75 mins at 65 °C and dried under nitrogen. Samples were resuspended in 150 μl of internal standard working solution. In total, 13 μl of sample preparation were mixed with 187 μl 10 mM ammonium acetate in 90:10% (v/v) acetonitrile:water. LC-MS/MS was performed on a Sciex 5500 QTrap (tandem) mass spectrometer coupled to a Waters Acquity UPLC system.
Histopathology and immunohistochemistry
After perfusion, brain, liver, spleen and heart were excised and the left hemisphere was fixed in methacarn (v/v – 60% absolute methanol, 30% chloroform, 10% glacial acetic acid), dehydrated in 50% and 70% ethanol for 24 h and processed in paraffin (histokinette). Embedded samples were sectioned at either 10 µm (liver and spleen) or 8 µm (brain and heart) and either stained with alcian blue or processed for immunohistological staining. For alcian blue staining, sections were rehydrated and equilibrated in 0.1 N hydrochloric acid (Sigma) for 30 s, followed by staining in 1% Alcian Blue 8GX (Sigma) pH 1 for 30 min. Sections were incubated in 0.1 N hydrochloric acid (Sigma) for 30 s and stained in 0.1% nuclear fast red (Sigma) in 0.06 M aluminum sulfate hexadecahydrate (Sigma) for 5 min. Sections were rinsed in 95% ethanol, dehydrated and mounted in Entellan mounting medium (Sigma). Alcian blue stainings were scored according to the rules shown in Table EV2. For LAMP1 immunostaining in heart, sections were blocked for endogenous peroxidase in 3% hydrogen peroxidase (dilution 1:2 in dH_2_O of a 6% v/v solution BMS-2110-1E, PHC Corporation), and for endogenous avidin and biotin for 15 mins at room temperature according to the manufacturer’s (SP-2001, Vector Laboratories). Sections were then blocked for 30 min in staining buffer (3% BSA, 3% goat serum, 0.3% Triton X-100 in PBS) at room temperature. Sections were stained with LAMP1 primary antibody (rat anti-LAMP1,1:500, ab25245 Abcam) in staining buffer O/N at 4 °C. The day after, sections were incubated with goat anti-rat antibody biotinylated (1:200, 554014 BD Pharmingen). Sections were then incubated with streptavidin-HRP (1:50, DY998 R&D systems) in staining buffer for 60 mins at room temperature and incubated in impact DAB (SK-4105) for 2 mins. Sections (LAMP1 in heart and alcian blue staining) were mounted in Entellan (Sigma) and scanned by a NanoZoomer 2.0 (Hamamatsu Photonics, Japan). For immunohistochemical staining in brain, sections were rehydrated and blocked for 30 mins in staining buffer (3% BSA, 3% goat serum, 0.3% Triton X-100 in PBS) at room temperature. Sections were stained with primary antibodies detecting either LAMP1 (rat anti-LAMP1,1:500, ab25245 Abcam), CD68 (rat anti-CD68 IgG, 1:300, MCA1957T Bio-Rad), or GFAP (rabbit anti-GFAP IgG, 1:500, Sigma-Aldrich, G9269). After incubation overnight at 4 °C, sections were washed with PBS and stained with the appropriate secondary antibody conjugated to Alexa Fluor® 488 or Alexa Fluor® 594 (1:500, ThermoFisher Scientific) for 1 h. All sections were counterstained with Hoechst33258 (1:15000, Life Technologies) to stain nuclei. Pictures were obtained using an ST5LIA_311 Leica Stellaris5 confocal microscope. CD68 staining was quantified by counting the number of CD68-positive cells in three areas per brain region. The obtained values were averaged and normalized by the area analyzed to obtain the final number of CD68-positive cells per mm^2^. CD68 immunoreactivity was quantified by counting the number of CD68-positive cells in three distinct areas per brain region of three different mice. The resulting values per mouse were averaged and normalized by the analyzed area to determine the final number of CD68-positive cells per mm². For LAMP1 and GFAP stainings, fluorescence intensity was measured using ImageJ. Briefly, the channels displaying LAMP1 or GFAP signals in two distinct areas per brain region of three different mice were isolated, and the total fluorescence area was quantified after applying thresholding and LUT inversion. Final values were normalized by the area analyzed.
Flow cytometry analysis of chimerism
Flow cytometry analysis of chimerism in bone marrow was performed as previously described (Gleitz et al, 2018). Briefly, frozen vials of bone marrow were isolated from the right hindlimb tibia and femur, and from the humerus bones. Staining was performed in 4% FCS in PBS with FITC-mouse anti-mouse CD45.2 (BD Bioscience, 553772) and PE-mouse anti-mouse CD45.1 (BD Bioscience, 553776). Every experiment was performed with single-staining controls, unstained controls and isotype-stained controls (mouse IgG2a-FITC, BD Bioscience 349051; mouse IgG2a-PE, 349053). Measurement of chimerism was performed using a BD LSRFortessa and a FACS DIVA software recording 20,000 or more events per sample, while analysis was performed using FlowJo v10.
Quantitative polymerase chain reaction of vector copy number and chimerism
Vector copy number (VCN) and chimerism in bone marrow and brain were determined by quantitative polymerase chain reaction (qPCR) as described previously (Catalano et al, 2023). Briefly, VCN was measured using iTaq Universal SYBR Green Supermix (Bio-Rad, Hercules, CA) and primers specific for PSI (FW: 5’-CAGGACTCGGCTTGCTGAAG-3’; RV: 5’-TCCCCCGCTTAATACTGACG-3’) and mouse Albumin (FW: 5’-ACTTTGAGTGTAGCAGAGAGGAACC-3’; RV: 5’-*CTCTTCACTGACCTAAGCTACTCCC-*3’). Chimerism was determined as described previously (Catalano et al, 2023) using primers specific for the Cd45.1 allele (FW: 5’-CTGAGCCTGCATCTAAACCTGATC-3’; RV: 5’-TCACCTTCATAAAAGCCTTGT AGCTC-3’). Reactions were performed and measured in a CFX96 real-time PCR detection system and analyzed by CFX Manager 3.0 (Bio-Rad, Hercules, CA).
Micro-computed tomography (μCT) analysis of bone microarchitecture
Micro-computed tomography (μCT) imaging of the right ankle was performed using Quantum GX imaging system (PerkinElmer). For CT imaging, samples were fixed in 4% paraformaldehyde in PBS at 4 °C for 24 h, followed by washing in PBS. Samples were scanned while in PBS in 0.5 -ml polypropylene tubes. During scans, the following parameters were applied: 90 kV, 88 µA, 36-μm isotropic voxel size, 18 mm Field of View (FOV) and a Cu 0.06 mm + Al 0.5 mm standard filter. The acquired raw data were reconstructed with a resolution of 10 µm using Quantum GX2 software (PerkinElmer). Segmentation of talus, navicular-lateral cuneiform and medial cuneiform from the CT scans and 3D analysis were performed using the automated ASBMR measurement of the AccuCT software (PerkinElmer).
Statistics
Statistical analysis was performed GraphPad Prism (version 9.0.0. for Windows, San Diego, California USA, www.graphpad.com). All results are presented as mean ± SD and each data point is shown. Normality tests were performed by Shapiro–Wilk Test. Multiple comparison analysis was performed by one-way ANOVA with Bonferroni’s correction. Lysosomal pathology and neuroinflammation quantification in brain was analyzed by two-way ANOVA with Bonferroni’s correction using brain area and viral vector as categorical variables. Non-linear regression models were used to describe the relationship between heparan sulfate and other variables such as, VCN, IDS activity in brain, IDS activity in plasma, as well the relationship between VCN and activity in bone marrow, and signal and input concentration during functional ELISA. This analysis was performed using GraphPad Prism built-in models, such as one-phase decay and Michaelis–Menten. Linear regression analysis was performed using GraphPad Prism.
Supplementary information
Table EV1 Table EV2 Peer Review File Source data Fig. 1 Source data Fig. 2 Source data Fig. 3 Source data Fig. 4 Source data Fig. 5 Source data Fig. 6 Source data Fig. 7 Expanded View Figures
The reference list from the paper itself. Each links out to its DOI / PubMed record.
- 1Yoon JK, Schindler JW, Loperfido M, Baricordi C, De Andrade MP, Jacobs ME, Treleaven C, Plasschaert RN, Yan A, Barese CN et al (2024) Preclinical lentiviral hematopoietic stem cell gene therapy corrects Pompe disease-related muscle and neurological manifestations. Mol Ther 32:3847–386410.1016/j.ymthe.2024.09.024PMC 1157359939295144 · doi ↗ · pubmed ↗