Fecal steroids, short-chain fatty acids, and microbiota in high- versus low-yielding forest musk deer
Qindan Dai, Jie Wu, Feng Chen, Guimei Jiang

TL;DR
This study compares high- and low-yielding forest musk deer to understand how gut hormones, fatty acids, and microbes affect musk secretion.
Contribution
The study identifies specific gut microbiota and metabolites linked to musk secretion in forest musk deer.
Findings
High-yielding deer had higher testosterone, estradiol, and cortisol levels compared to low-yielding deer.
Low-yielding deer showed higher butyrate and hexanoate levels, which correlated inversely with steroid hormones.
Certain gut microbes like Ruminococcaceae UCG-014 were strongly associated with musk secretion and steroid metabolism.
Abstract
Adult male forest musk deer (Moschus berezovskii; FMD) possess high medicinal and economic value due to their musk secretion capacity. However, under farming conditions, a subset of individuals exhibit abnormal musk secretion or complete secretory failure, resulting in economic losses. This phenomenon is associated with lipid metabolism and gut microbiota alterations. We compared fecal steroid hormones, short-chain fatty acids (SCFAs), and bacterial communities between high-yielding and low-yielding FMD under identical captive conditions. Seven male FMD (2 ~ 6 years old) secreting normal musk comprised the high-yielding group (HFMD), while seven age-matched males secreting abnormal musk formed the low-yielding group (LFMD). Results showed significantly higher concentrations of testosterone (T), estradiol (E2), cortisol, and corticosterone (CORT) in HFMD versus LFMD group (p < 0.05).…
Genes, proteins, chemicals, diseases, species, mutations and cell lines named across the full text — each resolved to its canonical identifier and authoritative record.
Click any figure to enlarge with its caption.
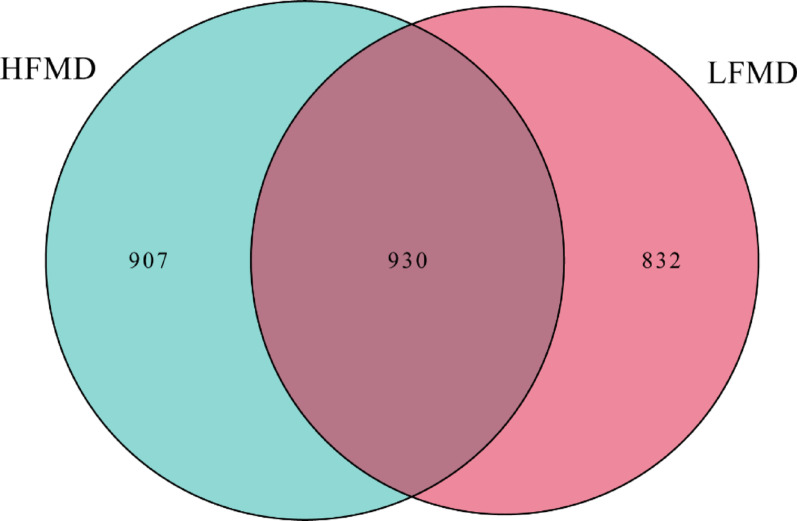 Figure 1
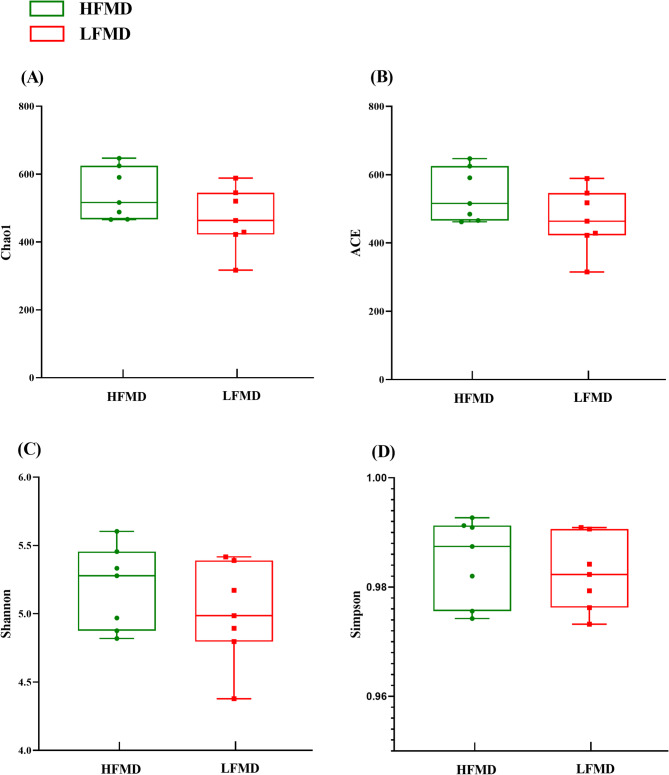 Figure 2
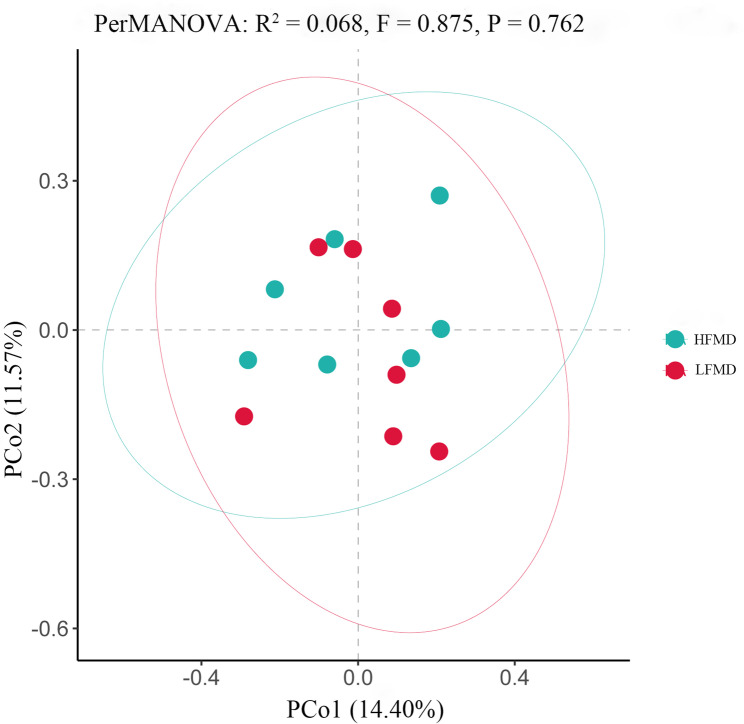 Figure 3
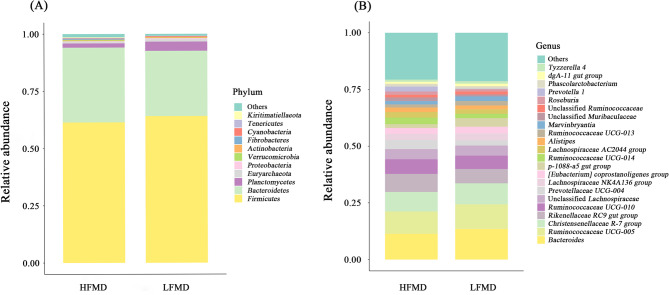 Figure 4
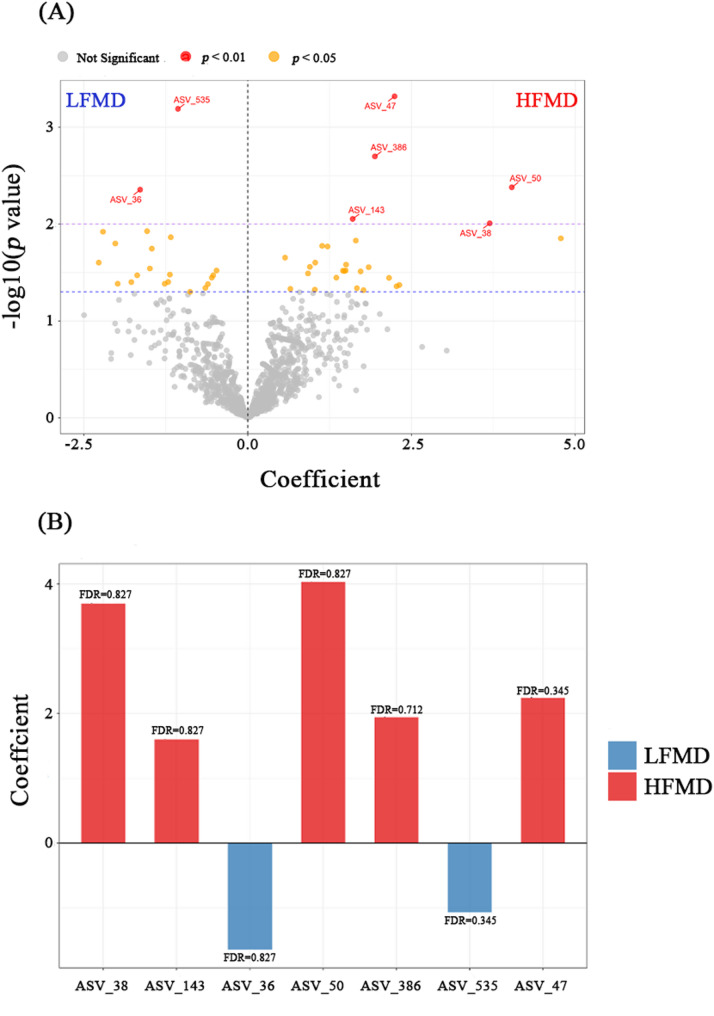 Figure 5
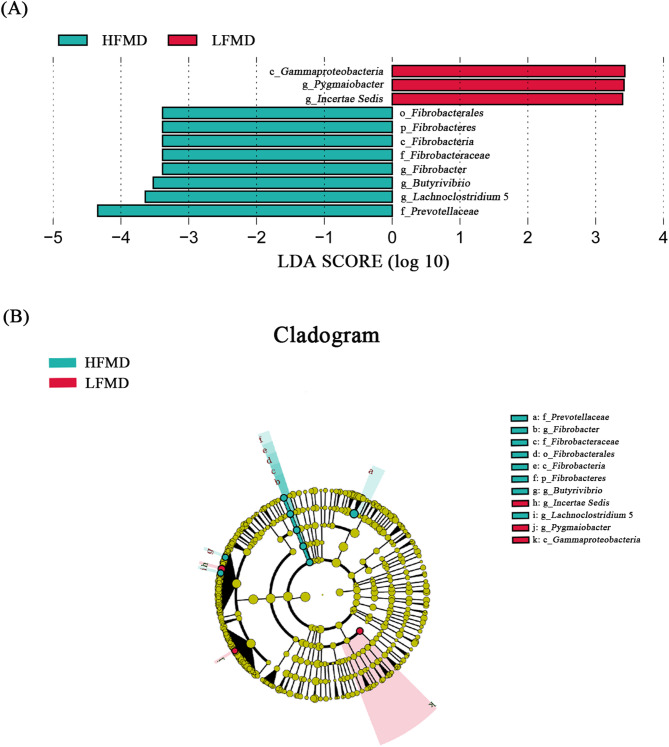 Figure 6
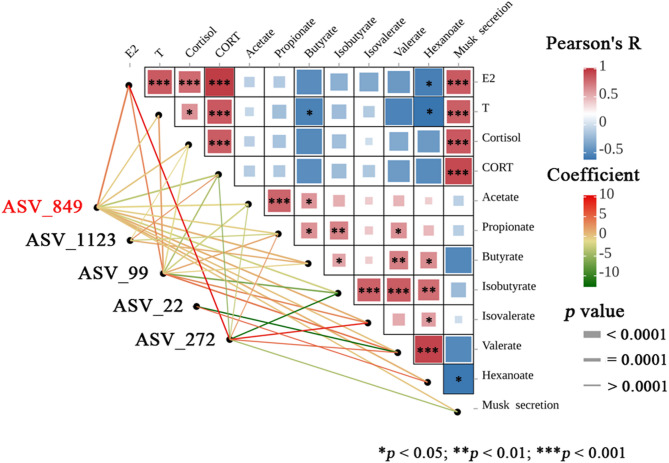 Figure 7
- —Integration and promotion of healthy and high-efficiency feed formulation technology for the breeding of forest musk deer
Peer Reviews
No public reviews on file for this paper yet. If you reviewed it on a platform where reviews are public (OpenReview, ICLR, NeurIPS, ICML), you can paste yours below so the community can read it here.
Videos
No videos yet. Explain this paper in a talk, walkthrough, or lecture? Add one.
Taxonomy
TopicsAnimal Behavior and Welfare Studies · Wildlife Ecology and Conservation · Pharmaceutical and Antibiotic Environmental Impacts
Introduction
The forest musk deer (Moschus berezovskii, FMD) is a small ruminant species belonging to the genus Moschus. It inhabits forested regions and is classified as a first-class protected wild animal in China (Li et al. 2016). This species exhibits distinct behavioral traits, including territoriality, solitary habits, and heightened vigilance (Hu et al. 2018a). Male individuals possess a specialized physiological structure called the musk gland, situated between the navel and genitals. In adults, this organ synthesizes, stores, and secretes musk—a highly prized substance in traditional Chinese medicine. Derived from the dried secretions of the male musk deer’s preputial follicles, musk serves as a premium medicinal ingredient with remarkable therapeutic properties, including promoting resuscitation, enhancing blood circulation, and improving collateral flow (Yang et al. 2003; Tang et al. 2018). Consequently, the FMD were heavily hunted in the past for their valuable musk, leading to a dramatic population decline. To protect the species and ensure sustainable musk production, China initiated captive breeding programs in 1958. However, despite the subsequent increase in captive populations, these farmed FMD frequently suffer from health issues, including diarrhea, parasitic infections, and abscesses (Yan et al. 2016; Hu et al. 2018b). Current evidence suggests that these factors not only impede population recovery but also compromise musk yield and quality. While pathological conditions constitute one influential factor, musk secretion is regulated by a complex interplay of biological determinants. Conventionally, aged or physiologically compromised males were thought to be the primary producers of abnormal musk; however, field observations reveal that even healthy young individuals may secrete atypical musk. Notably, clinically asymptomatic adults demonstrate significant variability in both secretion volume and biochemical profiles—ranging from normal musk (brown, solid, and mildly aromatic) to abnormal variants (acrid-smelling white/black secretions or non-secreted musk) (Zhang et al. 2021). Normal musk exhibits a highly complex biochemical composition, primarily consisting of macrocyclic ketones, pyridines, steroids, and other alkaloids, along with polypeptide proteins, fatty acids, esters, and inorganic acids, and atypical musk lacks main biochemical composition, rendering it pharmacologically inactive (Zhang et al. 2021). However, the biosynthetic pathways of these components remain poorly understood, significantly limiting our comprehension of musk formation mechanisms. Current investigations into musk synthesis have employed multiple approaches, including: histological and anatomical studies of the musk gland structure (Qi et al. 2020), analysis of sex hormone regulation in musk secretion (Tang et al. 2018), genetic profiling of musk-related genes (Zhou et al. 2020) and metabolomic analyses of glandular tissue, blood serum, and musk secretions (Wang et al. 2024b). Undoubtedly, accumulating evidence has demonstrated that steroid hormones, particularly sex hormones, serve as critical regulators in the musk formation process (Fan et al. 2018; Tang et al. 2018; Zhou et al. 2019).
Steroid hormones are synthesized from cholesterol and serve as key regulators of lipid metabolism. Cholesterol is acquired through two major pathways: dietary absorption and hepatic de novo biosynthesis (Luo et al. 2020). During digestion, the biliary system secretes cholesterol along with other bile components into the small intestine (Friedman and Nylund 1980). Dietary lipids (e.g., cholesterol) influence gut microbiota composition via microbial-derived metabolites. Research has identified multiple cholesterol-interacting gut bacteria, such as Bacteroides, suggesting that diet-dependent mechanisms for altering microbiome-specific cholesterol metabolism (Le et al. 2022). For ruminants, lipid metabolism—associated energy metabolism—is closely intertwined with gut microbiota. Short-chain fatty acids (SCFAs), key microbial metabolites derived from gut microbiota, play pivotal roles in modulating host metabolism by enhancing glucose and lipid homeostasis, regulating energy balance, and exerting immunomodulatory effects through inflammatory response regulation (Agus et al. 2021). Emerging evidence indicates bidirectional interactions between steroid hormones and SCFAs, clinical studies have demonstrated significantly reduced propionate levels in patients with endogenous glucocorticoid excess (Zhang et al. 2023). Consistent with the finding, Qiu et al. (2019a) reported decreased SCFAs production in glucocorticoid-induced obese individuals. Additionally, chemical analysis reveals the presence of ester compounds in musk secretions (Zhang et al. 2021). Based on the above findings, it can be inferred that musk secretion in FMD is associated with SCFAs and lipid metabolism. To date, there have been limited investigations into the potential influence of gut microbiota and SCFAs metabolism on musk secretion. Our review of existing literature reveals that hormonal regulation plays a significant role in FMD musk secretion behavior. However, critical knowledge gaps remain regarding the differential patterns of steroid hormones, SCFAs, and gut microbial composition between FMD exhibiting normal versus abnormal musk secretion patterns, particularly under identical dietary conditions.
Building upon the well-established correlation between steroid hormones and lipid metabolism, and considering the distinctive microbial metabolic system of ruminants, we hypothesized that musk secretion in FMD is regulated through an integrated mechanism involving not only hormonal control but also SCFAs associated with lipid metabolism pathways and gut microbial modulation. To test this hypothesis, we conducted a comparative analysis of fecal steroid hormones, SCFAs, and gut microbial composition in FMD maintained under identical dietary conditions, examining their potential associations with musk production efficiency. These findings provide crucial insights into the synergistic roles of steroid hormones, SCFAs, and gut microbiota in modulating musk secretion. Furthermore, This study investigates the differences between high- and low-yielding FMD, providing an experimental foundation for developing strategies to improve musk secretion in low-yielding individuals.
Materials and methods
Animals and feeding management
This study utilized a total of 14 adult FMD, aged 2–6 years, from the Markon Musk Deer Farm at the Sichuan Institute of Musk Deer Breeding in Aba Prefecture, Sichuan Province, China. All subjects were housed individually under standardized conditions, with clean enclosures maintained. The FMD received a consistent diet consisting of leaves provided at 6:00 AM and a supplemental mixture administered at 16:00 PM daily. This nutritional supplement contained a blend of concentrate and fresh vegetables, including carrot, lettuce, pumpkin, and cabbage. Water was available ad libitum.
Table 1. Characteristics of forest musk deer and their musk secretions in the present studySamplesAge (years)Musk descriptionMusk appearanceMusk secretion (g)HFMD-13NM22.6HFMD-22NM11.4HFMD-32NM14.1HFMD-44NM12.0HFMD-54NM14.7HFMD-62NM10.5HFMD-72NM11.8LFMD-12EM0.0LFMD-24WM0.0LFMD-34WM0.0LFMD-42EM0.0LFMD-52EM0.0LFMD-66WM0.0LFMD-76WM0.0NM, normal musk: standard musk with rich aroma; WM, white musk: white musk with no fragrance; EM, empty musk: musk pod without secretion. WM and EM are deemed valueless, with a recorded secretion of zero
Experimental design and sample collection
A total of 14 musk deer were assigned to two experimental groups: the HFMD group (n = 7), consisting of individuals secreting normal, high-quality musk, and the LFMD group (n = 7), comprising animals producing either low-quality musk or complete secretory failure. The musk extraction operation was performed in September 2024. And key traits of FMD and their musk are summarized in Table 1. To minimize potential stress-induced disturbances from musk extraction operation, fecal samples were collected in November 2024. Fresh feces from each FMD were collected in sterile tubes prior to morning feeding and immediately stored at − 80 °C for subsequent analyses.
Determination of fecal steroid hormone
Fecal samples (1 g wet weight) were homogenized in 15 mL sterile centrifuge tubes with 9 mL of phosphate-buffered saline (PBS; 0.01 mol/L, pH 7.2–7.4) by vortexing for 1 min. The homogenate was then centrifuged (5000 rpm, 4 °C, 15 min), and the supernatant was collected and stored at − 20 °C until analysis. Given the phylogenetic proximity of FMD to bovids (Chen et al. 2019), fecal testosterone (T), estradiol (E2), cortisol, and corticosterone (CORT) concentrations were quantified using commercial bovine ELISA kits (Jiangsu Baolai Biotechnology Co., Ltd, Taizhou, Jiangsu China). Each sample was analyzed in triplicate to ensure data reliability.
Short-chain fatty acid
Approximately 50 mg of sample was homogenized with 80% methanol-water solution using a tissue grinder. After centrifugation (15,000 rpm, 4 °C, 15 min), 20 µL of supernatant was transferred to a 1.5 mL microcentrifuge tube. The extract was then derivatized by adding EDC solution and 3-NPH reagent. The reaction mixture was diluted to 500 µL with initial mobile phase solution, vortex-mixed thoroughly, and 200 µL of the final solution was transferred to an autosampler vial for LC-MS/MS analysis.
The SCFA analysis was performed using an AB Sciex 4500 triple quadrupole mass spectrometer (Sciex, Framingham, MA, USA) coupled with a Jasper HPLC system. Chromatographic separation was achieved on an Agilent Poroshell 120 EC-C18 column (2.1 × 100 mm, 2.7 μm) maintained at 40 °C, with a 2 µL injection volume. The mobile phase consisted of water and a 1:1 (v/v) methanol: acetonitrile mixture. Mass spectrometric detection was conducted in negative ionization mode using multiple reaction monitoring (MRM) for optimal sensitivity and selectivity. The system was calibrated with authentic standards including acetic acid, propionic acid, butyric acid, isobutyric acid, valeric acid, isovaleric acid, and hexanoic acid, with all solvents being LC-MS grade and water purified through a Milli-Q system.
DNA extraction and 16 S rRNA gene sequencing
Genomic DNA (gDNA) was extracted from fecal samples using the Zymo Research BIOMICS DNA Microprep Kit (Zymo Research, Irvine, CA, USA). DNA integrity was verified by 0.8% agarose gel electrophoresis, while concentration and purity (A260/A280 and A260/A230 ratios) were quantified using a TECAN F200 microplate reader (Tecan, Shanghai, China). The V4 hypervariable region of the bacterial 16 S rRNA gene was amplified via PCR (Applied Biosystems^®^ 9700 PCR System, Thermo Fisher Scientific Inc., Waltham, MA, USA) using universal primers 515 F (5′-GTGYCAGCMGCCGCGGTAA-3′) and 806R (5′-GGACTACHVGGGTWTCTAAT-3′). Equimolar amounts of PCR products from all samples were pooled for downstream analysis. PCR amplicons were fragmented by sonication and processed into sequencing libraries using the NEBNext Ultra DNA Library Prep Kit for Illumina (New England Biolabs, Beijing, China), following the manufacturer’s protocol with dual-index barcoding. Libraries were prepared with the NEBNext Ultra II DNA Library Prep Kit for Illumina (New England BioLabs, MA, USA). Paired-end sequencing (PE250) was performed on an Illumina NovaSeq 6000 instrument using the NovaSeq 6000 SP Reagent Kit V1.5 (Illumina, San Diego, CA, USA). Raw sequencing reads underwent quality control and filtering to ensure high-quality data for subsequent bioinformatic analysis.
Sequencing data analysis
Paired-end reads were merged using FLASH (version 1.2.11) (Magoč and Salzberg 2011). Demultiplexing based on sample-specific barcodes was performed with sabre, after which barcode sequences were trimmed. Subsequent quality filtering, denoising, and chimera removal were conducted in QIIME2 (version 2020.2) (Bolyenet al. 2019) using the Deblur algorithm, yielding a table of amplicon sequence variants (ASVs) and representative sequences. Taxonomy was assigned to ASVs using a naïve Bayes classifier pre-trained on the SILVA (version 138) (Quast et al. 2013) reference database. The rarefaction curves were generated based on the number of ASVs. Additionally, relative abundance normalization was applied by dividing the count of each feature by the total read count of the respective sample, resulting in proportional abundance data used in downstream ecological analyses and visualization. All sequence data processing was conducted in R software (version 4.5.1). Microbial community diversity was evaluated using both alpha and beta diversity metrics computed through the Vegan package (Oksanen et al. 2016). Specifically, inter-sample community dissimilarity was quantified using Bray-Curtis distances generated by the vegdist function. For multivariate visualization, principal coordinates analysis (PCoA) was performed using the ape package (Paradis et al. 2004), with Bray-Curtis dissimilarity matrices as input. Statistical significance of observed group differences was assessed through permutational multivariate analysis of variance (PerMANOVA) using Vegan’s adonis function. To identify microbial taxa and metabolites exhibiting differential abundance and association, we performed multivariate association analysis using microbiome multivariable associations with linear models (MaAsLin2, version 1.22.0) (Mallick et al. 2021). The analysis incorporated a microbial abundance table encompassing taxa at the phylum, genus, and ASV levels, along with metabolite abundances and metadata that included the group variable and adjusted for covariates (age). Linear models (LM) were used as the analytical framework. Raw microbial read counts were normalized via total sum scaling (TSS) and subsequently log10-transformed. The analysis was performed using the following default parameter settings: normalization = “TSS”, transform = “log”, and analysis method = “LM”. To control for multiple testing, the Benjamini–Hochberg (BH) procedure was applied for false discovery rate (FDR) correction. Owing to the exploratory nature and limited sample size of this study, a relaxed false discovery rate (FDR) threshold (FDR < 0.3) was employed to identify potentially differential features warranting further validation. Effect sizes (coefficient) and standard errors were estimated for each association. Results were filtered to retain associations meeting either a FDR < 0.3 or a nominal p < 0.05, along with an absolute effect size greater than zero. Statistically significant associations were visualized using a heatmap. In addition, relative abundance bar plots were generated for phylum- and genus-level taxa, while volcano plots and bar charts were used to visualize ASV level results. To complement MaAsLin2, which strictly controls the false discovery rate (FDR < 0.3) but may overlook certain subtle yet biologically relevant associations, we also performed linear discriminant analysis effect size (LEfSe) using the online LEfSe platform (https://huttenhower.sph.harvard.edu/galaxy/), applying a threshold of LDA score > 2.0. LEfSe uses linear discriminant analysis to assess effect size and identify group-specific microbial features that could be overlooked by MaAsLin2. The combined approach offers a more comprehensive view of microbial differences between groups. The results of the LEfSe analysis are visualized through cladograms and effect size bar plots to illustrate phylogenetic relationships and highlight statistically significant taxa.
Statistical analysis
Fecal steroid hormones, volatile fatty acids, and alpha-diversity indices—was evaluated using the Shapiro–Wilk test. Data that followed a normal distribution were compared between groups using independent samples t-tests, following verification of homogeneity of variances with Levene’s test. In cases where data were normally distributed but variances were unequal, Welch’s t-test was applied. For data that did not meet the normality assumption, the non-parametric Mann–Whitney U test was used. All statistical analyses were performed using SPSS (version 27.0 for Windows; SPSS Inc., Chicago, USA). Results are expressed as mean ± standard error of the mean (SEM). To evaluate the associations among steroids, short-chain fatty acids, and musk yield, Pearson correlation analysis was conducted. The results were visualized as a heatmap generated using Origin 2022b (OriginLab Corp., MA, USA). Statistical significance was set at p < 0.05.
Results
Steroid hormone
Table 2. The differences of steroid hormone content between the HFMD and LFMD groupsItemsGroupsSEMp valueHFMDLFMDE2 (pg/g)684.55410.7139.932< 0.001T (pg/g)2033.541394.48106.193< 0.001Cortisol (ng/g)16.1510.080.955< 0.001CORT (ng/g)2194.471372.20119.585< 0.001E2, estradiol; T, testosterone; CORT, corticosterone
Obviously, the HFMD group exhibited significantly higher (p < 0.001) levels of E2, T, cortisol, and CORT compared to the LFMD group (Table 2).
Fecal Short-chain fatty acid
Table 3. The differences of fecal short-chain fatty acid between the HFMD and LFMD groupsItems (µg/g)GroupsSEMp valueHFMDLFMDTotal SCFAs3028.313742.28332.1300.298Acetate2050.002305.71201.5960.547Propionate397.29476.8656.7820.506Butyrate239.00415.5741.7480.040Isobutyrate54.8066.665.8130.327Isovalerate33.2139.213.7580.447Valerate37.1357.136.0130.097Hexanoate2.954.710.4190.028A:P6.185.140.6960.479The total SCFAs concentration is calculated as the sum of all individual SCFA; A:P, acetate/propionate ratio
As illustrated in Table 3, no significant difference (p > 0.05) of total SCFAs, acetate, propionate, isobutyrate, isovalerate and valerate concentrations were observed between the two groups. Similarly, acetate/propionate (A: P) did not show obvious difference (p > 0.05). The LFMD group exhibited a higher butyrate and hexanoate concentrations when compared to HFMD group (p < 0.05).
Microbial data acquisition and analysis
In the current study, 14 fecal samples were collected from the two groups. We obtained a total of 769,831 raw sequences by 16 S rRNA gene sequencing, with an average of 54,988 ± 828 (mean ± standard error) per sample (Supplementary Table S1). After quality filtering of sequence, the effective sequences were obtained, with an average of 53,088 ± 793 per sample. the Venn diagram (Fig. 1) illustrates the distribution of features between the HFMD and LFMD groups. To evaluate sequencing quality and the adequacy of sequencing depth, Q30 values (Supplementary Table S1) and rarefaction curves (Supplementary Fig. S1) were generated for each sample. All rarefaction curves reached a clear plateau, demonstrating that sufficient depth was achieved to reliably characterize the fecal bacterial community. Specifically, the HFMD group has 907 unique ASVs, while the LFMD group has 832 unique ASVs. Additionally, there are 930 shared ASVs between the two groups.
Fig. 1. Venn diagram illustrating the comparison between the HFMD and LFMD groups. The green circle denotes the HFMD group, while the red circle corresponds to the LFMD group
Bacterial alpha- and beta-diversity diversity analysis
Alpha-diversity showed that the Chao1, ACE, Shannon and Simpson indexes were similar (p > 0.05) between the HFMD and LFMD groups (Fig. 2). In this study, the PCoA analysis (Fig. 3) based on Bray-Curtis dissimilarity matrices revealed no clear separation in fecal microbiota structure between the HFMD and LFMD groups. Meanwhile, the PerMANOVA analysis of inter-group distances showed no significant microbial community differences between the two groups (R^2^ = 0.068, p = 0.875).
Fig. 2α diversity indices of gut microbiota. A Chao1, B ACE, C Shannon, and D Simpson. Each dot (●) represents a single biological sample from the HFMD group; each square (■) represents a sample from the LFMD group, with the x-axis indicating the experimental groups and the y-axis representing the calculated index values. Group distributions are illustrated as boxplots, where red and green boxes denote the HFMD and LFMD groups, respectively
Fig. 3. Principal coordinates analysis of bacterial communities between the HFMD and LFMD groups based on the Bray–Curtis distance. Each point in the graph represents one sample, and the green circles represent the HFMD group, while the red circles denote the LFMD group. The distance between points represents the level of difference
Analysis of differences between the HFMD and LFMD gut microbiota
At the phylum level, a total of 22 phyla were observed in 16 samples, of which Firmicutes (HFMD = 61.38% and LFMD = 64.11%), Bacteroidetes (HFMD = 32.69% and LFMD = 28.49%), and Planctomycetes (HFMD = 1.85% and LFMD = 4.01%) were the most abundant (Fig. 4A and Supplementary Table S2). The relative abuncances of Firmicutes, Bacteroidetes, Planctomycetes, Spirochaetes, Euryarchaeota and Proteobacteria were similar (p > 0.05; FDR > 0.30) between HFMD and LFMD groups. Furthermore, a similar (p > 0.05; FDR > 0.30) Firmicutes/Bacteroidetes ratio (F: B) was recorded in HFMD group compared to LFMD group. Then, compared with the LFMD group, the HFMD group exhibited a significantly higher relative abundance of Fibrobacteres (p = 0.013; FDR = 0.170), Tenericutes (p = 0.013; FDR = 0.107) and Verrucomicrobia (p = 0.037; FDR = 0.223).
Fig. 4. Histogram of relative abundance. The x-axis represents groups and the y-axis represents relative abundance. A Phyla exhibiting relative abundances greater than 0.5%. B Genera exhibiting relative abundances greater than 1%. Other species were combined as “Others”
At the Genus level, 256 genera were obtained, results showed that the predominant genera in the two groups mainly included Bacteroides (HFMD = 11.37% and LFMD = 13.46%), Ruminococcaceae UCG-005 (HFMD = 9.84% and LFMD = 10.91%), Christensenellaceae R-7 group (HFMD = 8.61% and LFMD = 9.25%), Rikenellaceae RC9 gut group (HFMD = 7.94% and LFMD = 6.31%) and Ruminococcaceae UCG-010 (HFMD = 6.48% and LFMD = 5.89%) (Fig. 4B and Supplementary Table S3). Whereas genera with a relative abundance exceeding 1%, no significant differences (p > 0.05; FDR > 0.3) were observed between the two groups.
The results of the differential analysis at a more refined ASV level are shown in Fig. 5. The volcano plot indicated a greater number of ASVs with nominally differential abundance (p < 0.05, FDR > 0.3) in the HFMD group compared to the LFMD group (Fig. 5A). A subset of ASVs showing the most pronounced nominal differences (p < 0.01, FDR > 0.3) was further examined using a bar chart (Fig. 5B). Among these, ASV_38, ASV_143, ASV_50, ASV_386, and ASV_47 exhibited markedly higher abundance in the HFMD group under this uncorrected significance threshold. Similarly, ASV_36 and ASV_535 also demonstrated increased abundance in the LFMD group, though none of these associations remained significant after correction for multiple testing.
Fig. 5. Differential analysis of microbial communities between the HFMD and LFMD groups at the ASV level. A Volcano plot of differential features: orange points represent taxa with p < 0.05, and red points indicate those with p < 0.01. B Bar plot showing significantly different taxa (p < 0.01) at the genus level. Taxonomic assignments are as follows: ASV_38, Prevotellaceae UCG-004; ASV_143, Rikenellaceae RC9 gut group; ASV_50, Rikenellaceae RC9 gut group; ASV_535, Christensenellaceae R-7 group; ASV_47, Rikenellaceae RC9 gut group; ASV_386, Ruminococcaceae UCG-010; ASV_36, Incertae Sedis
As demonstrated in Fig. 6, phylogenetic and taxonomic differences between the two groups were visualized through a cladogram and further quantified by LEfSe analysis. Notably, plot from LEfSe analysis (Fig. 6A) display LDA scores of microbial taxa with significant differences, and the cladogram (Fig. 6B) showed differences in 11 taxa between the HFMD and LFMD groups. At the genus level, significant microbial biomarkers for the HFMD group included Fibrobacter, Butyrivibrio and Lachnoclostridium 5, while the LFMD group showed distinct biomarkers comprising Pygmaiobacter and Incertae Sedis.
Fig. 6LEfSe analysis. A Plot from LEfSe analysis. The plot was generated using the online LEfSe project. The length of the bar column represents the LDA score. The figure shows the microbial taxa with significant differences between the HFMD (green) and LFMD (red) groups (LDA score > 2). B A cladogram showing the differences in relative abundance of taxa at five levels between the HFMD and LFMD groups. The plot was generated using the online LEfSe project. The green and red circles mean that HFMD and LFMD groups showed differences in relative abundance and yellow circles mean non-significant differences
Correlation analysis
As illustrated in Fig. 7, the association analysis identified five ASVs with an FDR threshold below 0.5 that were significantly correlated with physicochemical parameters. Notably, ASV_849 demonstrated significantly positive associations with E2, butyrate, isovalerate, and hexanoate (p < 0.001; FDR = 0.246), and significantly negative associations with CORT, acetate, and isobutyrate (p < 0.001; FDR = 0.246). In addition, ASV_849 was tentatively positively associated with musk secretion (p < 0.001, FDR = 0.332), whereas ASV_272 showed a potential negative association (p < 0.001, FDR = 0.396).
Fig. 7. Integrated correlation network of gut microbiota (ASV level) and key metabolic parameters. Links show significant relationships between microbial features and environmental variables (MaAsLin2) and among environmental variables (Pearson). Red/blue colors indicate positive/negative correlations respectively, with color intensity reflecting correlation strength. Only ASVs with a false discovery rate (FDR) below 0.5 are displayed. Selected taxonomic assignments are shown: ASV_849, Ruminococcaceae UCG-014; ASV_1123, Desulfovibrio; ASV_99, Christensenellaceae R-7 group; ASV_22, Bacteroides; ASV_272, Ruminiclostridium 6
Pearson correlation analysis revealed significant positive correlations between musk secretion and all measured hormones: E2 (R = 0.84, p < 0.001), T (R = 0.82, p < 0.01), Cortisol (R = 0.85, p < 0.001), and CORT (R = 0.91, p < 0.001). Conversely, butyrate (R = −0.54, p < 0.05) and hexanoate (R = -0.61, p < 0.05) concentrations were significantly inversely associated with T. Furthermore, hexanoate concentration exhibited significant negative correlations with both E2 (R = −0.55, p < 0.05) and musk secretion (R = -0.60, p < 0.05).
Discussion
In commercial musk secretion systems, both the quality and yield of musk secretions from captive FMD greatly influence overall production efficiency. Previous studies indicate that musk quality is determined by multiple interrelated factors, such as hormonal regulation, genetic predisposition, and disease susceptibility (Yan et al. 2016; Fan et al. 2018; Zhou et al. 2019). The quality of musk can be preliminarily assessed based on its color and physical characteristics. For instance, abnormal musk secretions—such as white or black discoloration accompanied by a pungent odor, as well as hollow musk sac glands (Zhang et al. 2021). In the present study, the HFMD group exhibited significantly higher levels of T, E2, cortisol, and CORT compared to the LFMD group, consistent with prior research (Wang et al. 2024a) indicating that high musk-yielding FMD possess elevated T levels. Similarly, the observed positive correlation between steroid hormone levels and musk secretion provides direct evidence of endocrine regulation in this process. Interestingly, one study found that T and E2 appear to play a predominant role in shaping musk composition specifically during the initial secretion phase, rather than the subsequent maturation stage (Fan et al. 2018). Steroid hormones play a crucial role in musk secretion, as evidenced by multiple studies. Yang et al. (2021b) established that the musk gland of male FMD exhibits endogenous steroid hormone biosynthesis capability, with musk secretions containing diverse steroid classes including androgens, progestins, estrogens, and sterols. This finding is further supported by Zhang et al. (2021), who reported substantially reduced concentrations of both steroid hormones and amino acids in white musk relative to normal musk specimens. Thus, steroid compounds play a dual regulatory role, not only mediating musk secretion processes but also determining the characteristic chemical profile of musk. T and E2, the primary sex steroids governing gonadal development, are detectable in both sexes of musk deer with concentrations exhibiting marked fluctuations across developmental stages (Russell andGrossmann 2019). Concurrently, cortisol and CORT serve as pivotal homeostatic mediators, orchestrating metabolic and endocrine adaptive responses (Vandewalle et al. 2018; Escoter-Torres et al. 2019). Chronister et al. (2021) demonstrated that elevated circulating levels of cortisol, E2, and T correlated with heightened susceptibility to depression- and anxiety-like behaviors. Their findings further identified interactive effects between T and cortisol in regulating neuroendocrine-emotional pathways. In light of these findings, steroid hormones serve as key regulators of musk secretion, demonstrating significant positive associations with musk secretion in FMD. Notably, individuals with high musk productivity appear to display heightened sensitivity to emotional stressors. The underlying mechanisms remain unclear: whether these physiological responses stem from endogenous neuroendocrine pathways, are mediated by exogenous environmental triggers that disrupt hormonal homeostasis, or involve a combination of both.
Steroid hormones also play a crucial role in regulating lipid metabolism. T deficiency has been shown to exacerbate diet-induced hepatic lipid accumulation, while normal T levels may help regulate adipose tissue mass by stimulating lipid oxidation (Gibney et al. 2005; Nikolaenko et al. 2014). As a ruminant species, the FMD ferments structural and non-structural carbohydrates in the rumen through microbial activity, producing SCFAs. These SCFAs are rapidly absorbed by the ruminal epithelium and can supply up to 75% of the total metabolizable energy (Siciliano-Jones and Murphy 1989; Dijkstra et al. 2005; He et al. 2018), while the hindgut contributes an additional 12% of the energy supply (Wu et al. 2023). SCFAs function both as metabolic energy sources and signaling molecules, regulating hormone secretion, anti-inflammatory responses, apoptosis, and lipid metabolism (Farzi et al. 2015; Schönfeld and Wojtczak 2016). Musk secretion is regulated by steroid hormones, and during the musk secretion period, steroid hormone levels rise sharply, accompanied by testicular swelling and fasting behavior in FMD. Accordingly, during the fasting period, SCFAs become particularly crucial as the primary energy supply for ruminants. Currently, there is limited research investigating SCFA concentrations in FMD feces, and the proportional distribution of SCFAs within the musk deer intestinal tract remains unclear. Our findings reveal substantial variations in SCFA content, with acetate concentrations ranging from 1,100 to 3,680 µg/g, propionate from 183 to 841 µg/g, and butyrate from 181 to 657 µg/g. These results demonstrate considerable fluctuation in SCFA levels across samples. The FMD exhibits a significantly higher average A: P ratio compared to other ruminants (Qiu et al. 2019b). This elevated A: P ratio suggests enhanced cellulose digestibility (Zhou et al. 2017), which may reflect evolutionary adaptations to their natural diet. The observed ratio could be attributed to the species’ selective foraging behavior, particularly their preference for young leaves that typically contain higher cellulose content and lower lignin compared to mature foliage. In our study, the LFMD group exhibited elevated butyrate and hexanoate in feces versus HFMD group. Butyrate serves multiple physiological functions as the preferred energy substrate for colonocytes while also mitigating oxidative stress, promoting gastrointestinal development, and modulating gut microbiota composition (Niwińska et al. 2017; Bedford and Gong 2018; Liu et al. 2021). Although hexanoate is produced in substantially lower quantities compared to the predominant SCFAs (acetate, propionate, and butyrate), emerging evidence suggests its potential beneficial effects on hepatic lipid metabolism and insulin sensitivity (Akpa et al. 2010; Rial et al. 2018). Evidence suggests that mobilization of cholesterol into steroidogenic pathways is regarded as the rate-limiting step in the rapid production of steroids (Miller and Auchus 2001). Butyrate can reduce serum triglyceride, inhibits cholesterol biosynthesis in vitro (Gao et al. 2009; Zhang et al. 2017), failing to enhance hepatic cholesterol uptake (Bridgeman et al. 2022). Mechanistically, Lu et al. established that butyrate modulates E2 biosynthesis in porcine granulosa cells through cAMP-dependent signaling pathways (Lu et al. 2017). Similarly, hexanoate exerts analogous metabolic effects through lipid metabolism-related pathways. In murine models subjected to high-fat diet regimens, hexanoic acid administration significantly upregulated hepatic gluconeogenic gene expression (Ikeda et al. 2025). Our study indicates that low-yield FMD show a metabolic preference for increasing fecal SCFAs. It also revealed significant negative correlations between fecal butyrate and T, and between hexanoate and both T and E2, which were similarly associated with reduced musk secretion. Nevertheless, it should be noted that around 85 ~ 100% of ruminal SCFAs are absorbed by the epithelium, leaving little to reach the hindgut (Reynolds and Huntington 1988; Bergman 1990). Consequently, a critical point is whether the low musk yield in the FMD group stems from reduced ruminal epithelial absorption of SCFAs, resulting in their excessive accumulation in feces. Alternatively, high-yielding FMD group likely exhibit enhanced SCFA absorption, facilitating energy metabolism and supporting steroid hormone synthesis, which may ultimately enhance musk secretion. Therefore, this hypothesis requires further validation through targeted research. Nonetheless, it is evident that SCFAs contribute to the regulation of musk secretion.
Gastrointestinal microbial ecosystems, which have profound impacts on ruminant health and productivity, are influenced by diet, feeding regime, animal age, and health status (Oikonomou et al. 2013; Qiu et al. 2019b). In this investigation, we identified Firmicutes and Bacteroidetes as the dominant microbial taxa, which aligns with prior characterizations of musk deer gut microbiota where these two phyla were similarly reported as predominant components (Zhao et al. 2021; Yang et al. 2021a). In our study, the elevated abundances of Fibrobacteres and Tenericutes in the HFMD group suggest a enhanced capacity for fiber and polysaccharide degradation (Ransom-Jones et al. 2012; Wang et al. 2020). Given that fiber breakdown stimulates ruminal SCFA production, these microbial shifts likely led to an increased SCFA supply. This, in turn, supports our earlier hypothesis that rumen epithelial absorption of SCFAs may be more efficient in the HFMD group. Verrucomicrobia are recognized for their beneficial roles in maintaining intestinal health, modulating immune responses, and alleviating hepatic steatosis and intestinal inflammation (Cani et al. 2022; Zhang et al. 2025). In alignment with our findings, a previous study conducted in porcine rectal content also reported the presence of Verrucomicrobia and further identified a negative correlation between its abundance and butyrate levels(Sebastià et al. 2024). Our LEfSe analysis identified two butyrate-producing genera (Butyrivibrio and Lachnoclostridium) as being significantly enriched in the HFMD group, butyrate exhibits anti-inflammatory properties, and enhances the intestinal barrier by upregulating tight junction proteins (Mills et al. 2019). Butyrate-producing probiotics can mitigate the progression of non-alcoholic fatty liver disease (Endo et al. 2013). Of note, a recent research reported that increasing the relative abundance of the Lachnoclostridium genus may confer benefits for non-alcoholic fatty liver management (Dai et al. 2023). Differentially, among the biomarkers enriched in the LFMD group, Pygmaiobacter also can contributed to SCFAs promotion, especially butyric acid (Sun et al. 2022). Incertae Sedis from Ruminococcaceae, is integral to fermenting dietary fibers and facilitate the production of SCFAs, and increased abundance is associated with a reduced risk of liver disease-related mortality (Yamamoto et al. 2024). It can therefore be inferred from the above that butyric acid likely possesses a distinct function within this mechanism. Although not statistically significant, our high-resolution ASV level analysis detected Incertae Sedis (ASV_36) as a potentially enriched microbe in the HFMD group. Our ASV level analysis identified several intriguing, though not statistically significant, patterns following multiple testing correction. Specifically, multiple ASVs within the Rikenellaceae RC9 gut group showed suggestive enrichment in HFMD patients, with ASV_47 approaching significance and ASV_50 demonstrating a considerable effect size. These preliminary findings, while potentially limited by the sample size and stringent analytical corrections, still highlight promising microbial targets that require validation in larger independent cohorts to confirm their association with musk formation. Rikenellaceae RC9 gut group has been demonstrated to regulate lipid metabolism (Sebastià et al. 2024). Furthermore, correlation analysis revealed that Ruminococcaceae UCG-014 (ASV_849) positively influences butyrate and E2 levels, suggesting a potential trend of affecting musk secretion. Ruminococcaceae UCG-014 has been shown to promote SCFA production and exhibits a positive correlation with acetate (Liu et al. 2022) and it has been associated with hepatoprotective effects (Milton-Laskibar et al. 2022). In summary, comparative analysis of the gut microbiota in high-yield and low-yield forest musk deer using both LEfSe and MaAsLin2 revealed inconsistencies in the identification of differentially abundant microbial taxa. These discrepancies may be attributed to differences in the statistical stringency and underlying modeling principles of the two methods, as well as the limited sample size of the current study. Particularly, certain microbial signatures might only be detectable at higher resolution levels such as ASV, whereas analyses conducted at broader taxonomic classifications (e.g., genus) may mask biologically relevant but subtle variations. Nevertheless, this study offers preliminary insights into possible structural divergences in the gut microbiome between high- and low-yield FMD, providing a valuable foundation for further mechanistic investigation. Subsequently, we recommend focusing on specific bacterial groups (such as Ruminococcaceae and Rikenellaceae), and employing integrated multi-omics approaches—including metagenomics and metabolomics—in expanded cohorts to systematically unravel their functional roles in musk production.
Conclusion
In conclusion, our study reveals distinct metabolic profiles between high- and low-yield FMD populations. Specifically, high-yield individuals demonstrate elevated steroid hormone levels in the feces, while their low-yield counterparts exhibit significantly increased concentrations of fecal butyric and hexanoic acids. Besides, we identified differential microbial biomarkers in the gut microbiota of these two populations. This suggests a potential gut microbiota–SCFA–liver–steroidogenesis–musk secretion axis, offering novel insights into the endocrine-microbial mechanisms that regulate musk secretion. To enhance musk secretion, this study recommends three key research priorities: first, to clarify how ruminal VFA absorption regulates steroid hormone synthesis in forest musk deer across physiological conditions; second, to precisely control musk secretion by targeting critical metabolic pathway components; and finally, to identify key microbial taxa involved in musk secretion—especially those linked to VFA and steroid metabolism—enabling targeted dietary strategies to improve musk yield. These efforts will provide essential theoretical and practical support for musk production under farmed conditions. Regretfully, obtaining representative tissue specimens (particularly liver or musk sac) presents significant challenges.
Supplementary Information
Below is the link to the electronic supplementary material.
Supplementary Material 1: Figure S1. Rarefaction curve of the sequencing data; Table S1. Summary of raw and clean sequencing statistics across all samples; Table S2. Differences at the phylum level between the HFMD and LFMD groups; Table S3. Differences at the genus level between the HFMD and LFMD groups.
The reference list from the paper itself. Each links out to its DOI / PubMed record.
- 1Gao Z, Yin J, Zhang J, Ward RE, Martin RJ, Lefevre M, Cefalu WT, Ye J (2009) Butyrate improves insulin sensitivity and increases energy expenditure in mice, vol 58. Diabetes, pp 1509–1517. 10.2337/db 08-163710.2337/db 08-1637 PMC 269987119366864 · doi ↗ · pubmed ↗
- 2Russell N, Grossmann M (2019) Mechanisms in endocrinology: estradiol as a male hormone. Eur J Endocrinol 181. 10.1530/EJE-18-1000. R 23-R 4310.1530/EJE-18-100031096185 · doi ↗ · pubmed ↗
- 3Zhang Y, Li Q, Tan H, Nie S (2025) Chap. 15 - Verrucomicrobia: Akkermansia. Gut Microbiota, and Health, Academic Press, PP 347–377. 10.1016/B 978-0-443-21630-5.00015-0