Bile acid metabolism and invasion-related genes as therapeutic monitoring biomarkers in non-small cell lung cancer
Guangteng Wu, Lin Zhu, Feng Xue, Yanyi Zhao

TL;DR
This study identifies key genes linked to bile acid metabolism and tumor invasion in lung cancer, which could help monitor treatment and improve patient outcomes.
Contribution
The study introduces a novel therapeutic monitoring model based on bile acid metabolism and invasion-related genes in NSCLC.
Findings
109 genes were identified at the intersection of bile acid metabolism and tumor invasion in NSCLC.
SLC1A5 and CD36 are critical genes linked to immunosuppression and tumor metabolism.
A predictive model using LASSO and SVM showed strong potential for monitoring treatment response.
Abstract
Non-small cell lung cancer (NSCLC) persists as a major contributor to global cancer morbidity and mortality. This study explores the complex interplay between bile acid metabolism (BAM), tumor invasion, and the immune microenvironment in NSCLC pathogenesis. While traditionally known for digestive functions, bile acids are crucial signaling molecules, and their metabolic pathways, coupled with invasion-related genes (IRGs), are increasingly implicated in tumorigenesis. Using the NSCLC dataset GSE225620, we identified 109 differentially expressed genes at the intersection of BAM and invasion (BAM&IRDEGs). Functional analysis revealed their significant enrichment in metabolic pathways, including fatty acid metabolism, which are critical for shaping the tumor microenvironment and fostering aggressive growth. Immune infiltration analysis indicated significant remodeling, particularly…
Genes, proteins, chemicals, diseases, species, mutations and cell lines named across the full text — each resolved to its canonical identifier and authoritative record.
Click any figure to enlarge with its caption.
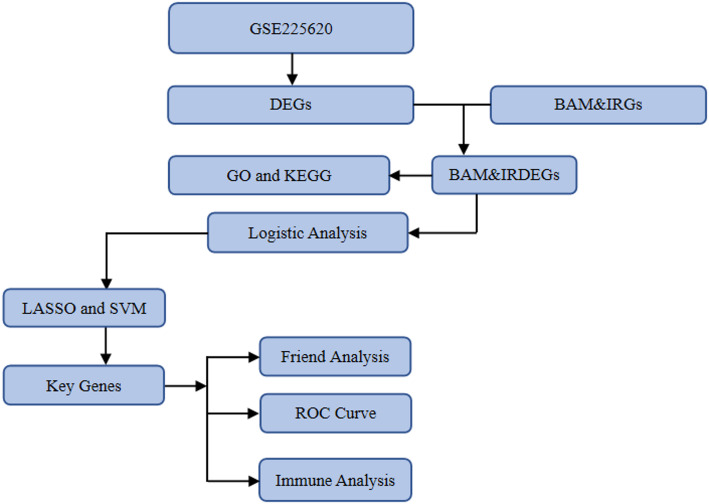 Figure 1
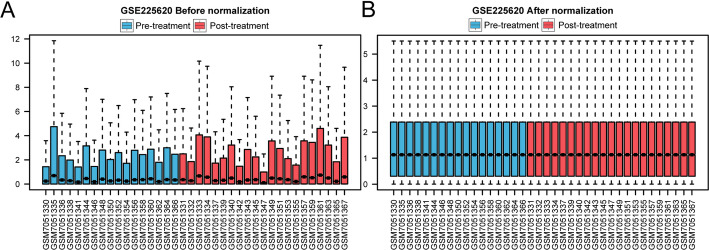 Figure 2
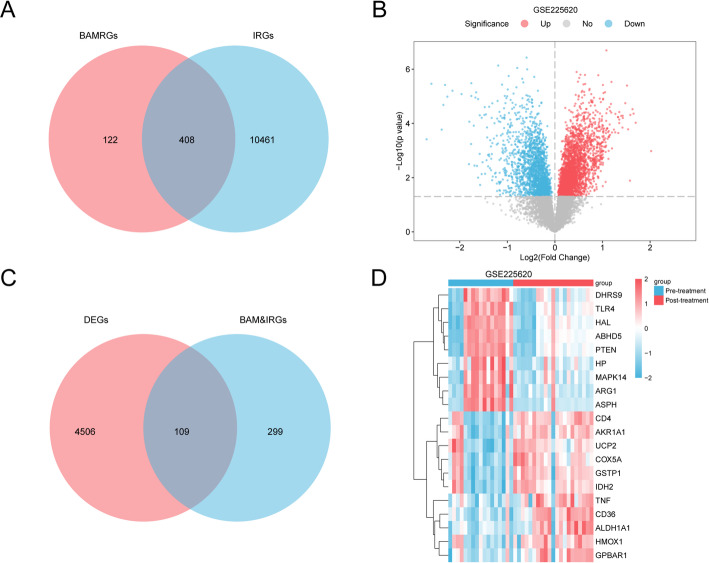 Figure 3
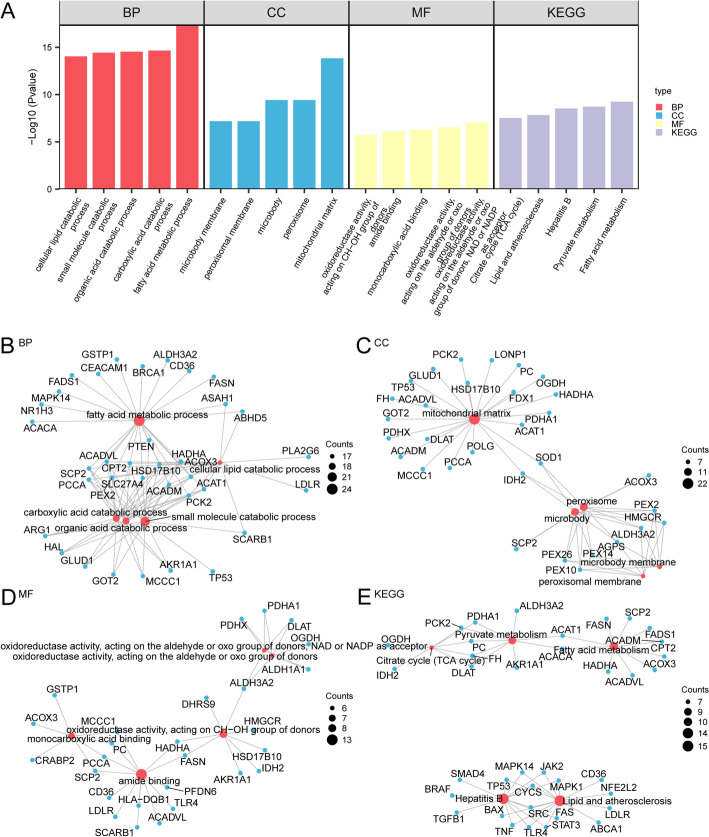 Figure 4
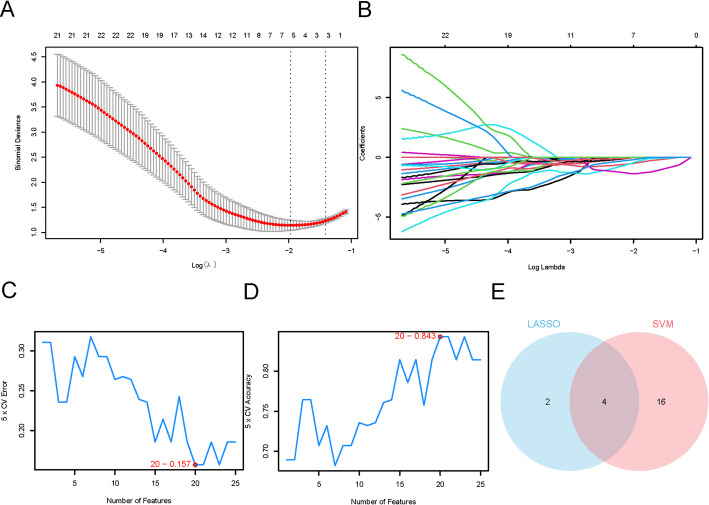 Figure 5
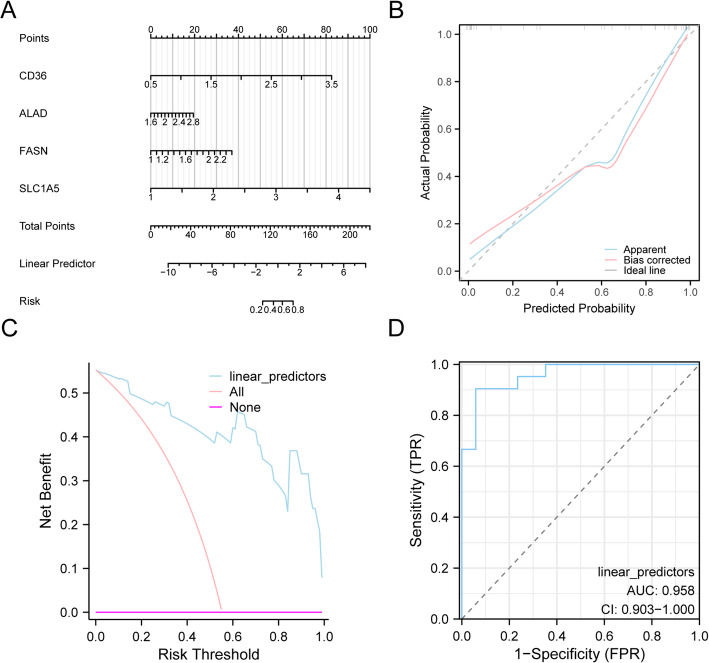 Figure 6
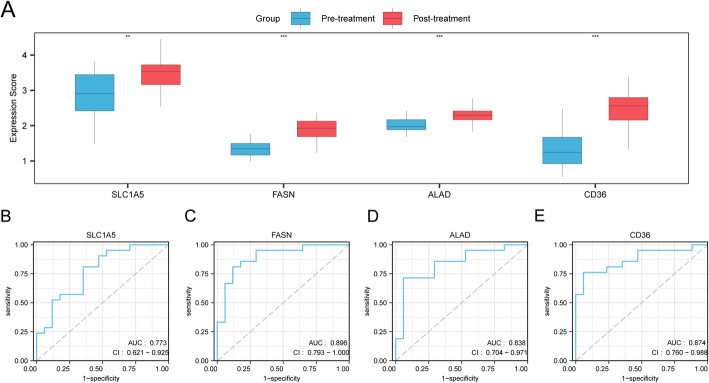 Figure 7
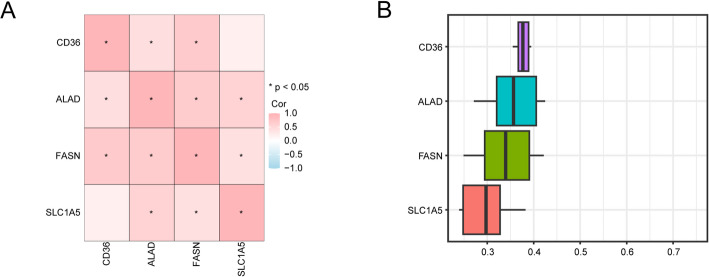 Figure 8
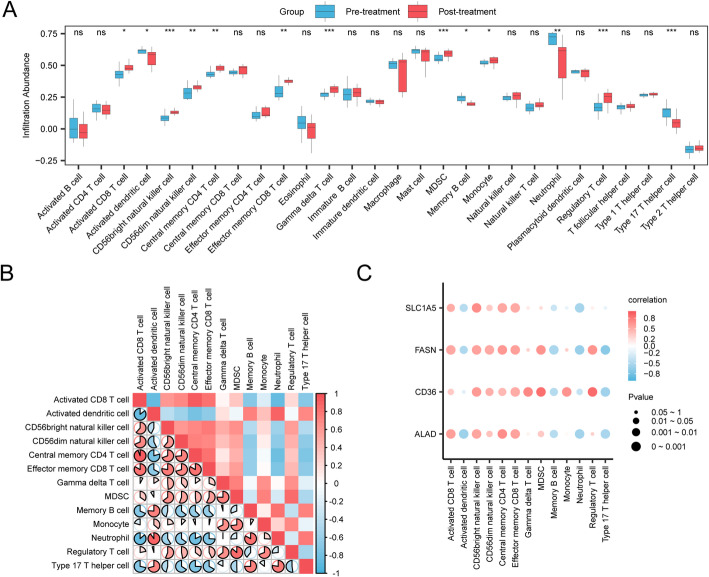 Figure 9
- —National Natural Science Foundation of China
- —2021 Guilin City Science Research and Technology Development Plan Project
- —Guangxi Medical and health key discipline construction project
- —Quzhou City Qujiang District Life Oasis Public Welfare Service Center; Health Development Promotion Project - Cancer Research Project
- —Beijing Xisike Clinical Oncology Research Foundation
Peer Reviews
No public reviews on file for this paper yet. If you reviewed it on a platform where reviews are public (OpenReview, ICLR, NeurIPS, ICML), you can paste yours below so the community can read it here.
Videos
No videos yet. Explain this paper in a talk, walkthrough, or lecture? Add one.
Taxonomy
TopicsFerroptosis and cancer prognosis · Cancer, Lipids, and Metabolism · Cancer Immunotherapy and Biomarkers
Introduction
Cancer constitutes a complex and heterogeneous group of diseases, and the conceptual understanding of it has profoundly evolved from a tissue-centric to a molecular and ecosystem-based perspective. This paradigm shift has consequently reshaped therapeutic strategies, fostering a transition from generalized treatments to personalized medicine tailored to the specific genetic and molecular aberrations of an individual’s tumor [1]. This conceptual evolution underscores that cancer is not a static entity but rather a dynamic process characterized by significant intratumor heterogeneity and clonal evolution, which pose considerable challenges to conventional therapeutic strategies.
Non-small cell lung cancer (NSCLC) remains a significant global health burden, imposing substantial strain on healthcare systems and adversely affecting patient survival rates worldwide [2]. Characterized by high rates of morbidity and mortality, this malignancy presents considerable socioeconomic challenges in addition to its clinical ramifications. The current standard of care encompasses surgical intervention, chemotherapeutic regimens, radiation therapy, and molecularly targeted agents [3, 4]. Despite significant advancements in these therapeutic modalities, persistent limitations, including heterogeneous treatment responses and the development of acquired resistance, highlight the urgent need for novel therapeutic paradigms [5, 6]. This clinical imperative motivates our investigation into novel pathobiological mechanisms with the potential to yield more effective therapeutic targets.
This study investigates the interplay between genes related to bile acid metabolism and invasion (BAM&IRGs) within the context of NSCLC. A growing body of evidence implicates these genes in tumorigenesis and cancer progression [7, 8]. Indeed, preceding studies have established that systemic bile acid metabolism is dysregulated in NSCLC, identifying significant alterations in patient serum bile acid profiles and linking this aberrant metabolism to tumor progression and adverse clinical outcomes [9, 10]. Bile acids, traditionally recognized for their function in lipid digestion, are now appreciated as key modulators of various cellular processes, including proliferation, apoptosis, and inflammation, all of which are implicated in carcinogenesis [11, 12]. Furthermore, the influence of bile acid metabolism extends to the modulation of the tumor immune microenvironment. For instance, a recent study in liver cancer demonstrated that the intratumoral accumulation of bile acids can directly suppress the function of anti-tumor T cells, thereby impeding an effective immune response and facilitating immune escape [13]. Recent research has further underscored the crucial role of bile acid metabolism in lung cancer pathogenesis. For example, the membrane bile acid receptor TGR5 has been shown to drive NSCLC progression by activating the JAK2/STAT3 signaling pathway, thereby promoting cell proliferation and migration; its overexpression is also associated with a poor prognosis in patients with NSCLC [14]. Moreover, metabolomic analyses have revealed distinct alterations in the bile acid profiles of NSCLC patients, such as increased primary bile acids (e.g., cholic acid, taurocholic acid) and decreased secondary bile acids (e.g., lithocholic acid), with subtype-specific patterns observed between adenocarcinoma and squamous cell carcinoma [9]. Concurrently, invasion-related genes are recognized as pivotal drivers of tumor metastasis, a primary determinant of poor prognosis in NSCLC [15]. Collectively, these findings provide a compelling rationale for investigating BAM&IRGs as potential novel biomarkers and therapeutic targets in NSCLC.
To elucidate the role of BAM&IRGs in NSCLC, this study utilized a comprehensive bioinformatics pipeline, encompassing data normalization, differential expression analysis, Gene Ontology (GO) and Kyoto Encyclopedia of Genes and Genomes (KEGG) pathway enrichment analyses, and the construction of predictive models. This computational methodology is adept at interrogating large-scale datasets, enabling the identification of clinically pertinent biomarkers and pathways within complex biological systems. In exploring the nexus between bile acid metabolism and tumor progression, the choice of sample source is of paramount importance. Whole blood samples offer distinct advantages for clinical applications due to their accessibility and suitability for dynamic monitoring. This minimally invasive approach facilitates the longitudinal observation of disease progression and therapeutic response. Critically, the metabolic profile of whole blood, including bile acids, is reflective of the overall systemic state and is intricately correlated with immune cell function and the tumor immune microenvironment [16, 17]. Therefore, a study based on whole blood analysis is well-positioned not only to unveil key features of metabolic reprogramming and immune modulation in NSCLC but also to possess high potential for clinical translation into future diagnostic and personalized treatment strategies. The primary objective of this research is to identify key genes integral to the pathogenesis and prognosis of NSCLC, with a particular focus on those involved in bile acid metabolism and invasion. Notably, this study represents the first systematic investigation into the molecular interplay between these two biological processes in NSCLC. Furthermore, we aim to construct and validate a robust therapeutic monitoring model based on these identified genes. Such a model holds the potential to inform early detection, risk stratification, and the development of personalized therapeutic strategies for patients with NSCLC.
Materials and methods
Data acquisition and gene set curation
The transcriptomic dataset GSE225620 [18], pertaining to NSCLC, was acquired from the Gene Expression Omnibus (GEO) database [19]. Data retrieval was performed using the R package GEOquery (version 2.70.0) [20]. This dataset, derived from Homo sapiens, comprises a featureCounts matrix comparing gene expression profiles from 17 pre-treatment and 21 post-treatment whole blood samples. Detailed clinical characteristics of the samples are summarized in Table 1.
A comprehensive list of genes related to bile acid metabolism (BAMRGs) was curated from two primary sources. First, a search of the GeneCards database [21] using the keyword “Bile Acid Metabolism” yielded 135 protein-coding genes. Second, a literature search in PubMed identified an additional 481 BAMRGs from a published study [22]. After merging and removing duplicates from both sources, a final list of 530 unique BAMRGs was compiled for subsequent analysis (Table S1).
Similarly, a list of invasion-related genes (IRGs) was assembled. This involved querying the GeneCards database [21] with the term “Invasion,” which retrieved 10,861 protein-coding genes, and supplementing this list with 97 IRGs identified from a prior publication [23]. The combined dataset resulted in a total of 10,869 unique IRGs (Table S2).
To identify genes at the nexus of both biological processes, the curated lists of BAMRGs and IRGs were intersected. This intersection yielded 408 genes, hereafter referred to as BAM&IRGs, which were utilized for all downstream analyses. A complete list of these genes is provided in Table S3.
Identification of differentially expressed genes associated with bile acid metabolism and invasion in NSCLC
Samples from the GSE225620 dataset were stratified into Pre-treatment and Post-treatment groups. Differential expression analysis was subsequently performed between these groups using the limma R package (Version 3.58.1). Differentially expressed genes (DEGs) were identified based on the criteria of an absolute log2 fold change (|logFC|) > 0 and a p-value < 0.05. Genes were classified as upregulated (logFC > 0) or downregulated (logFC < 0). The results of this analysis were visualized as a volcano plot generated with the ggplot2 R package (Version 3.4.4).
To identify bile acid metabolism and invasion-related differentially expressed genes (BAM&IRDEGs) in NSCLC, we performed an intersection analysis between the DEGs derived from GSE225620 and a pre-compiled list of known bile acid metabolism and invasion-related genes (BAM&IRGs). The resulting overlap was depicted in a Venn diagram. Furthermore, a heatmap was generated using the pheatmap R package (Version 1.0.12) to illustrate the expression patterns of the top 20 most significant BAM&IRDEGs.
Functional and pathway enrichment analysis
To elucidate the biological roles of the identified BAM&IRDEGs, we conducted functional and pathway enrichment analyses. Specifically, GO [24] and KEGG [25] pathway analyses were performed using the clusterProfiler R package (Version 4.10.0) [26], Enrichment results were considered statistically significant if the p-value was less than 0.05 and the false discovery rate (FDR or q-value) was also less than 0.05.
Establishment of therapeutic monitoring model for NSCLC
To identify key genes predictive of therapeutic response in NSCLC, BAM&IRDEGs from the GSE225620 dataset were first subjected to a preliminary screening using univariate logistic regression analysis. Only genes with a p-value less than 0.05 were retained for further analysis.
Subsequently, two distinct machine learning algorithms were applied in parallel to this filtered gene set for robust feature selection. First, a Least Absolute Shrinkage and Selection Operator (LASSO) regression model was implemented using the glmnet R package (family = “binomial”, set.seed(500)) [27]. Ten-fold cross-validation was employed to determine the optimal regularization parameter (lambda), which guided the selection of a core set of predictive genes, hereafter termed ‘Model Genes’. These genes were then used to calculate a risk score for each patient. Second, a Support Vector Machine (SVM) algorithm [28] was utilized to identify another set of feature genes, selected based on the criteria of maximizing predictive accuracy while minimizing the classification error rate.
Finally, to derive a high-confidence gene signature, we identified the intersection of the gene sets selected by both the LASSO and SVM models. This final, overlapping set was designated as the ‘Key Genes (mRNA)’ and formed the basis for all subsequent downstream analyses, thereby ensuring their robustness as potential biomarkers.
Validation of the predictive model for NSCLC therapeutic response
To provide a quantitative and user-friendly tool for clinical application, a nomogram was developed based on the identified Key Genes using the rms R package. This nomogram graphically represents the logistic regression model, allowing for the prediction of therapeutic response by assigning a point value to the expression level of each Key Gene and summing these points to obtain a total score.
The model’s calibration was assessed by plotting a calibration curve, which evaluates the concordance between the nomogram-predicted probabilities and the actual observed outcomes. An ideal model exhibits a calibration curve that aligns closely with the 45-degree diagonal line.
Furthermore, the clinical utility and net benefit of the predictive model were evaluated through Decision Curve Analysis (DCA). The analysis was conducted using the ggDCA R package to generate DCA plots, which illustrate the potential clinical impact of using the model for decision-making across a range of threshold probabilities.
Finally, the discriminative performance of the model was quantified using Receiver Operating Characteristic (ROC) curve analysis with the pROC R package (Version 1.18.5). The Area Under the Curve (AUC) was calculated for the GSE225620 dataset to measure the model’s ability to accurately distinguish between the Pre- and Post-treatment groups.
Characterization and validation of the key gene signature
First, to confirm the differential expression patterns of the Key Genes, their expression levels between the Pre- and Post-treatment groups in the GSE225620 dataset were visualized. Subsequently, the individual discriminatory power of each Key Gene was assessed through ROC curve analysis using the pROC R package (Version 1.18.5). The AUC was calculated for each gene to quantify its ability to distinguish between the two treatment states.
Furthermore, to explore the interrelationships within the gene signature, a Spearman correlation analysis was performed on the expression levels of the Key Genes. The resulting correlation matrix was visualized as a heatmap generated with the pheatmap R package (Version 1.0.12).
Functional coherence analysis
To investigate the functional coherence of the Key Gene signature, a Gene Ontology (GO) semantic similarity analysis was performed using the GOSemSim R package. This method quantifies the functional relatedness between genes based on their shared GO annotations. Similarity scores were calculated for each gene pair across the three GO domains: Biological Process (BP), Cellular Component (CC), and Molecular Function (MF). The results were then visualized using the ggplot2 package to illustrate the functional relationships among the Key Genes.
Immune infiltration analysis
To characterize the tumor immune microenvironment (TIME) associated with therapeutic response, single-sample Gene Set Enrichment Analysis (ssGSEA) [29] was employed to estimate the infiltration levels of various immune cell subtypes (e.g., Activated CD8 + T cells, Activated dendritic cells, and Regulatory T cells). This analysis generated an immune infiltration score for each cell type in every sample from the GSE225620 dataset.
Subsequently, the infiltration scores of these immune cell populations were compared between the Pre- and Post-treatment groups, and the results were visualized. Spearman’s correlation analysis was then performed to assess both the interrelationships among different immune cell types and the association between Key Gene expression and immune cell abundance. The correlation matrices were visualized as heatmaps and bubble plots using the pheatmap and ggplot2 R packages, respectively.
Statistical analysis
R software (version 4.2.2) served as the computational environment for all data processing and statistical analyses in this study. Unless otherwise stated, comparisons between two continuous variables were executed by using the independent Student’s T-Test for normally distributed variables, whereas the Mann-Whitney U test (Wilcoxon Rank Sum Test) was utilized for non-normally distributed variables. For comparisons involving three or more groups, the Kruskal-Wallis test was implemented. Correlations among different molecules were evaluated by means of Spearman correlation analysis. All statistical tests were two-sided unless particularly indicated, with statistical significance determined as p-value < 0.05.
Results
Fig. 1. Technology Roadmap. DEGs Differentially Expressed Genes, BAM&IRGs Bile Acid Metabolism and Invasion-Related Genes, BAM&IRDEGs Bile Acid Metabolism and Invasion-Related Differentially Expressed Genes, GO Gene Ontology, KEGG Kyoto Encyclopedia of Genes and Genomes, LASSO Least Absolute Shrinkage and Selection Operator, SVM Support Vector Machine, ROC Receiver Operating Characteristic
Data preprocessing and quality control
The comprehensive analytical workflow for this bioinformatic study is depicted in Fig. 1. The GSE225620 dataset, stratified into Pre-treatment and Post-treatment cohorts, was subjected to a rigorous preprocessing pipeline. This included probe re-annotation and quantile normalization to ensure data quality and comparability across samples (Fig. 2A, B). Box plots generated before and after this process confirmed the effectiveness of the normalization, revealing a substantially more consistent expression distribution among samples post-processing.
Fig. 2. Dataset normalization before and after. A Box plot of the gene expression distribution in GSE225620 samples before normalization. B Box plot of the gene expression distribution in GSE225620 samples after normalization
Identification of differentially expressed bile acid metabolism- and invasion-related genes (BAM&IRDEGs)
To identify genes at the nexus of bile acid metabolism and invasion, we first intersected the BAMRG and IRG sets. This analysis yielded 408 common genes, hereafter designated as BAM&IRGs (Fig. 3A).
Next, we performed a differential expression analysis on the GSE225620 dataset to compare the Post-treatment and Pre-treatment groups using the limma R package. A total of 4,615 differentially expressed genes (DEGs) were identified (criteria: |logFC| >0, p < 0.05), comprising 2,679 upregulated and 1,936 downregulated genes. A volcano plot was generated to visualize these expression changes (Fig. 3B).
By intersecting the 4,615 DEGs with the 408 previously identified BAM&IRGs, we pinpointed a core set of 109 BAM&IRDEGs (Fig. 3C; a complete list is available in Supplementary Table S4). This gene set included several key representatives, such as FASN,* CD36*,* ALAD*, and SLC1A5. The differential expression patterns of the top 20 BAM&IRDEGs between the two treatment groups were subsequently visualized via a heatmap (Fig. 3D).
Fig. 3. Identification of BAM&IRDEGs. A Venn diagram showing the intersection of BAMRGs and IRGs. B Volcano plot of DEGs in the GSE225620 dataset. C Venn diagram showing the intersection of DEGs and BAM&IRGs. D Heatmap of the top 20 differentially expressed BAM&IRDEGs. BAMRGs Bile Acid Metabolism-Related Genes, IRGs Invasion-Related Genes, DEGs Differentially Expressed Genes, BAM&IRGs Bile Acid metabolism-invasion-related Genes, BAM&IRDEGs Bile Acid Metabolism&Invasion-Related Differentially Expressed Genes
Functional enrichment analysis of BAM&IRDEGs
To elucidate the biological functions and signaling pathways associated with the 109 BAM&IRDEGs in NSCLC, we performed GO and KEGG pathway enrichment analyses. The detailed results are summarized in Table 2.
The GO analysis revealed that the BAM&IRDEGs were significantly enriched in specific terms across all three domains. Key BP included the fatty acid metabolic process, carboxylic acid catabolic process, organic acid catabolic process, small molecule catabolic process, and cellular lipid catabolic process. For CC, enrichments were predominantly found in the mitochondrial matrix, peroxisome, microbody, peroxisomal membrane, and microbody membrane. The primary MF identified were oxidoreductase activity (acting on the aldehyde or oxo group of donors with NAD or NADP as acceptor; acting on the CH-OH group of donors), monocarboxylic acid binding, and amide binding.
Similarly, KEGG pathway analysis indicated that these genes were enriched in pathways including Fatty acid metabolism, Pyruvate metabolism, Hepatitis B, Lipid and atherosclerosis, and the Citrate cycle (TCA cycle). The results from both the GO and KEGG enrichment analyses are presented as bar graphs for clear visualization (Fig. 4A).
Furthermore, we constructed network diagrams based on the GO and KEGG analyses to illustrate the intricate relationships between the genes and their corresponding enriched terms for BP, CC, MF, and KEGG pathways (Fig. 4B–E). In these networks, the connecting lines represent the association between a gene and an annotated term, while the node size is proportional to the number of genes involved in that term.
Fig. 4GO and KEGG enrichment analysis of BAM&IRDEGs. A Bar graphs showing the top enriched GO terms (BP, CC, MF) and KEGG pathways. The x-axis represents the enriched terms, and the y-axis shows the -Log10(P-value). B–E. Network diagrams illustrating the relationships between genes and enriched terms for BP (B), CC (C), MF (D), and KEGG (E). Red nodes represent items, blue nodes represent molecules, and the lines represent the relationship between items and molecules. BAM&IRDEGs Bile Acid metabolism-invasion-related Differentially Expressed Genes, GO Gene Ontology, KEGG Kyoto Encyclopedia of Genes and Genomes, BP Biological Process, CC Cellular Component, MF Molecular Function. The screening criteria for GO and KEGG enrichment analysis were p value < 0.05 and FDR value (q value) < 0.05
Construction of therapeutic monitoring model for NSCLC
To identify candidate biomarkers for a therapeutic monitoring model in NSCLC, we initially screened the 109 BAM&IRDEGs using univariate logistic regression analysis. This preliminary screening identified 101 genes as being statistically significant (P < 0.05), the details of which are provided in Supplementary Table S4.
To further refine this candidate pool, we employed two distinct machine learning approaches. First, a LASSO regression model was constructed, which pinpointed six key BAM&IRDEGs: CD36,* ALAD*,* CD4*,* FASN*,* ACP5*, and SLC1A5 (Fig. 5A, B). Second, we developed a SVM model. An analysis of its error and accuracy rates revealed that the SVM model achieved optimal performance in distinguishing between treatment groups when using a specific set of 20 genes: ALAD,* HGF*,* SLC7A1*,* SLC1A5*,* CPT2*,* FASN*,* SLC3A2*,* PC*,* ACOX3*,* YY1*,* CD36*,* CPOX*,* ASPH*,* PTEN*,* FADS1*,* COX5A*,* PDHX*,* ALDH1A1*,* MAPK1*, and SOD1 (Fig. 5C, D).
To isolate the most robust and consistently performing biomarkers, we determined the intersection of the gene sets derived from both the LASSO and SVM models (Fig. 5E). This approach yielded four key genes for subsequent investigation: CD36,* ALAD*,* FASN*, and SLC1A5.
Fig. 5. Construction of a therapeutic monitoring model for NSCLC. A LASSO regression model plot of BAM&IRDEGs in dataset GSE225620. B Variable trajectory plot of LASSO therapeutic monitoring model. C The number of genes with the lowest error rate obtained by the SVM algorithm. D The number of genes with the highest accuracy obtained by the SVM algorithm. E Venn diagram of intersection between LASSO algorithm and SVM algorithm. LASSO Least Absolute Shrinkage and Selection Operator, SVM Support Vector Machine, BAM&IRDEGs Bile Acid Metabolism&Invasion-Related Differentially Expressed Genes
Validation of therapeutic monitoring model for NSCLC
To validate the therapeutic monitoring model, we first constructed a nomogram using the four key genes from the GSE225620 dataset to visualize their predictive contributions (Fig. 6A). The nomogram revealed that SLC1A5 expression had the most substantial impact on the model’s predictive score compared to the other variables.
Next, we assessed the model’s accuracy and discriminatory power using a calibration curve (Fig. 6B). This analysis compares the model’s predicted probabilities against the actual observed outcomes. The resulting curve showed only a minor deviation from the ideal diagonal line, indicating a high degree of calibration and reliable performance.
Furthermore, DCA was performed to evaluate the clinical utility of the key gene-based model (Fig. 6C). The DCA curve demonstrated that across a wide range of threshold probabilities, the model provided a greater net benefit than the strategies of treating all or no patients. This result underscores the model’s potential for clinical decision-making.
Finally, we evaluated the model’s ability to distinguish between pre- and post-treatment samples by plotting a ROC curve for the linear predictors derived from the logistic regression model (Fig. 6D). The resulting curve confirmed the model’s robust discriminatory performance in the GSE225620 dataset.
Fig. 6. Construction and validation of the therapeutic monitoring nomogram. A Nomogram for predicting treatment response based on four key genes. B Calibration curve for the nomogram. C DCA for the nomogram. D ROC curve analysis of the logistic regression model. DCA Decision Curve Analysis, ROC Receiver Operating Characteristic; AUC > 0.9 had high accuracy, AUC Area Under the Curve
Characterization and interrelation of key genes
First, to evaluate the key genes as potential treatment-response biomarkers, we assessed their differential expression between pre- and post-treatment groups in the GSE225620 dataset. This comparison revealed that all four genes were expressed at significantly different levels (Fig. 7A). Specifically, SLC1A5 showed significant differential expression (P < 0.01), while FASN, ALAD, and CD36 exhibited a highly significant difference (P < 0.001). We then evaluated the capacity of each gene to distinguish between the two treatment states by performing Receiver Operating Characteristic (ROC) analysis. The Area Under the Curve (AUC) for all four genes ranged between 0.7 and 0.9, indicating strong discriminatory power (Fig. 7B–E).
Fig. 7. Expression and diagnostic value of the four key genes. A Box plots showing the differential expression of SLC1A5,* FASN*,* ALAD*,* and CD36* between Pre-treatment and Post-treatment groups. B–E ROC curves evaluating the predictive performance of SLC1A5 (B), FASN (C), ALAD (D), and CD36 (E). (*** p < 0.001, ** p < 0.01)
Next, to investigate the co-expression patterns among these genes, we conducted a correlation analysis based on their expression profiles. The resulting heatmap revealed positive correlations between several key genes, with the most notable associations observed between FASN and CD36, and between SLC1A5 and ALAD (Fig. 8A).
Finally, to explore their functional relationships, we quantified the semantic similarity of the four key genes based on their GO terms using the GOSemSim R package. This analysis, visualized in box plots, showed that CD36 possessed the highest degree of functional similarity when compared with the other key genes (Fig. 8B).
Fig. 8. Correlation and functional similarity analysis of key genes. A Correlation analysis between Key Genes. B Functional similarity analysis of Key Genes. The absolute value of correlation coefficient (r value) below 0.3 was weak or no correlation, 0.3–0.5 was weak correlation, 0.5–0.8 was moderate correlation, and above 0.8 was strong correlation
Immune infiltration analysis
To characterize the tumor immune microenvironment, we quantified the infiltration abundance of 28 immune cell types in the GSE225620 dataset using the single-sample Gene Set Enrichment Analysis (ssGSEA) algorithm.
First, we compared immune cell infiltration levels between the pre- and post-treatment groups. This analysis revealed statistically significant differences (P < 0.05) in the abundance of 13 immune cell types, including key populations such as Activated CD8+ T cells, Central memory CD4+ T cells, Regulatory T cells, and Myeloid-derived suppressor cells (MDSCs) (Fig. 9A).
Next, a correlation heatmap was generated to visualize the relationships among these 13 differentially infiltrated immune cell types (Fig. 9B). The results showed strong positive correlations among most cell populations, with the most robust association observed between Activated CD8+ T cells and Central memory CD4+ T cells (r = 0.943).
Finally, we investigated the relationship between our four key genes and immune cell infiltration by generating a correlation bubble plot (Fig. 9C). This analysis revealed numerous positive correlations, the strongest of which was between the expression of CD36 and the infiltration of Regulatory T cells (r = 0.875).
Fig. 9. Immune Infiltration Analysis by ssGSEA Algorithm. A Comparison of the infiltration abundance of 28 immune cell types between Pre-treatment and Post-treatment groups. B Correlation heatmap of 13 differentially infiltrated immune cell types. C Bubble plot showing the correlation between the four key genes and immune cell infiltration. In panel A, asterisks indicate the level of statistical significance (ns p ≥ 0.05, * p < 0.05, *** p* < 0.01, *** p < 0.001). In panel C, the size of the bubble represents the p-value. ssGSEA, single-sample Gene-Set Enrichment Analysis
Table 1GEO microarray chip informationGSE225620SpeciesHomo sapiensSamples in post-treatment group21Samples in pre-treatment group17PMIDPMID:38,951,894GEO Gene Expression Omnibus; Post-treatment, Non-Small-Cell Lung Cancer
Table 2. Results of GO and KEGG enrichment analysis for BAM&IRDEGsOntologyIDDescriptionGeneRatioBgRatiop valuep.adjustBPGO:0006631Fatty acid metabolic process24/109395/18,8004.41315E-181.54372E-14BPGO:0046395Carboxylic acid catabolic process18/109238/18,8002.19593E-153.2193E-12BPGO:0016054Organic acid catabolic process18/109242/18,8002.94241E-153.2193E-12BPGO:0044282Small molecule catabolic process21/109376/18,8003.6813E-153.2193E-12BPGO:0044242Cellular lipid catabolic process17/109219/18,8009.09363E-156.36191E-12CCGO:0005759Mitochondrial matrix22/109473/19,5941.42121E-143.36827E-12CCGO:0005777Peroxisome11/109141/19,5943.79911E-103.00129E-08CCGO:0042579Microbody11/109141/19,5943.79911E-103.00129E-08CCGO:0005778Peroxisomal membrane7/10964/19,5946.49354E-083.07794E-06CCGO:0031903Microbody membrane7/10964/19,5946.49354E-083.07794E-06MFGO:0016620Oxidoreductase activity, acting on the aldehyde or oxo group of donors, NAD or NADP as acceptor6/10938/18,4108.87234E-083.97481E-05MFGO:0016903Oxidoreductase activity, acting on the aldehyde or oxo group of donors6/10946/18,4102.89694E-076.48915E-05MFGO:0033293Monocarboxylic acid binding7/10981/18,4105.092E-077.60405E-05MFGO:0033218Amide binding13/109402/18,4107.42111E-078.31164E-05MFGO:0016614Oxidoreductase activity, acting on CH-OH group of donors8/109140/18,4101.82135E-060.000163193KEGGhsa01212FATTY acid metabolism10/9657/85385.59751E-101.49454E-07KEGGhsa00620Pyruvate metabolism9/9647/85381.88072E-092.51076E-07KEGGhsa05161Hepatitis B14/96163/85383.01452E-092.68293E-07KEGGhsa05417Lipid and atherosclerosis15/96216/85381.46388E-089.77142E-07KEGGhsa00020Citrate cycle (TCA cycle)7/9630/85383.00215E-081.60315E-06GO Gene Ontology, BP Biological Process, CC Cellular Component, MF Molecular Function, KEGG Kyoto Encyclopedia of Genes and Genomes, BAM&IRDEGs Bile Acid Metabolism&Invasion-Related Differentially Expressed Genes
Discussion
NSCLC is the leading cause of cancer-related mortality. Despite advancements in treatment, the 5-year survival rate remains suboptimal, underscoring the urgent need to elucidate the underlying molecular mechanisms and identify novel therapeutic targets. This study employed a comprehensive bioinformatics approach to investigate the intricate interplay among bile acid metabolism (BAM), invasion-related genes, and the tumor immune microenvironment in NSCLC. Our investigation revealed that among 4615 differentially expressed genes (DEGs)—comprising 2679 upregulated and 1936 downregulated genes—109 were associated with both bile acid metabolism and invasion (designated as BAM&IRDEGs). These genes may represent critical regulators of NSCLC development and progression.
The identification of these BAM&IRDEGs is of particular interest. While the role of bile acids in carcinogenesis is complex and context-dependent, emerging evidence implicates their involvement in various malignancies, including colorectal, liver, and pancreatic cancers [30–32]. Beyond their canonical function in lipid digestion, bile acids are now recognized as signaling molecules that modulate cell proliferation, apoptosis, inflammation, and angiogenesis—all hallmarks of tumorigenesis [33]. The therapeutic potential of these BAM&IRDEGs warrants further exploration. For instance, ASPH overexpression in hepatocellular carcinoma (HCC) correlates significantly with tumor aggressiveness and metastasis. Notably, MO-I-1100, a small-molecule inhibitor of ASPH, has been demonstrated to inhibit the proliferation, migration, invasion, and colony formation of HCC cells [34]. Similarly, IDH2 is significantly overexpressed in triple-negative breast cancer (TNBC) and is associated with an unfavorable prognosis. Consistent with this, silencing IDH2 expression has been shown to suppress TNBC cell proliferation and invasion [35]. Therefore, preclinical validation of these targets using in vitro and in vivo models is an essential next step.
Pathway enrichment analysis revealed that the identified BAM&IRDEGs are significantly enriched in pathways related to fatty acid metabolism and bile acid degradation. These findings suggest a crucial role for these metabolic pathways in the pathogenesis of NSCLC. The concept of targeting metabolic reprogramming in cancer has gained considerable traction. For example, the FASN inhibitor TVB-3664 has shown significant anti-cancer activity in colorectal cancer models, an effect correlated with the upregulation of CD36, suggesting a compensatory mechanism involving increased fatty acid uptake [36]. Our results, which demonstrate the enrichment of BAM&IRDEGs in lipid metabolism-related pathways, suggest that targeting key enzymes or metabolites within these pathways may represent a promising therapeutic avenue for NSCLC.
Our analysis also revealed significant differences in the infiltration abundance of 13 immune cell types within the NSCLC microenvironment. A strong positive correlation was observed between activated CD8+ T cells and central memory CD4+ T cells (r = 0.943). These findings underscore the critical role of the tumor immune microenvironment in NSCLC progression. The tumor microenvironment is a complex ecosystem where diverse immune cells interact to influence tumor growth and metastasis. For instance, activated CD8+ T cells exert potent anti-tumor effects [37], whereas regulatory T cells can suppress anti-tumor immunity [38].Elucidating the functional roles of different immune cell subsets will provide a more comprehensive understanding of tumor immune evasion mechanisms.
Through LASSO regression and Support Vector Machine (SVM) analyses, we identified 6 and 20 key genes, respectively, with an intersection of 4 genes, including CD36 and SLC1A5. The therapeutic monitoring model constructed using these four genes demonstrated robust performance across both training and validation sets, highlighting their potential as biomarkers for therapeutic monitoring. Notably, the primary clinical utility of this model lies in predicting therapeutic efficacy, monitoring treatment response, and guiding individualized treatment decisions for NSCLC patients. Its application for initial diagnosis would necessitate further validation in studies designed to distinguish patients from healthy controls or to stratify disease stages.
Our findings suggest a critical interplay between tumor metabolism and immune infiltration, pointing toward several potential mechanistic axes. One is a metabolic-immune reprogramming axis, wherein lipid metabolism aberrations directly impact immune cell function [39]. For example, a lipid metabolism-inflammation pathway involving key genes such as CD36 may regulate fatty acid utilization, thereby shaping the local inflammatory and immune landscape [40]. Another is a bile acid signaling-immune regulation axis. Bile acids can activate receptors like TGR5, which has been shown to drive NSCLC cell growth via the JAK2/STAT3 pathway [14]. Given that STAT3 is a critical regulator of immune responses in the TME, bile acid signaling in tumor cells could indirectly modulate immune cell infiltration.
This framework provides a model for how key genes such as CD36 and SLC1A5 may facilitate immune evasion. CD36, a scavenger receptor, plays a direct role in T-cell exhaustion. Studies have shown that CD36 on the surface of CD8 + T cells promotes the uptake of oxidized lipids from the tumor microenvironment, which triggers a signaling cascade leading to T-cell dysfunction and an exhausted phenotype [40]. This offers a direct mechanism by which CD36-mediated lipid metabolism contributes to tumor immune escape.
SLC1A5 encodes an amino acid transporter primarily responsible for glutamine uptake. A specific SLC1A5 variant has been identified as a mitochondrial glutamine transporter critical for driving cancer metabolic reprogramming. By transporting glutamine directly into mitochondria, this variant enhances the metabolic fitness of tumor cells [41], likely creating a nutrient-deprived, immunosuppressive microenvironment that hinders T-cell function. This mechanism is consistent with the CD8+ T cell exclusion observed in our analysis [42, 43].
This study has several limitations that should be acknowledged. First, our findings are derived from bioinformatics analyses and require experimental validation through in vitro and in vivo studies. Second, the reliance on a single cohort with a limited sample size may affect the robustness of our conclusions. To enhance the generalizability of our findings, future research should incorporate multi-center clinical samples and expand the sample size. The challenge of small sample sizes in machine learning could also be addressed by employing advanced computational methods, such as Generative Adversarial Networks (GANs). As reviewed by Ai et al., GANs can augment data by generating realistic synthetic gene expression profiles, thereby improving the generalizability of predictive models [44]. Furthermore, the use of whole-blood transcriptomics, while non-invasive, may not fully capture the molecular events within the tumor microenvironment. Lastly, our analysis is potentially confounded by batch effects inherent in public datasets.
A promising future direction involves translating these findings into clinical applications, particularly through liquid biopsies. As recent updates in pediatric oncology highlight, liquid biopsies are powerful tools for diagnosis, treatment monitoring, and relapse detection [45]. If the expression of SLC1A5 or CD36 can be reliably measured in circulating components such as cfDNA or cfRNA, they could serve as part of a non-invasive panel for risk stratification and dynamic monitoring. Concurrently, based on the evidence linking fatty acid and glutamine metabolism to tumor progression, therapeutic strategies targeting SLC1A5 or CD36 could be integrated with existing chemotherapy or immunotherapy to potentially enhance therapeutic efficacy [46–48].
In conclusion, this study integrated multiple bioinformatics approaches to characterize the interplay between bile acid metabolism, invasion-related genes, and the immune microenvironment in NSCLC. We identified key genes, notably SLC1A5 and CD36, that are closely associated with NSCLC progression and established a therapeutic monitoring model with excellent predictive capability. These results not only deepen our understanding of the molecular mechanisms underlying NSCLC but also provide a foundation for developing novel diagnostic and therapeutic strategies.
Supplementary Information
Supplementary material 1.
The reference list from the paper itself. Each links out to its DOI / PubMed record.
- 1Fishilevich S et al. Gene Hancer: genome-wide integration of enhancers and target genes in Gene Cards. Database J. Biol. Databases Curation 2017, bax 028.10.1093/database/bax 028PMC 546755028605766 · doi ↗ · pubmed ↗
- 2Isocitrate dehydrogenase. 2 regulates the proliferation of triple-negative breast cancer through the ferroptosis pathway | Scientific Reports. https://www.nature.com/articles/s 41598-024-55561-010.1038/s 41598-024-55561-0PMC 1089921238413708 · doi ↗ · pubmed ↗