The Risk of Road Traffic Injuries Caused Hospitalization and the Risk of Mental Health Illness: A Nationwide, Matched‐Cohort, Population‐Based Study in Taiwan
Yu‐An Chen, Wu‐Chien Chien, Li‑Yun Fann, Ying‐Che Huang, Chi‐Hsiang Chung, Tsu‐Hsuan Weng, Chun‐Teng Tsai

TL;DR
This study shows that road traffic injury survivors face a higher risk of mental health issues like depression and anxiety compared to others.
Contribution
The study provides new evidence linking road traffic injuries to long-term mental health risks using a large, nationwide matched-cohort design.
Findings
RTI patients had a 2.20 times higher risk of mental health disorders compared to controls.
The increased risk remained significant after adjusting for confounding factors.
Findings suggest the need for early psychiatric screening in trauma care.
Abstract
While road traffic injuries (RTIs) are a significant global health concern, medical attention has predominantly addressed physical injuries, often overlooking the psychological impact on survivors. The mental health consequences of such traumatic events remain understudied and inadequately addressed in clinical practice. This study examined the association between RTIs and subsequent mental health disorders. We conducted a retrospective cohort analysis using claims data from Taiwan's National Health Insurance Research Database (NHIRD) between 2000 and 2015. The exposed cohort comprised 39,870 patients hospitalized following RTIs. These individuals were matched 1:27 with 1,076,911 control patients hospitalized for non‐RTI‐related conditions, using propensity score matching based on sex, age, and admission date. Multivariable Cox proportional hazards regression models were employed to…
Genes, proteins, chemicals, diseases, species, mutations and cell lines named across the full text — each resolved to its canonical identifier and authoritative record.
Click any figure to enlarge with its caption.
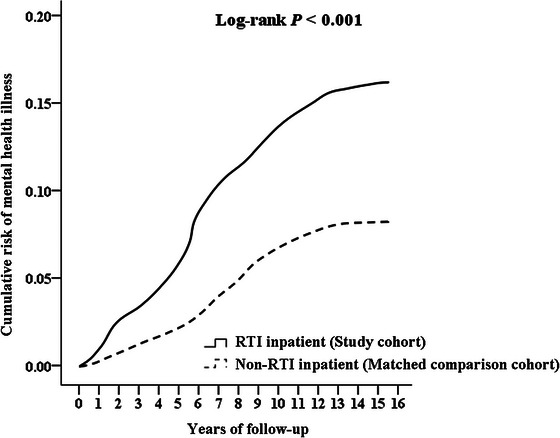 FIGURE 1
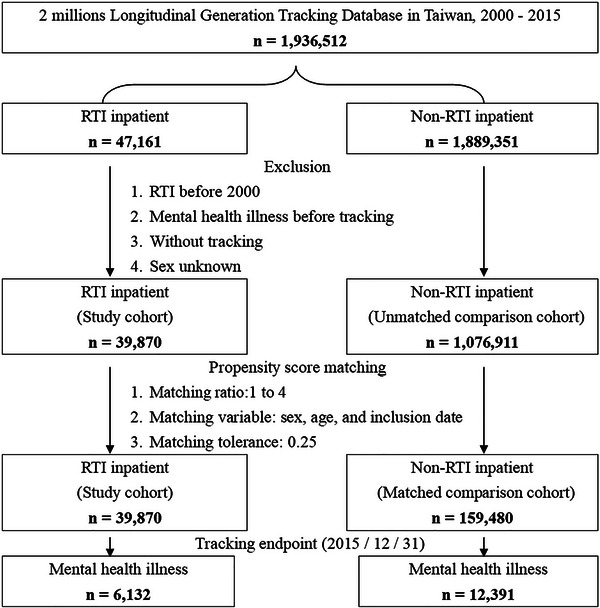 FIGURE 2
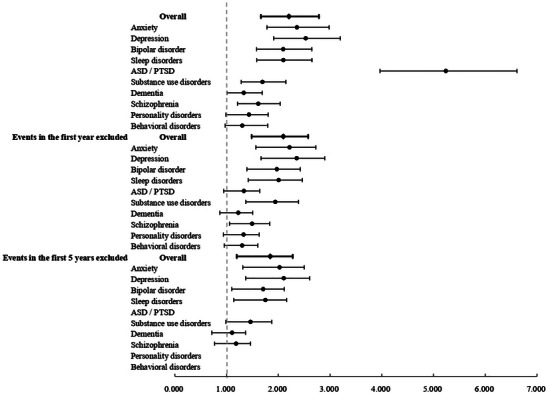 FIGURE 3
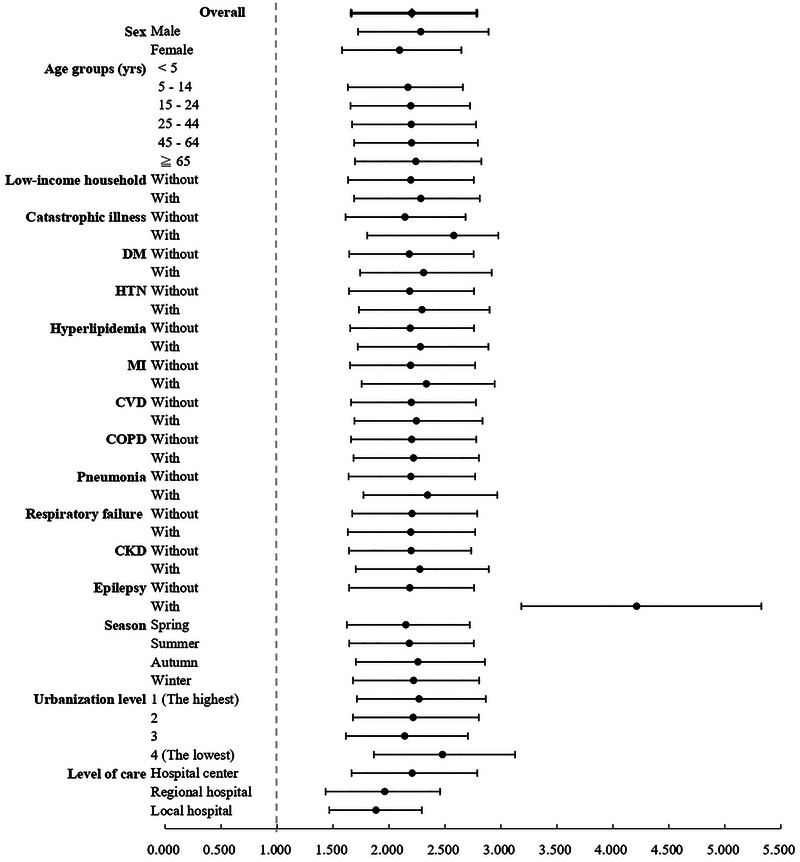 FIGURE 4
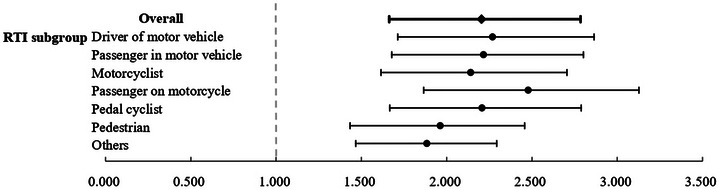 FIGURE 5
| Sex | Prognosis | |||||||||
|---|---|---|---|---|---|---|---|---|---|---|
|
Male ( |
Female ( |
Survive ( |
Death ( | |||||||
|
| % |
| % |
|
| % |
| % |
| |
| RTI inpatient | < 0.001 | 0.833 | ||||||||
| Driver of motor vehicle | 22,040 | 80.70 | 14,861 | 75.00 | 36,359 | 78.33 | 542 | 76.34 | ||
| Passenger in motor vehicle | 1366 | 5.00 | 396 | 2.00 | 1735 | 3.74 | 27 | 3.80 | ||
| Motorcyclist | 792 | 2.90 | 1,487 | 7.50 | 2244 | 4.83 | 35 | 4.93 | ||
| Passenger on motorcycle | 410 | 1.50 | 515 | 2.60 | 910 | 1.96 | 15 | 2.11 | ||
| Pedal cyclist | 1202 | 4.40 | 853 | 4.31 | 2020 | 4.35 | 35 | 4.93 | ||
| Pedestrian | 1255 | 4.60 | 1504 | 7.59 | 2,709 | 5.84 | 50 | 7.04 | ||
| Others | 246 | 0.90 | 198 | 1.00 | 438 | 0.94 | 6 | 0.85 | ||
| Prognosis | < 0.001 | N.A. | N/A | N.A. | N/A | N/A | ||||
| Survive | 26,819 | 98.20 | 19,596 | 98.90 | N.A. | N/A | N.A. | N/A | N/A | |
| Death | 492 | 1.80 | 218 | 1.10 | N.A. | N/A | N.A. | N/A | N/A | |
| Sex | N.A. | N/A | N.A. | N/A | N/A | < 0.001 | ||||
| Male | N.A. | N/A | N.A. | N/A | N/A | 26,887 | 57.93 | 424 | 59.72 | |
| Female | N.A. | N/A | N.A. | N/A | N/A | 19,528 | 42.07 | 286 | 40.28 | |
| Age groups (years) | < 0.001 | 0.985 | ||||||||
| < 5 | 109 | 0.40 | 99 | 0.50 | 205 | 0.44 | 3 | 0.42 | ||
| 5–14 | 710 | 2.60 | 476 | 2.40 | 1168 | 2.52 | 18 | 2.54 | ||
| 15–24 | 6418 | 23.50 | 3507 | 17.70 | 9773 | 21.06 | 152 | 21.41 | ||
| 25–44 | 8029 | 29.40 | 5013 | 25.30 | 12,838 | 27.66 | 204 | 28.73 | ||
| 45–64 | 7047 | 25.80 | 7292 | 36.80 | 14,128 | 30.44 | 211 | 29.72 | ||
| ≧ 65 | 4998 | 18.30 | 3427 | 17.30 | 8303 | 17.89 | 122 | 17.18 | ||
| Low‐income household | 464 | 1.70 | 337 | 1.70 | 0.988 | 784 | 1.69 | 17 | 2.39 | 0.143 |
| Catastrophic illness | 1174 | 4.30 | 535 | 2.70 | < 0.001 | 1663 | 3.58 | 46 | 6.48 | < 0.001 |
| Comorbidities | ||||||||||
| DM | 4971 | 18.20 | 3527 | 17.80 | 0.264 | 8280 | 17.84 | 218 | 30.70 | < 0.001 |
| HTN | 4861 | 17.80 | 3309 | 16.70 | 0.002 | 7,986 | 17.21 | 184 | 25.92 | < 0.001 |
| Hyperlipidemia | 4151 | 15.20 | 2,952 | 14.90 | 0.368 | 6,946 | 14.96 | 157 | 22.11 | < 0.001 |
| MI | 2240 | 8.20 | 1585 | 8.00 | 0.427 | 3696 | 7.96 | 129 | 18.17 | < 0.001 |
| CVD | 2950 | 10.80 | 2,080 | 10.50 | 0.292 | 4924 | 10.61 | 106 | 14.93 | < 0.001 |
| COPD | 3387 | 12.40 | 2318 | 11.70 | 0.021 | 5590 | 12.04 | 115 | 16.20 | 0.001 |
| Pneumonia | 1420 | 5.20 | 951 | 4.80 | 0.052 | 2,305 | 4.97 | 66 | 9.30 | < 0.001 |
| Respiratory failure | 355 | 1.30 | 218 | 1.10 | 0.055 | 544 | 1.17 | 29 | 4.08 | < 0.001 |
| CKD | 2622 | 9.60 | 1605 | 8.10 | < 0.001 | 4,141 | 8.92 | 86 | 12.11 | 0.004 |
| Epilepsy | 273 | 1.00 | 159 | 0.80 | 0.028 | 421 | 0.91 | 11 | 1.55 | 0.106 |
| Season | 0.851 | 0.582 | ||||||||
| Spring | 6582 | 24.10 | 4795 | 24.20 | 11,216 | 24.16 | 161 | 22.68 | ||
| Summer | 6937 | 25.40 | 4991 | 25.19 | 11,756 | 25.33 | 172 | 24.23 | ||
| Autumn | 6633 | 24.29 | 4870 | 24.58 | 11,323 | 24.40 | 180 | 25.35 | ||
| Winter | 7159 | 26.21 | 5158 | 26.03 | 12,120 | 26.11 | 197 | 27.75 | ||
| Urbanization level | < 0.001 | 0.018 | ||||||||
| 1 (The highest) | 7034 | 25.76 | 5856 | 29.55 | 12,666 | 27.29 | 224 | 31.55 | ||
| 2 | 10,345 | 37.88 | 7857 | 39.65 | 17,929 | 38.63 | 273 | 38.45 | ||
| 3 | 9932 | 36.37 | 6,101 | 30.79 | 15,820 | 34.08 | 213 | 30.00 | ||
| Level of care | 0.625 | 0.004 | ||||||||
| Hospital center | 8248 | 30.20 | 5964 | 30.10 | 13,959 | 30.07 | 253 | 35.63 | ||
| Regional hospital | 9750 | 35.70 | 7011 | 35.38 | 16,518 | 35.59 | 243 | 34.23 | ||
| Local hospital | 9313 | 34.10 | 6839 | 34.52 | 15,938 | 34.34 | 214 | 30.14 | ||
| Sex | Prognosis | |||||||||
|
Male ( |
Female ( |
Survive ( |
Death ( | |||||||
| Mean | SD | Mean | SD |
| Mean | SD | Mean | SD |
| |
| Age (years) | 42.81 | 19.96 | 45.49 | 20.14 | < 0.001 | 43.97 | 20.10 | 42.16 | 18.35 | 0.017 |
| Crude OR | 95% CI | 95% CI |
| aOR | 95% CI | 95% CI |
| |
|---|---|---|---|---|---|---|---|---|
| RTI inpatient | ||||||||
| Driver of motor vehicle | Reference | Reference | ||||||
| Passenger in motor vehicle | 1.043 | 1.038 | 1.049 | 0.024 | 1.028 | 1.011 | 1.045 | 0.044 |
| Motorcyclist | 1.046 | 1.041 | 1.051 | 0.025 | 1.031 | 1.014 | 1.047 | 0.043 |
| Passenger on motorcycle | 1.104 | 1.096 | 1.112 | < 0.001 | 1.088 | 1.068 | 1.108 | 0.016 |
| Pedal cyclist | 1.160 | 1.154 | 1.165 | < 0.001 | 1.143 | 1.124 | 1.161 | < 0.001 |
| Pedestrian | 1.234 | 1.229 | 1.239 | < 0.001 | 1.216 | 1.197 | 1.234 | < 0.001 |
| Others | 0.920 | 0.909 | 0.931 | 0.004 | 0.906 | 0.885 | 0.928 | 0.014 |
| Gender | ||||||||
| Male | 1.076 | 1.074 | 1.077 | 0.012 | 1.060 | 1.046 | 1.073 | 0.027 |
| Female | Reference | Reference | ||||||
| Age groups (years) | ||||||||
| < 5 | Reference | Reference | ||||||
| 5–14 | 1.052 | 1.045 | 1.059 | 0.020 | 1.036 | 1.018 | 1.055 | 0.040 |
| 15–24 | 1.062 | 1.059 | 1.064 | 0.017 | 1.046 | 1.032 | 1.060 | 0.034 |
| 25–44 | 1.084 | 1.082 | 1.087 | 0.006 | 1.068 | 1.054 | 1.083 | 0.023 |
| 45–64 | 1.020 | 1.018 | 1.022 | 0.039 | 1.005 | 0.992 | 1.018 | 0.058 |
| ≧ 65 | 1.004 | 1.001 | 1.007 | 0.044 | 0.989 | 0.975 | 1.003 | 0.072 |
| Low‐income household | 1.419 | 1.409 | 1.429 | < 0.001 | 1.398 | 1.373 | 1.424 | < 0.001 |
| Catastrophic illness | 1.841 | 1.833 | 1.849 | < 0.001 | 1.814 | 1.786 | 1.842 | < 0.001 |
| Comorbidities | ||||||||
| DM | 2.014 | 2.011 | 2.017 | < 0.001 | 1.984 | 1.959 | 2.010 | < 0.001 |
| HTN | 1.668 | 1.665 | 1.671 | < 0.001 | 1.643 | 1.622 | 1.665 | < 0.001 |
| Hyperlipidemia | 1.600 | 1.596 | 1.603 | < 0.001 | 1.576 | 1.555 | 1.597 | < 0.001 |
| MI | 2.513 | 2.508 | 2.519 | < 0.001 | 2.476 | 2.443 | 2.510 | < 0.001 |
| CVD | 1.469 | 1.465 | 1.473 | < 0.001 | 1.447 | 1.427 | 1.468 | < 0.001 |
| COPD | 1.403 | 1.400 | 1.407 | < 0.001 | 1.382 | 1.364 | 1.402 | < 0.001 |
| Pneumonia | 1.934 | 1.928 | 1.941 | < 0.001 | 1.905 | 1.878 | 1.934 | < 0.001 |
| Respiratory failure | 3.460 | 3.442 | 3.478 | < 0.001 | 3.409 | 3.353 | 3.465 | < 0.001 |
| CKD | 1.399 | 1.394 | 1.403 | < 0.001 | 1.378 | 1.358 | 1.398 | < 0.001 |
| Epilepsy | 1.701 | 1.686 | 1.716 | < 0.001 | 1.676 | 1.642 | 1.710 | < 0.001 |
| Season | ||||||||
| Spring | Reference | Reference | ||||||
| Summer | 1.019 | 1.017 | 1.021 | 0.040 | 1.004 | 0.991 | 1.017 | 0.056 |
| Autumn | 1.106 | 1.103 | 1.108 | < 0.001 | 1.090 | 1.074 | 1.104 | 0.013 |
| Winter | 1.130 | 1.128 | 1.132 | < 0.001 | 1.113 | 1.099 | 1.128 | < 0.001 |
| Urbanization level | ||||||||
| 1 (The highest) | 1.308 | 1.306 | 1.310 | < 0.001 | 1.289 | 1.272 | 1.305 | < 0.001 |
| 2 | 1.129 | 1.127 | 1.131 | < 0.001 | 1.112 | 1.098 | 1.127 | 0.001 |
| 3 | Reference | Reference | ||||||
| Level of care | ||||||||
| Hospital center | 1.344 | 1.341 | 1.346 | < 0.001 | 1.324 | 1.306 | 1.341 | < 0.001 |
| Regional hospital | 1.094 | 1.092 | 1.096 | 0.003 | 1.078 | 1.064 | 1.092 | 0.018 |
| Local hospital | Reference | Reference |
| Baseline | Endpoint | |||||||||
|---|---|---|---|---|---|---|---|---|---|---|
| RTI inpatient |
With ( |
Without ( |
With ( |
Without ( | ||||||
|
| % |
| % |
|
| % |
| % |
| |
| Mental health illness | N/A | N/A | N/A | N/A | N/A | 6132 | 15.38 | 12,391 | 7.77 | < 0.001 |
| Sex | 0.999 | 0.999 | ||||||||
| Male | 23,106 | 57.95 | 92,424 | 57.95 | 23,106 | 57.95 | 92,424 | 57.95 | ||
| Female | 16,764 | 42.05 | 67,056 | 42.05 | 16,764 | 42.05 | 67,056 | 42.05 | ||
| Age groups (years) | 0.999 | < 0.001 | ||||||||
| < 5 | 176 | 0.44 | 704 | 0.44 | 164 | 0.41 | 683 | 0.43 | ||
| 5–14 | 1003 | 2.52 | 4,012 | 2.52 | 998 | 2.50 | 4001 | 2.51 | ||
| 15–24 | 8397 | 21.06 | 33,588 | 21.06 | 8372 | 21.00 | 33,517 | 21.02 | ||
| 25–44 | 11,034 | 27.67 | 44,136 | 27.67 | 11,025 | 27.65 | 40,126 | 25.16 | ||
| 45–64 | 12,131 | 30.43 | 48,524 | 30.43 | 12,121 | 30.40 | 48,302 | 30.29 | ||
| ≧ 65 | 7129 | 17.88 | 28,516 | 17.88 | 7190 | 18.03 | 32,851 | 20.60 | ||
| Low‐income household | 678 | 1.70 | 2,864 | 1.80 | 0.204 | 684 | 1.72 | 2871 | 1.80 | 0.262 |
| Catastrophic illness | 1445 | 3.62 | 5,102 | 3.20 | < 0.001 | 1456 | 3.65 | 5,122 | 3.21 | < 0.001 |
| Comorbidities | ||||||||||
| DM | 7188 | 18.03 | 28,111 | 17.63 | 0.060 | 7206 | 18.07 | 22,512 | 14.12 | < 0.001 |
| HTN | 6912 | 17.34 | 26,350 | 16.52 | < 0.001 | 6974 | 17.49 | 26,378 | 16.54 | < 0.001 |
| Hyperlipidemia | 6009 | 15.07 | 23,195 | 14.54 | 0.008 | 6012 | 15.08 | 23,202 | 14.55 | 0.002 |
| MI | 3236 | 8.12 | 12,702 | 7.96 | 0.318 | 3,245 | 8.14 | 12,771 | 8.01 | 0.389 |
| CVD | 4256 | 10.67 | 16,863 | 10.57 | 0.558 | 4298 | 10.78 | 16,878 | 10.58 | 0.254 |
| COPD | 4827 | 12.11 | 18,667 | 11.70 | 0.026 | 4903 | 12.30 | 18,704 | 11.73 | 0.002 |
| Pneumonia | 2003 | 5.02 | 7251 | 4.55 | < 0.001 | 2,015 | 5.05 | 7269 | 4.56 | < 0.001 |
| Respiratory failure | 485 | 1.22 | 1925 | 1.21 | 0.878 | 497 | 1.25 | 1930 | 1.21 | 0.557 |
| CKD | 3576 | 8.97 | 13,306 | 8.34 | < 0.001 | 3588 | 9.00 | 13,324 | 8.35 | < 0.001 |
| Epilepsy | 361 | 0.91 | 1420 | 0.89 | 0.766 | 365 | 0.92 | 1422 | 0.89 | 0.656 |
| Season | 0.999 | 0.009 | ||||||||
| Spring | 9626 | 24.14 | 38,504 | 24.14 | 9634 | 24.16 | 37,582 | 23.57 | ||
| Summer | 10,090 | 25.31 | 40,360 | 25.31 | 10,025 | 25.14 | 41,256 | 25.87 | ||
| Autumn | 9731 | 24.41 | 38,924 | 24.41 | 9786 | 24.54 | 38,971 | 24.44 | ||
| Winter | 10,423 | 26.14 | 41,692 | 26.14 | 10,425 | 26.15 | 41,671 | 26.13 | ||
| Urbanization level | 0.015 | 0.039 | ||||||||
| 1 (The highest) | 10,906 | 27.35 | 42,618 | 26.71 | 11,012 | 27.62 | 43,687 | 27.39 | ||
| 2 | 15,402 | 38.63 | 62,675 | 39.28 | 14,896 | 37.36 | 60,678 | 38.05 | ||
| 3 | 13,562 | 34.02 | 54,248 | 34.00 | 13,962 | 35.02 | 55,115 | 34.56 | ||
| Level of care | < 0.001 | < 0.001 | ||||||||
| Hospital center | 12,024 | 30.16 | 50,025 | 31.37 | 12,135 | 30.44 | 49,983 | 31.34 | ||
| Regional hospital | 14,181 | 35.57 | 57,711 | 36.19 | 14,106 | 35.38 | 56,371 | 35.35 | ||
| Local hospital | 13,665 | 34.27 | 51,744 | 32.45 | 13,629 | 34.18 | 53,126 | 33.31 | ||
| Baseline | Endpoint | |||||||||
| RTI inpatient |
With ( |
Without ( |
With ( |
Without ( | ||||||
| Mean | SD | Mean | SD |
| Mean | SD | Mean | SD |
| |
| Age (years) | 41.15 | 15.29 | 41.16 | 15.32 | 0.907 | 46.85 | 20.27 | 47.91 | 21.19 | < 0.001 |
| Crude HR | 95% CI | 95% CI |
| aHR | 95% CI | 95% CI |
| |
|---|---|---|---|---|---|---|---|---|
| RTI inpatient | 2.777 | 1.987 | 3.816 | < 0.001 | 2.204 | 1.663 | 2.785 | < 0.001 |
| Gender | ||||||||
| Male | 1.845 | 1.172 | 2.701 | < 0.001 | 1.465 | 1.024 | 1.972 | 0.038 |
| Female | Reference | Reference | ||||||
| Age groups (years) | ||||||||
| < 5 | 0.000 | — | — | 0.999 | 0.000 | — | — | 0.999 |
| 5–14 | Reference | Reference | ||||||
| 15–24 | 1.621 | 1.099 | 1.967 | 0.001 | 1.297 | 1.020 | 1.435 | 0.040 |
| 25–44 | 1.648 | 1.297 | 2.195 | < 0.001 | 1.303 | 1.124 | 1.597 | < 0.001 |
| 45–64 | 1.970 | 1.384 | 2.444 | < 0.001 | 1.567 | 1.205 | 1.787 | < 0.001 |
| ≧ 65 | 2.293 | 1.542 | 2.876 | < 0.001 | 1.825 | 1.345 | 2.101 | < 0.001 |
| Low‐income household @ | 1.637 | 1.188 | 2.162 | < 0.001 | 1.301 | 1.036 | 1.579 | 0.032 |
| Catastrophic illness @ | 3.456 | 2.287 | 4.452 | < 0.001 | 2.650 | 1.989 | 3.256 | |
| Comorbidities @ | ||||||||
| DM | 2.106 | 1.495 | 2.578 | < 0.001 | 1.672 | 1.303 | 1.882 | < 0.001 |
| HTN | 1.995 | 1.452 | 2.463 | < 0.001 | 1.586 | 1.264 | 1.789 | < 0.001 |
| Hyperlipidemia | 2.274 | 1.610 | 2.731 | < 0.001 | 1.808 | 1.403 | 1.997 | < 0.001 |
| MI | 1.501 | 1.001 | 2.059 | 0.049 | 1.203 | 0.876 | 1.503 | 0.128 |
| CVD | 1.956 | 1.183 | 2.712 | < 0.001 | 1.555 | 1.035 | 1.978 | 0.033 |
| COPD | 2.103 | 1.412 | 2.730 | < 0.001 | 1.672 | 1.235 | 1.989 | < 0.001 |
| Pneumonia | 1.706 | 1.201 | 2.175 | < 0.001 | 1.356 | 1.060 | 1.588 | 0.020 |
| Respiratory failure | 1.124 | 0.725 | 1.860 | 0.277 | 0.896 | 0.571 | 1.265 | 0.426 |
| CKD | 2.672 | 1.894 | 3.101 | < 0.001 | 2.506 | 1.865 | 2.970 | < 0.001 |
| Epilepsy | 4.297 | 2.584 | 5.556 | < 0.001 | 3.359 | 2.265 | 4.054 | < 0.001 |
| Season | ||||||||
| Spring | Reference | Reference | ||||||
| Summer | 1.393 | 0.789 | 2.437 | 0.207 | 1.106 | 0.686 | 1.780 | 0.324 |
| Autumn | 2.462 | 1.578 | 3.397 | < 0.001 | 1.933 | 1.372 | 2.476 | < 0.001 |
| Winter | 2.125 | 1.189 | 3.104 | < 0.001 | 1.678 | 1.034 | 2.265 | 0.033 |
| Urbanization level | ||||||||
| 1 (The highest) | 2.450 | 1.789 | 2.904 | < 0.001 | 1.835 | 1.405 | 2.056 | < 0.001 |
| 2 | 1.825 | 1.457 | 2.291 | < 0.001 | 1.462 | 1.265 | 1.673 | < 0.001 |
| 3 | Reference | Reference | ||||||
| Level of care | ||||||||
| Hospital center | 3.326 | 2.678 | 4.083 | < 0.001 | 2.661 | 2.320 | 2.974 | < 0.001 |
| Regional hospital | 2.876 | 2.230 | 3.462 | < 0.001 | 2.350 | 1.878 | 2.526 | < 0.001 |
| Local hospital | Reference | Reference |
- —Tri‐Service General Hospital Research Foundation
- —Board of Tri‐Service General Hospital
- —National defense Medical Center
Peer Reviews
No public reviews on file for this paper yet. If you reviewed it on a platform where reviews are public (OpenReview, ICLR, NeurIPS, ICML), you can paste yours below so the community can read it here.
Videos
No videos yet. Explain this paper in a talk, walkthrough, or lecture? Add one.
Taxonomy
TopicsTraffic and Road Safety · Older Adults Driving Studies · Trauma and Emergency Care Studies
Introduction
1
Road traffic injuries (RTIs) represent a critical global health challenge, accounting for substantial morbidity, mortality, and long‐term disability. These incidents encompass diverse injury patterns ranging from traumatic brain and spinal cord injuries to complex polytrauma involving fractures and internal organ damage. The World Health Organization's 2023 report highlights the alarming scale of this issue, with road traffic accidents claiming approximately 1.19 million lives annually. Liu et al. (2022) analyzed mortality causes in 5–19‐year‐olds from 2000 to 2019 and confirmed RTIs as the leading cause globally in the 5–19 range, particularly in strong males.
While the physical consequences of motor vehicle accidents have been well‐documented, the psychological impact on survivors remains insufficiently explored. Current research has predominantly focused on mental health outcomes following specific neurological injuries, particularly traumatic brain and spinal cord injuries, creating a significant knowledge gap regarding the broader population of motor vehicle accident survivors.
To address this gap, we conducted a nationwide cohort study utilizing Taiwan's National Health Insurance Research Database (NHIRD). Our investigation specifically examines the risk of mental health disorders among patients hospitalized following motor vehicle collisions, providing comprehensive population‐level evidence on this understudied aspect of post‐accident care.
Methods
2
Data Source
2.1
We conducted a retrospective cohort study using Taiwan's Longitudinal Health Insurance Database (LHID), a nationally representative subset of the National Health Insurance Research Database (NHIRD). Our analysis spanned 15 years (2000–2015) and included both inpatient and outpatient records to examine mental health outcomes following hospitalization for motor vehicle accidents.
Taiwan's compulsory National Health Insurance (NHI) program, implemented in 1995, achieved near‐universal coverage by 2009, enrolling 97% of healthcare providers and 99% of the population (23 million residents). The database employs ICD‐9‐CM codes (Chinese Hospital Association, 2000) for disease classification, with psychiatric diagnoses including mood disorders, anxiety disorders, post‐traumatic stress disorder (PTSD), substance use disorders, and psychotic disorders confirmed by board‐certified psychiatrists or neurologists.
The NHI Administration ensures data quality through random audits (1% of outpatient and 5% of inpatient records), with multiple validation studies confirming diagnostic accuracy.
Study Design and Sampled Participants
2.2
Study Design
2.2.1
This study was of a retrospective matched‐cohort design.
Sample
2.2.2
This retrospective cohort study identified patients hospitalized for road traffic injuries (RTIs) between January 1, 2000, and December 31, 2015, through ICD‐9‐CM diagnostic codes (E810‐E819), including all relevant subcategories for different accident types and involved parties. The specific code definitions are detailed in Supplementary Table S1. The analysis was restricted to patients requiring at least 24 h of hospitalization and excluded those with documented injuries prior to 2000, pre‐existing mental health conditions, missing follow‐up data, or unspecified gender. From an initial pool of 19,936,512 eligible patients, we identified 47,161 RTI cases who were then matched with 18,893,351 control patients (1:400 ratio) hospitalized for non‐RTI reasons using propensity scores that accounted for demographic characteristics (age, sex, income), clinical factors (comorbidity profile), healthcare system variables (hospital accreditation level), and environmental determinants (urbanization level of residence, admission season) (Figure 1).
Kaplan–Meier survival curves for RTI inpatients and matched non‐RTI controls.
Covariates
2.2.3
The analysis adjusted for multiple potential confounding variables across several domains. Demographic covariates included sex, age group (< 5, 5–14, 15–24, 25–44, 45–64, and ≥ 65 years), and monthly income categorized into three levels (< 18,000, 18,000‐34,999, and ≥ 35,000 NTD). Clinical factors comprised hospitalization outcome (survival or death) and presence of comorbidities. Healthcare system variables included hospital accreditation level as determined by the Taiwan Joint Commission on Hospital Accreditation, which evaluates institutions based on size, facilities, staff qualifications, and service scope. Geographic characteristics were accounted for through urbanization levels (Liu et al., 2022, 1–4) of patients' residential areas, classified according to population size and socioeconomic indicators. Specifically, level 1 represented major metropolitan centers with populations exceeding 1.25 million and significant political‐economic importance; level 2 included regional cities (500,000–1,249,999 inhabitants); while levels 3 and 4 encompassed midsize towns (150,000–499,999) and rural areas (< 150,000), respectively. Seasonal variations were controlled for through inclusion of hospitalization season in the analysis.
Comorbidities
2.2.4
Baseline comorbidities were identified using ICD‐9‐CM codes and included the presence of catastrophic illness as defined by the Ministry of Health and Welfare, as well as specific conditions such as diabetes mellitus (ICD‐9‐CM code 250), hypertension (codes 401–405), hyperlipidemia (code 272), myocardial infarction (codes 410 and 412), and cardiovascular disease (codes 480–489). Additional comorbidities included chronic obstructive pulmonary disease (COPD; codes 490–496), pneumonia (codes 480–488 and 507), respiratory failure (code 518.8), kidney disease (codes 580–589), and epilepsy (codes 345 and 780.3).
These comorbidities were chosen because they are prevalent in the Taiwanese population, have well‐defined and reliable ICD‐9‐CM coding within the NHIRD, and are recognized priorities in Taiwan's public health policy. Including them as baseline covariates allowed for appropriate adjustment of potential confounding effects, thereby isolating the association between RTI–related hospitalization and subsequent mental health outcomes.
Outcome Measures
2.2.5
Participants were prospectively followed from their index hospitalization date until the first occurrence of any mental health diagnosis, with outcomes ascertained through comprehensive psychiatric evaluations. Mental health disorders (for definitions, see Supplementary Table S1) were identified using standardized ICD‐9‐CM codes and required either at least three outpatient or emergency department visits with consistent diagnoses from board‐certified psychiatrists or neurologists or any psychiatric hospitalization. The assessed conditions included mood disorders (depression [296.2–296.3, 300.4, 311], bipolar disorder [296.0, 296.4–296.8]), anxiety disorders (300), trauma‐related disorders (acute stress disorder [308] and post‐traumatic stress disorder [309.81]), substance use disorders (291–292, 303–305), psychotic disorders (schizophrenia [295]), neurocognitive disorders (dementia [290, 331.0]), and other behavioral conditions (sleep disorders [307.4, 780.5], personality disorders [301], and behavioral disorders [312]).
Data Analysis
2.3
All analyses were performed using IBM SPSS Statistics (version 22.0; IBM Corp., Armonk, NY). Baseline characteristics were compared using *χ^2^
- tests for categorical variables and independent t‐tests for continuous measures. The primary analysis employed multivariate Cox proportional hazards regression to estimate injury risk, with results reported as adjusted hazard ratios (aHRs) and 95% confidence intervals. Survival analysis was conducted using Kaplan–Meier curves with log‐rank testing to compare cumulative incidence between groups. All tests were two‐tailed, with statistical significance set at α = 0.05.
We also performed sensitivity analyses to test the robustness of our findings, which included analysis by mental health illness subtype, exclusion of events occurring within the first year of follow‐up, and exclusion of events occurring within the first five years of follow‐up. The results of these analyses are presented in Supplementary Table S6.
Results
3
Sample Characteristics
3.1
The study cohort comprised 47,125 patients hospitalized for road traffic injuries (RTIs), with a predominance of male participants (57.95%, n = 27,311). Age distribution analysis revealed the largest proportion of cases occurred among middle‐aged adults (45–64 years: n = 14,339; 30.43%), followed by young adults (25–44 years: n = 13,042; 27.68%). Younger age groups accounted for progressively smaller proportions (15–24 years: 21.06%; 5–14 years: 2.52%; < 5 years: 0.44%), with elderly patients (≥ 65 years) representing 17.88% of cases. The overall mean age was 43.94 years (SD = 20.08). Propensity score matching successfully balanced baseline characteristics between RTI cases and controls, with no significant differences observed in sex distribution, injury patterns, hospitalization outcomes, age stratification, comorbidity profiles (including catastrophic illness, hypertension, COPD, renal disease, and epilepsy), or residential urbanization levels (Table 1). As detailed in Supplementary Table S2, the median follow‐up time for the entire cohort was 6.91 years, with no significant difference between groups (p = 0.346). Despite similar follow‐up, the median time to a mental health diagnosis was significantly shorter for RTI inpatients (5.83 years) compared to controls (6.14 years, p < 0.001).
Kaplan–Meier Model for the Cumulative Risk of Mental Health Issues
3.2
Kaplan–Meier survival analysis demonstrated significantly different cumulative incidence curves for mental health disorders between RTI patients and matched controls throughout the 15‐year follow‐up period (log‐rank test: p < 0.001). The divergence in mental health risk trajectories was evident early in follow‐up and persisted over time (Table 2, Figure 2). Moreover, the year‐by‐year cumulative number of events for both groups is detailed in Supplementary Table S3.
Participant selection and propensity score matching flowchart.
Comparisons of the Prevalence of Mental Health Issues
3.3
The longitudinal analysis revealed a substantially higher burden of mental health conditions among RTI survivors compared to controls. At the end of follow‐up, 13.01% (n = 6,132/47,161) of the RTI cohort had received mental health diagnoses, versus only 1.15% (n = 12,391/1,076,911) in the control population (p < 0.001). This elevated risk persisted consistently across all demographic and clinical strata, including sex, age groups, income levels, seasonal periods, comorbidity status, residential urbanization levels, and hospital accreditation categories (all subgroup p‐values <0.001; Table 3; Figure 3). Detailed data are presented in Supplementary Table S4.
Forest plot of sensitivity analyses for mental health outcomes.
Hazard Ratios Analysis of Developing Mental Health Illness After Hospitalization due to RTI
3.4
In the Cox proportional hazards regression analysis, after adjusting for sex, age, monthly income, season, comorbidities, urbanization level of residence, and hospital accreditation level, patients hospitalized due to RTIs had a significantly higher risk of developing mental health conditions compared to controls, with an adjusted hazard ratio (HR) of 2.204 (95% CI: 1.663–2.785, p < 0.001).
We further analyzed the risk according to the type of road user involved in the crash (Supplementary Table S5). Compared to the control group, all specific types of road users—including drivers of motor vehicles, passengers, motorcyclists, pedal cyclists, and pedestrians—exhibited a significantly elevated risk of mental health disorders (aHR ranging from 2.18 to 2.45, all p < .001). Among these, pedestrians were at the highest risk (aHR = 2.45, 95% CI: 1.84–3.01). The risk for the group categorized as “Other” was also significantly increased, albeit to a lesser magnitude.
When mental health conditions were analyzed by type, patients in the RTI group exhibited significantly elevated risks for anxiety, depression, bipolar disorder, sleep disorders, acute stress disorder/post‐traumatic stress disorder (PTSD), substance use disorders, dementia, schizophrenia, personality disorders, and behavioral disorders compared to the control group (Table 4; Figure 4).
Subgroup analysis of the association between RTI and mental health outcomes.
Discussion
4
Association Between RTIs Caused Hospitalization and the Risk of Mental Health Illness
4.1
This study found that patients hospitalized for RTIs faced a significantly higher risk of developing mental health disorders compared to matched controls. After adjusting for demographic, socioeconomic, and clinical confounders, the risk was more than doubled (adjusted HR = 2.20, 95% CI: 1.66–2.79, p < 0.001). The Kaplan–Meier analysis confirmed this association, with a clear divergence in cumulative incidence over the 15‐year follow‐up (log‐rank p < 0.001).
The increased risk spanned multiple psychiatric conditions, including PTSD, depression, anxiety, substance use disorders, and psychotic disorders. These findings highlight the need for early mental health screening and long‐term monitoring in RTI survivors to address both immediate and delayed psychological consequences (Figure 5).
Subgroup analysis by type of road traffic injury.
Association Between Relationship of RTIs Caused Hospitalization and the Risk of Mental Health Illness
4.2
Previous studies have identified depression, anxiety disorders (including phobias), and post‐traumatic stress symptoms as common psychological sequelae following traffic‐related injuries (Yu et al. 2025; Bryant et al. 2010; Grant et al. 2008; Kenardy et al. 2018). Reported prevalence rates of mental health disorders post‐injury vary widely, with some research indicating rates between 30% and 50% (Bryant et al. 2010; Guest et al. 2018; Kenardy et al. 2018; Mayou and Bryant 2001). Without timely treatment, these symptoms may evolve into more serious psychiatric conditions such as major depressive disorder (MDD), PTSD, panic disorder, and generalized anxiety disorder (Grant et al. 2008; Kenardy et al. 2018). Moreover, affected individuals are at increased risk of developing behavioral issues, including aggression and substance abuse (Beck and Coffey 2007; deRoon‐Cassini et al. 2010). Notably, motor vehicle crashes have been linked with current major depressive episodes and alcohol misuse, particularly among younger and older adolescent populations (Williams et al. 2015). In line with these findings, a recent review highlighted that psychological consequences after road traffic injuries can persist long term, with heterogeneous recovery trajectories and significant risks of anxiety, depression, and PTSD. Additionally, some studies emphasize that the overall cost of care—including medical treatment and rehabilitation—may nearly double when psychological distress is factored in (Chan et al. 2003).
These findings highlight the importance of early mental health screening and intervention in individuals recovering from traffic injuries.
Possible Mechanisms for the Increased Risk of Mental Health Illness Injuries in Adults With Hospitalization due to RTI
4.3
The increased risk of mental health disorders observed among adults hospitalized for RTIs likely arises from a complex interplay of multiple pathogenic mechanisms. The immediate psychological impact of traumatic collisions may overwhelm normal stress response systems, creating a vulnerable state for developing persistent psychiatric conditions. Many patients experience profound distress during the accident itself, with intrusive memories and heightened arousal potentially laying the foundation for PTSD. The subsequent physical recovery period often introduces additional risk factors, including chronic pain, restricted mobility, and prolonged dependence on analgesics, all of which are independently associated with mood disturbances. Furthermore, the disruption to daily life during hospitalization and rehabilitation can significantly alter social dynamics and occupational functioning, potentially leading to financial strain, role changes within families, and reduced social support—factors known to exacerbate psychological distress. At the biological level, the substantial physiological stress of severe injury may dysregulate neuroendocrine systems, particularly the hypothalamic‐pituitary‐adrenal axis, creating lasting alterations in stress response and emotional regulation. This combination of acute trauma, ongoing physical challenges, social consequences, and biological changes appears to create a perfect storm for the development of diverse mental health conditions following serious motor vehicle accidents.
Limitation
4.4
Several limitations of this study should be noted. First, the dataset did not include information on participants’ previous psychiatric history or family history of mental illness, both of which are significant risk factors that could potentially confound the observed relationships. Second, although the use of a national health insurance database enabled a large sample size with broad coverage, the data were limited to administrative and diagnostic codes. As a result, detailed contextual factors surrounding the RTIs—such as involvement of alcohol or drug use, driver fatigue, or other risky behaviors—could not be assessed. Third, the findings may not be generalizable beyond the Taiwanese population and healthcare system, as cultural attitudes, healthcare access, and mental illness prevalence vary widely between countries. In particular, baseline rates and detection of psychiatric disorders differ internationally, limiting the applicability of these results elsewhere. Finally, the relatively short follow‐up period may have hindered identification of delayed‐onset psychiatric conditions, including chronic PTSD or major depressive disorder, which can manifest months or even years post‐injury. Thus, further longitudinal research is necessary to fully understand the long‐term mental health impact of motor vehicle trauma.
Implications for Trauma Care as Mental Health Screening and Early Intervention
4.5
The present findings suggest that hospitalization for RTIs substantially increases the risk of subsequent mental health disorders. Incorporating standardized mental health screening at the time of admission and during follow‐up could enable early identification of patients at risk for mental health illness. Trauma services may also benefit from embedding multidisciplinary teams, including psychiatrists, psychologists, and social workers, to provide timely psychological support alongside physical rehabilitation. Early intervention—such as psychoeducation, brief cognitive‐behavioral therapy, or referral—may mitigate long‐term psychiatric morbidity and reduce the overall burden on healthcare systems. From a policy perspective, developing structured care pathways that mandate psychological assessment after severe RTIs could facilitate more holistic recovery and decrease healthcare expenditures associated with untreated psychiatric sequelae. Future research should evaluate the cost‐effectiveness and feasibility of such integrated models in different healthcare settings.
Conclusion
5
This study provides robust evidence linking hospitalization for road traffic injuries (RTIs) to an increased long‐term risk of developing a wide spectrum of mental health disorders. Across a large, nationwide cohort and a 15‐year follow‐up, RTI survivors consistently demonstrated significantly higher rates of psychiatric diagnoses compared to matched controls, with the divergence in risk evident early and persisting throughout the observation period. Adjusted analyses further confirmed that hospitalization due to RTIs was independently associated with a more than twofold higher hazard of subsequent mental illness, spanning common conditions such as anxiety and depression, as well as severe disorders including schizophrenia, bipolar disorder, and dementia. These findings highlight the enduring psychological burden that follows severe traffic‐related injuries and underscore the importance of incorporating systematic mental health assessments and targeted interventions into post‐injury care and rehabilitation programs. Future longitudinal and prospective studies are warranted to clarify underlying causal pathways, identify vulnerable subgroups, and evaluate preventative and therapeutic strategies aimed at mitigating the long‐term psychiatric sequelae of RTIs.
Author Contributions
Conceptualization: Yu‐An Chen, Wu‐Chien Chien, and Chi‐Hsiang Chung. Methodology: Yu‐An Chen, Wu‐Chien Chien, and Chi‐Hsiang Chung. Software: Chi‐Hsiang Chung. Data curation: Wu‐Chien Chien and Chi‐Hsiang Chung. Investigation: Wu‐Chien Chien, Li‑Yun Fann, Ying‐Che Huang, Tsu‐Hsuan Weng, and Chun‐Teng Tsai. Validation: Wu‐Chien Chien, Li‑Yun Fann, Ying‐Che Huang, Tsu‐Hsuan Weng, and Chun‐Teng Tsai. Formal analysis: Chi‐Hsiang Chung. Supervision: Wu‐Chien Chien, Li‑Yun Fann, Ying‐Che Huang, Chi‐Hsiang Chung, Tsu‐Hsuan Weng, Chun‐Teng Tsai. Funding acquisition: Wu‐Chien Chien. Visualization: Chi‐Hsiang Chung. Project administration: Wu‐Chien Chien, Li‑Yun Fann, Ying‐Che Huang, Chi‐Hsiang Chung, Tsu‐Hsuan Weng, Chun‐Teng Tsai. Resources: Wu‐Chien Chien, Chi‐Hsiang Chung. Writing—original draft: Yu‐An Chen. Writing—review & editing: Yu‐An Chen.
Funding
This study was supported by the Tri‐Service General Hospital Research Foundation(TSGH‐B‐114022; TSGH‐A‐114010; TSGH‐D‐114196), and the sponsor has no role in a study design, data collection and analysis, decision to publish, or preparation of the manuscript. The study was approved by the Ethucs Review Board of Tri‐Service General Hospital, National defense Medical Center(TSGHIRB, No. E202516024)
Conflicts of Interest
The authors declare no conflicts of interest.
Supporting information
Table S1 ICD‐9‐CM and definition
Table S2 Years of follow‐up and time to events
Table S3 Kaplan–Meier for cumulative mental health illness stratified by RTI inpatient with log‐rank test
Table S4 Factors of mental health illness stratified by variables listed in the table by using Cox regression and Bonferroni correction for multiple comparisons
Table S5 Factors of mental health illness among different RTI inpatients by using Cox regression and Bonferroni correction for multiple comparisons
Table S6 Sensitivity analysis for factors of mental health illness subgroups by using Cox regression and Bonferroni correction for multiple comparisons
The reference list from the paper itself. Each links out to its DOI / PubMed record.
- 1Beck, J. G. , and S. F. Coffey . 2007. “Assessment and Treatment of PTSD After a Motor Vehicle Collision: Empirical Findings and Clinical Observations.” Professional Psychology: Research and Practice 38, no. 6: 629–639. 10.1037/0735-7028.38.6.629.18509507 PMC 2396820 · doi ↗ · pubmed ↗
- 2Bryant, R. A. , M. L. O'Donnell , M. Creamer , A. C. Mc Farlane , C. R. Clark , and D. Silove . 2010. “The Psychiatric Sequelae of Traumatic Injury.” The American Journal of Psychiatry 167, no. 3: 312–320. 10.1176/appi.ajp.2009.09050617.20048022 · doi ↗ · pubmed ↗
- 3Chan, A. O. M. , T. M. Air , and A. C. Mc Farlane . 2003. “Posttraumatic Stress Disorder and Its Impact on the Economic and Health Costs of Motor Vehicle Accidents in South Australia.” The Journal of Clinical Psychiatry 64, no. 2: 175–181. 10.4088/jcp.v 64n 0210.12633126 · doi ↗ · pubmed ↗
- 4Copanitsanou, P. , E. Drakoutos , and V. Kechagias . 2021. “Posttraumatic Stress, Depressive Emotions, and Satisfaction With Life After a Road Traffic Accident.” Journal of Loss and Trauma 26, no. 8: 668–678. 10.1097/NOR.0000000000000417.29369134 · doi ↗ · pubmed ↗
- 5de Roon‐Cassini, T. A. , A. D. Mancini , M. D. Rusch , and G. A. Bonanno . 2010. “Psychopathology and Resilience Following Traumatic Injury: A Latent Growth Mixture Model Analysis.” Rehabilitation Psychology 55, no. 1: 1–11. 10.1037/a 0018601.20175629 · doi ↗ · pubmed ↗
- 6Grant, D. M. , J. G. Beck , L. Marques , S. A. Palyo , and J. D. Clapp . 2008. “The Structure of Distress Following Trauma: Post‐traumatic Stress Disorder, Major Depressive Disorder, and Generalized Anxiety Disorder.” Journal of Abnormal Psychology 117, no. 3: 662–672. 10.1037/a 0012591.18729617 · doi ↗ · pubmed ↗
- 7Guest, R. , Y. Tran , B. Gopinath , I. D. Cameron , and A. Craig . 2018. “Prevalence and Psychometric Screening for the Detection of Major Depressive Disorder and Post‐traumatic Stress Disorder in Adults Injured in a Motor Vehicle Crash Who Are Engaged in Compensation.” BMC Psychology 6, no. 1: 1–11. 10.1186/s 40359-018-0216-5.29467035 PMC 5822643 · doi ↗ · pubmed ↗
- 8Kenardy, J. , S. L. Edmed , S. Shourie , et al. 2018. “Changing Patterns in the Prevalence of Posttraumatic Stress Disorder, Major Depressive Episode and Generalized Anxiety Disorder Over 24 Months Following a Road Traffic Crash: Results From the UQ Su PPORT Study.” Journal of Affective Disorders 234: 172–179. 10.1016/j.jad.2018.04.090.29738952 · doi ↗ · pubmed ↗