The impact of the COVID-19 pandemic on the rate of maternal postnatal healthcare examinations in England: an OpenSAFELY interrupted time series analysis providing evidence of disparity in care access
Dexter J. L. Hayes, Andrea L. Schaffer, Amir Mehrkar, Sebastian C. J. Bacon, Ben Goldacre, Brian MacKenna, Alexander E. P. Heazell, Tjeerd van Staa, Victoria Palin

TL;DR
The study found that the COVID-19 pandemic reduced the rate of postnatal healthcare exams in England, with disparities linked to ethnicity, region, and socioeconomic deprivation.
Contribution
This study provides evidence of pandemic-related disparities in postnatal care access using a large-scale EHR dataset and interrupted time-series analysis.
Findings
Postnatal examination rates dropped by 24.1% during the first national lockdown and recovered only partially by 2023.
Ethnic minorities, deprived regions, and specific NHS areas had significantly lower odds of receiving timely postnatal care.
Despite recovery, most postnatal exams still occurred outside the recommended 6-8 week window.
Abstract
Clinical guidance in England currently recommends that women undergo a postnatal health and wellbeing examination with a general practitioner 6-8 weeks after giving birth. The current study aimed to describe the impact of the COVID-19 pandemic on the rate of maternal postnatal examinations in England over time and its predictors, including socioeconomic deprivation and ethnicity. With the approval of NHS England, the OpenSAFELY platform was used to access the TPP SystmOne electronic health record (EHR) system for primary care. All records for registered female patients aged 14 to 49 years with a recorded birth coded between January 2019 and August 2023. Monthly rates of postnatal examinations were estimated based on the number of patients with a postnatal-related code within 6, 8 or 12 weeks of birth. Interrupted time-series analysis modelled the impact of the COVID-19 pandemic on the…
Genes, proteins, chemicals, diseases, species, mutations and cell lines named across the full text — each resolved to its canonical identifier and authoritative record.
Click any figure to enlarge with its caption.
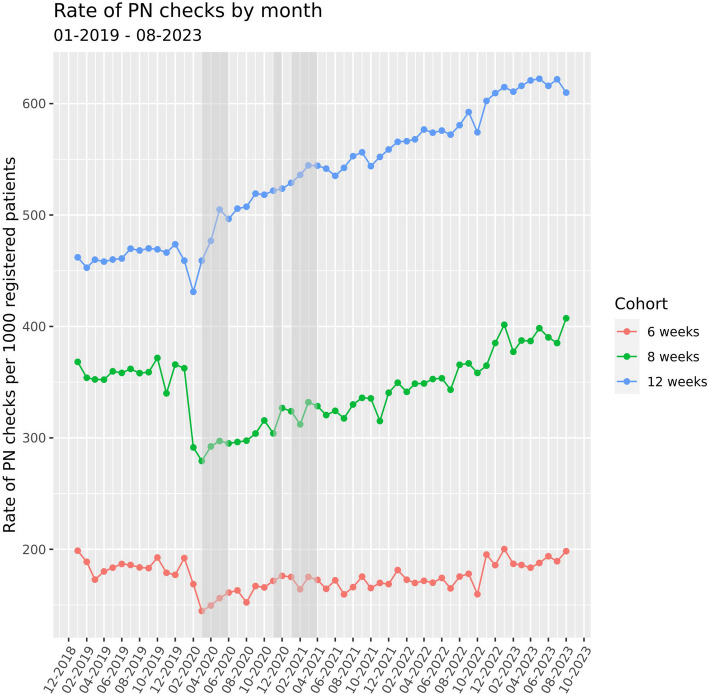 Figure 1
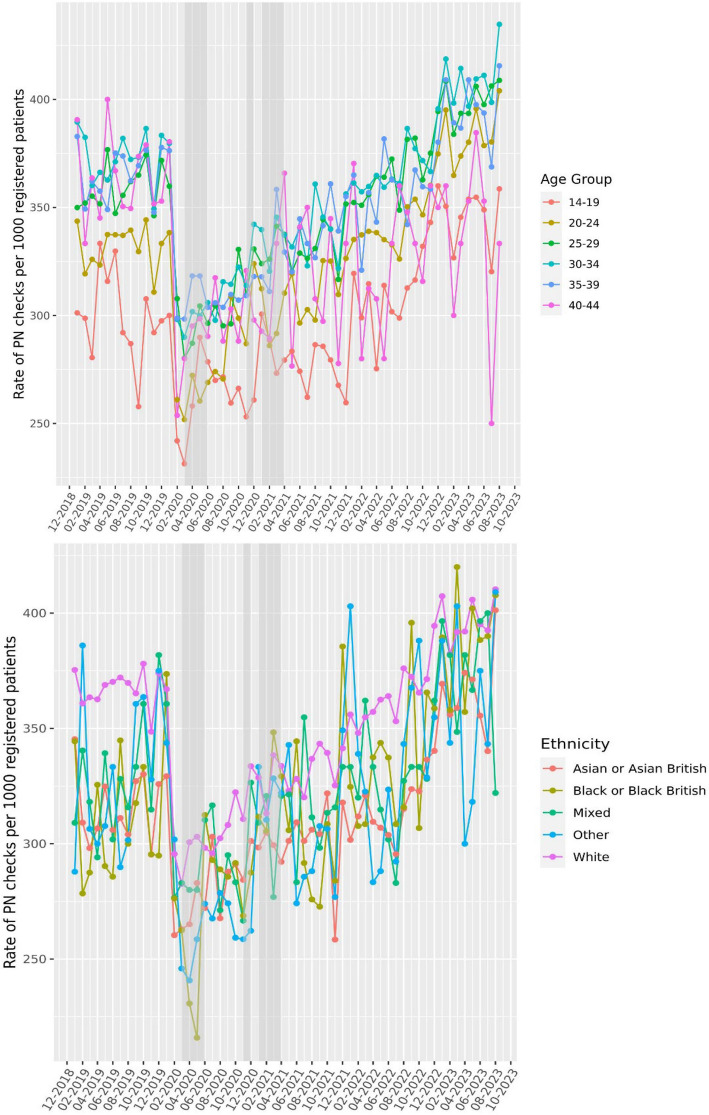 Figure 2
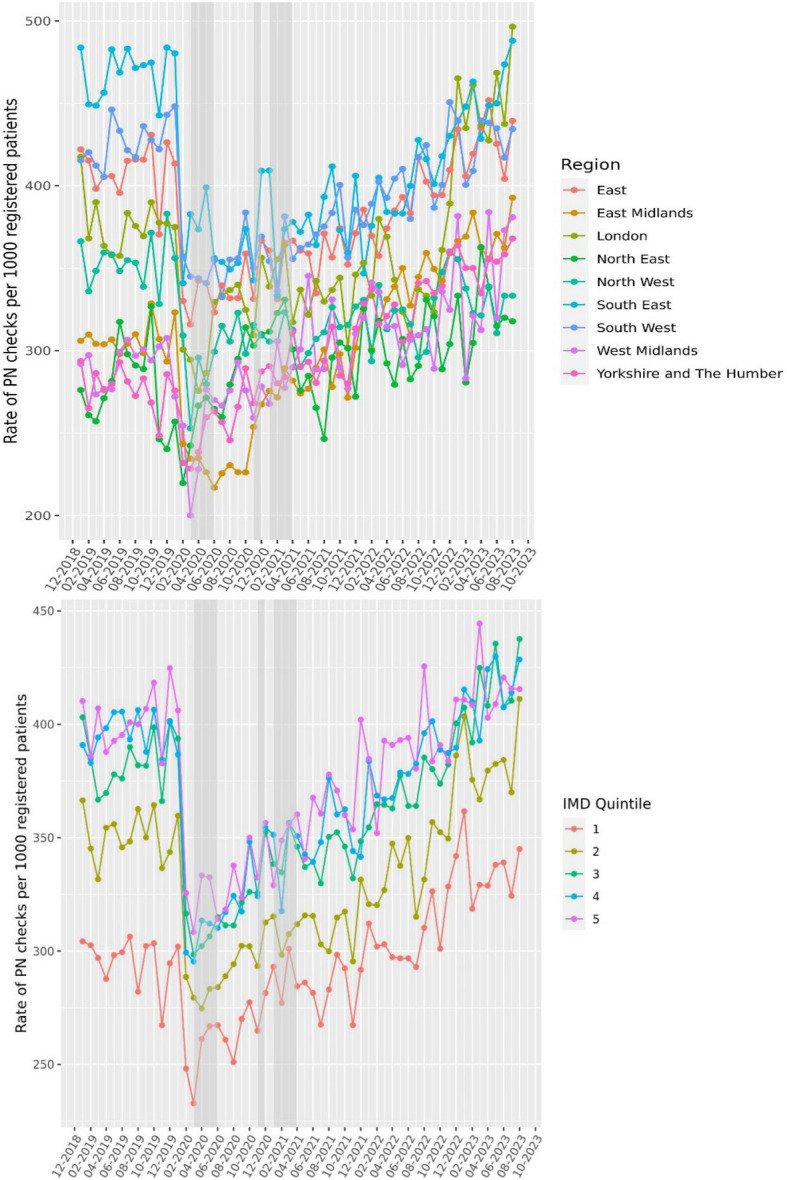 Figure 3
- —https://doi.org/10.13039/501100000306Tommy's Baby Charity
Peer Reviews
No public reviews on file for this paper yet. If you reviewed it on a platform where reviews are public (OpenReview, ICLR, NeurIPS, ICML), you can paste yours below so the community can read it here.
Videos
No videos yet. Explain this paper in a talk, walkthrough, or lecture? Add one.
Taxonomy
TopicsCOVID-19 Impact on Reproduction · Healthcare Systems and Challenges · COVID-19 and healthcare impacts
Background
In England, the National Health Service (NHS) provides free healthcare, with midwives assessing mother and baby usually at least once within 36 h of birth and again at days 5 and 10, health visitors reviewing the baby’s health around days 7–14 and a postnatal assessment with a general practitioner (GP) (also known as a family doctor) at 6-8 weeks [1]. Recognising that a high quality postnatal maternal examination can impact both the short- and long-term health of mothers, the National Institute for Health and Care Excellence (NICE) recommends that this examination takes place 6-8 weeks after birth, as a separate appointment from the initial GP baby check and first vaccination appointments [2, 3]. This examination became a contractual requirement following an amendment to the GP contract in England, February 2020 [4].
The maternal postnatal examination should focus on recovery from birth, including both physical and mental wellbeing, and address any concerns, symptoms or signs of postnatal complications. The examination should also cover pregnancy-related conditions that may require ongoing care, identification of pelvic health issues, family planning and contraception [2, 5]. In addition to addressing immediate health risks, these appointments provide an opportunity to educate women on long-term risks (e.g. the risk of developing type 2 diabetes following gestational diabetes) and offer lifestyle interventions or additional clinical management to help minimise them.
A recent study examined the delivery of postnatal appointments in the UK, using data on approximately 34,300 births from the Clinical Practice Research Datalink between July 2015 and June 2018 [6]. Of these women, 62% had evidence of a face-to-face consultation indicating a structured postnatal review with a GP within 12 weeks of giving birth and just 40% of women had a structured review within the recommended 6–8 weeks. A further 27% had a record of one or more unclassified consultations. Women who experienced a preterm birth, were younger and registered at a practice in the most deprived areas were more likely to have a late, or no postnatal examination; this suggests that certain high-risk groups may not receive adequate postpartum care.
At the time of conducting our current study, there was little evidence of the impact of the COVID-19 pandemic on maternal healthcare interactions, particularly those occurring postnatally. In the beginning of the pandemic, advice from the NHS and UK government was not to go to GP surgeries, pharmacies, or hospital [7]. Guidance around COVID-19 and pregnancy at this time was uncertain due to a lack of evidence; further to this, reluctance to visit healthcare settings due to concerns about catching coronavirus was especially high in people who were pregnant [8]. From March 2020, a large proportion of primary care appointments in the UK changed from face to face appointments to an initial telephone or video call [9] and the number of in-person antenatal clinic visits decreased [10].
A systematic review of maternity care found a reduction in antenatal visits and an increase in remote care during the pandemic [11]. Furthermore, a survey of healthcare professionals at 194 obstetric units in England, conducted early in the pandemic, also reported a 70% and 56% reduction in routine antenatal and postnatal appointments, respectively, and over half the units used remote consultations in the postnatal period [12]. Whilst these changes reflected the pandemic’s impact on routine antenatal care, factors that increase the likelihood of having late or no postnatal examination overlap with many risk factors for contracting COVID-19, such as ethnic minority groups and deprivation [12].
A more recent study conducted across England (2006–2021) also identified persistent inequalities in the coverage of 6-8 week baby checks based on maternal ethnicity, even after adjusting for regional effects. These disparities varied by time and region, with women of Bangladeshi and Pakistani descent being disproportionately less likely to have a baby check, after accounting for sociodemographic factors, maternal and birth-related factors [13]. Although the study focused on infant examinations in primary care, it was observed that infants were less likely to receive a check if their mothers did not undergo a postnatal GP examination. This highlights the importance of maternal postnatal care in facilitating timely preventative care for both mothers and infants.
The current study aimed to evaluate the impact of the COVID-19 pandemic on the rate of maternal postnatal 6-8 week examinations, before, during and following the COVID-19 pandemic. This study also aimed to evaluate the association between maternal characteristics and the risk of no examination and how they might have been affected during the COVID-19 pandemic.
Methods
Data source
Primary care electronic health records (EHR) from patients registered within general practices managed by the software provider TPP SystmOne software were linked, stored and analysed securely using the OpenSAFELY platform [14], as part of the NHS England OpenSAFELY COVID-19 service. Data include pseudonymised data such as coded diagnoses, medications and physiological parameters. No free text data were included. All code is shared openly for review and re-use under the MIT open license https://github.com/opensafely/uom_pregnancy_tx_pathways. Detailed pseudonymised patient data is potentially re-identifiable and therefore not shared.
Study population
A dynamic study population was generated by extracting monthly records for all registered women between 1^st^ January 2019 to 31^st^ August 2023 aged 14 to 49 years. Patients with missing sex and age were excluded and all live patients were required to have at least 1 year of continuous registration within the practice prior to the index date (the first date of each month).
Codelists and data management
TPP SystmOne is fully compliant with the mandated NHS standard of SNOMED-CT clinical terminology. Clinical conditions and medicines are entered or prescribed in a format compliant with the NHS Dictionary of Medicines and Devices (dm+d) [15]. Pregnancy-related birth codes and codes referring to the postnatal 8-week period, as validated by the Clinical Practice Research Datalink (CPRD) [16], were converted to SNOMED CT using the NHS Technology Reference Update Distribution website [17] and refined by the study team and a clinical obstetrician so that only reliable delivery and postnatal codes were included. The final codelists are available at https://github.com/opensafely/uom_pregnancy_tx_pathways. Data management was performed using Python 3.8.10, with analysis carried out using R 4.0.5.
Monthly measures
We adopted a similar approach to Li et al. and calculated the rate of postnatal examinations within 6, 8 or 12 weeks of codes relating to the birth of a baby, over time [6]. Specifically, for each monthly extract, if a birth-related code was present, the EHR record was searched to see if there was a postnatal code in the following 42, 56 or 84 days. Monthly rates were estimated by dividing the number of patients with a postnatal code in each follow-up period by the total number of patients with a birth code for each month, multiplied by 1000. All counts were rounded to the nearest 5, and counts less than 7 were redacted prior to calculating rates. To investigate whether postnatal examinations varied by maternal characteristics, rates were also estimated separately by age groups, region, deprivation quintile and ethnicity.
Demographics
Time-varying patient demographics were extracted on each index date (first date of each month), including age, most recent body mass index (BMI) measurement to the index date and region of primary care practice. Records where a BMI was < 8 kg/m^2^ or > 50 kg/m^2^ were set to missing. Patient-level socioeconomic deprivation quintiles were estimated using the index of multiple deprivation (IMD) derived from the patient’s residence postcode within a Lower Super Output Area (LSOA) which comprises between 400 and 1200 households. Ethnicity was extracted once, recording the most recent entry. Common comorbidities were captured if recorded in primary care records for the 5 years before the delivery date and summarised as a weighted Charlson Comorbidity Index score [18]. Since patients could have multiple separate births across the study time frame, one random observation per patient was selected for each follow-up cohort and summarised using descriptive statistics.
Statistical analysis
An interrupted time series (ITS) analysis assesses the impact of an intervention when implemented at a specific time period [19] and was used here to model the impact of the COVID-19 pandemic on the rate of postnatal examinations before and during the COVID-19 pandemic. Pre-COVID-19 was defined from 1^st^ January 2019 to 28^th^ February 2020. The start of the national lockdown period (March 2020) was modelled as the interruption in the ITS analysis. Negative binomial regressions were used to model the count of postnatal checks, with an offset for the population size for those with a birth-related code in 6, 8 or 12 weeks before (modelled separately). ITS models were adjusted for a binary variable to indicate COVID-19 time, a monthly count variable and time since the interruption variable. The time series counterfactual was calculated following the start of the pandemic to estimate what would have happened to the rate of postnatal check if there was no interruption by the COVID-19 pandemic. The incidence rate ratio (IRR) compares the ratio of rates between the two time periods. ITS was modelled overall and separately by age groups, region, deprivation quintile and ethnicity.
Regression analysis was used to investigate the association between maternal characteristics and the risk of having no record of a maternal postnatal healthcare examination. Again, since patients could have multiple separate births, one random observation from the initial cohort was selected for each follow-up cohort, and cohorts were modelled separately. The association was estimated by univariable and multivariable analysis adjusting for key maternal demographics with complete-case analysis. To model a change in the effect of maternal demographics on the odds of no postnatal examination before or during the pandemic, data was further stratified to 2019 or 2022 onwards, then modelled to compare any changes in odds ratios following the recovery.
Results
Description of the cohort
There was a total of 626,180 patients from 2535 practices in the study period with a recorded birth event. There were 96,280 (15.4%), 204,490 (32.7%) and 325,580 (50.0%) patients with a coded postnatal examination within 6-, 8- or 12-week follow-up of a delivery code, respectively. The mean number of clinical codes relating to the birth of a baby, per person, in the study period was 2.5 (SD = 2.0) for those with and 2.1 (SD = 1.6) for those without a postnatal examination within 12 weeks. Table 1 shows the characteristics of each of the study populations for the specified follow-up periods, with a mean age of 28 years at delivery, and the majority with a healthy BMI (36%), followed by overweight (23%) and obese (20–21%). A large proportion of the study population was White (~ 81%), followed by Asian (~ 11%) and Black (~ 3%) ethnicity with 0.4% missing. Most of the population had no comorbidities (~ 86%) as defined by the Charlson Index. The most common condition was asthma and/or chronic obstructive pulmonary disease (COPD) in 9.8% of the study population (see Additional file 1: Tab.S1). Table 1. Study characteristics, randomly selecting one observation per patient for each follow-up period of the dynamic cohort. Counts are rounded to the nearest 5 and counts less than 7 redacted6-week cohort8-week cohort12-week cohortPostnatal checkPostnatal checkPostnatal checkNoYesTotalNoYesTotalNoYesTotalNumber of Delivery CodesMean (SD)2.2 (1.7)3.0 (2.2)2.2 (1.7)2.6 (2.1)2.1 (1.6)2.5 (2.0)AgeMean (SD)28.4 (5.7)28.7 (5.6)28.4 (5.8)28.6 (5.5)28.6 (5.8)28.4 (5.6)Age Group14–1935,1906.656555.940,84529,1906.911,6555.740,84520,4006.820,4456.340,84520–2494,92517.916,42517.1111,35076,41018.134,94017.1111,35053,23017.758,12017.9111,35025–29170,19532.130,95032.1201,145134,25031.866,89532.7201,14594,07531.3107,07032.9201,14530–34152,58028.828,82529.9181,405120,22028.561,19029.9181,40586,47528.894,93029.2181,40535–3964,99012.312,34512.877,33051,77012.325,56012.577,33038,48512.838,84511.977,33040–4410,6302.019352.012,56586052.039601.912,56567952.357701.812,56545–4913950.31450.2154012550.32850.1154011450.43950.11540BMIMean (SD)26.7 (6.1)26.8 (6.1)26.7 (6.1)26.7 (6.0)26.7 (6.1)26.8 (6.0)BMI GroupHealthy weight188,72035.634,42535.8223,140148,87535.374,31036.3223,185105,95035.2117,22036.0223,170Overweight123,04023.222,93023.8145,97097,47523.148,50523.7145,98568,93522.977,09023.7146,020Obese110,95020.921,01021.8131,96088,03020.943,88021.5131,91062,01520.669,92021.5131,935Underweight13,9402.623902.516,33011,3602.750002.416,36081752.781902.516,365Missing93,25017.615,52516.1108,77575,95518.032,79516.0108,74555,52518.553,16016.3108,685RegionEast122,67023.222,6254.3145,29091,89021.853,39010.1145,28060,46011.484,83016.0145,290East Midlands94,06017.815,39016.0109,44577,80518.531,64515.5109,45059,66519.949,77515.3109,440London28,4855.479058.236,38524,2355.812,1455.936,38020,1056.716,2805.036,385North East26,3905.041604.330,55022,4105.381554.030,56516,7255.613,8404.330,560North West48,3509.1899513.657,34039,9309.517,4058.557,33527,9359.329,4059.057,340South East34,1456.463756.640,52024,4405.816,0807.940,52014,7204.925,8007.940,520South West64,91512.312,60013.177,51548,00511.429,51514.577,51532,77510.944,73513.877,510West Midlands22,2054.249055.127,11020,0204.870853.527,10515,1455.011,9603.727,105Yorkshire and The Humber88,20516.713,18513.7101,39072,59017.228,81014.1101,40052,79517.648,59514.9101,390EthnicityAsian or Asian British57,37010.810,65011.168,02048,05511.419,9659.868,02034,99011.633,03010.168,020Black or Black British16,2403.131103.219,35013,4703.258802.919,35010,0703.392802.919,350Chinese or Other Ethnic Groups11,9902.321652.214,15599502.442052.114,15573302.468252.114,155Mixed10,6702.019752.112,64587652.138801.912,64565252.261201.912,645White431,72081.578,06081.1509,785339,90580.6169,88083.1509,785240,57580.0269,21082.7509,785Missing19050.43200.3222515450.46800.3222511100.411150.32225Index of Multiple Deprivation (IMD)1 (most deprived)131,48524.822,21523.1153,700111,50526.442,27520.7153,78081,28027.072,40522.2153,6902108,46520.519,36020.1127,82587,63020.840,14019.6127,77062,34020.765,49020.1127,8303101,19519.119,06019.8120,25578,85018.741,42520.3120,27555,98018.664,26019.7120,240488,99516.816,93017.6105,92068,44516.237,48018.3105,92548,19516.057,78517.7105,9855 (least deprived)75,65014.313,96014.589,61056,94013.532,62016.089,56040,34013.449,25515.189,595Missing24,1104.547554.928,86518,3204.310,5555.228,87512,4604.116,3905.028,850Charlson Comorbidity Index’s GroupZero457,46086.382,45085.6539,910364,44086.4175,44085.8539,880259,68586.4280,18086.1539,865Low67,26512.712,61013.179,87553,13012.626,75513.179,88537,88512.642,02012.979,905Medium35100.76500.7416527550.713950.7415019650.721750.74140High14000.34800.5188011250.37550.418808850.310100.31895Very high2650.1900.13552450.11400.13851800.11950.1375
The most common delivery codes recorded were “Spontaneous vertex delivery”, “Single live birth” and “Delivery normal”, and the most common postnatal codes were “Maternal postnatal 6 week examination”, “Postnatal examination normal” and “Postnatal maternal examination”. For a summary of the ten most frequent codes, see Additional file 1: Tab.S2.
Rate of postnatal examinations
The rate of postnatal examinations reduced at the start of the COVID-19 pandemic. For examinations within 6 weeks, the greatest reduction was from 192.1 to 144 per 1000 deliveries, equating to a 24.7% drop between January and March 2020. For examinations within 8 weeks, the greatest fall was from 368.2 to 279.3 per 1000 deliveries, equating to a 24.1% drop between January and March 2020. Rates for 6 and 8 weeks remained low but fluctuated throughout the national lockdown periods and eventually recovered to pre-pandemic rates around November 2022 (Fig. 1), suggesting 200 and 400 per 1000 new mothers received postnatal examinations within the recommended 6-8 weeks.Fig. 1. The rate of postnatal (PN) examinations per 1000 unique patients reduced during the pandemic. Rate was calculated for each calendar month using the delivery date as the reference point assessing whether PN checks occurred within 6, 8 or 12 weeks following a delivery code. The proportion of PN checks within the defined follow-up period was estimated relative to the total number of deliveries in that index month. Due to this calculation method, the initial reduction observed in PN examinations during the national lockdown periods (indicated by grey-shaded bars), appear as a reduction in the months prior to the lockdowns
Pre-pandemic rates were higher for postnatal checks within 12 weeks follow-up (473.7 per 1000 in December 2019) and reduced initially but recovered quickly. Rates within 12 weeks continued to rise, reaching and surpassing pre-pandemic levels to 622.3 per 1000 in May 2023 (an increase of 31.4%). Rates also varied by maternal demographics. By age, rates were lower for younger and older groups (< 24 and ≥ 40 years). Rates were lower and remain lower for women residing in the North East, North West, West Midlands and Yorkshire regions of England. Women from ethnic minorities also had fewer appointments over time with a pronounced reduction during the national lockdown periods. Similarly, rates were lower in women from the bottom two deprivation quintiles across the entire study period (Figs. 2 and 3).Fig. 2. The rate of postnatal (PN) examinations per 1000 unique patients stratified by age or ethnic group. Rate of examinations was calculated for each calendar month, stratified by age or ethnicity, using the delivery date as the reference point assessing whether PN checks occurred within 6, 8 or 12 weeks following a delivery code. The proportion of PN checks within the defined follow-up period was estimated relative to the total number of deliveries in that index month. Due to this calculation method, the initial reduction observed in PN examinations during the national lockdown periods (indicated by grey-shaded bars), appear as a reduction in the months prior to the lockdownsFig. 3The rate of postnatal (PN) examinations per 1000 unique patients stratified by region or index of multiple deprivation (IMD) quintile. Rate of examinations was calculated for each calendar month, stratified by region or IMD, using the delivery date as the reference point assessing whether PN checks occurred within 6, 8 or 12 weeks following a delivery code. The proportion of PN checks within the defined follow-up period was estimated relative to the total number of deliveries in that index month. Due to this calculation method, the initial reduction observed in PN examinations during the national lockdown periods (indicated by grey-shaded bars), appear as a reduction in the months prior to the lockdowns
The impact of the pandemic on rates
Interrupted time series showed reduced incident rate ratios (IRRs) at the start of the pandemic of 0.87 (95% confidence interval (CI): 0.83–0.91) for 6 weeks and 0.84 (0.81–0.87) for 8 weeks, with a small increase to IRRs for 12 weeks (1.06; CI 1.04–1.08) (Table 2). Adjusting for short-term autocorrelation using Newey-West robust standard errors had minimal impact on point estimates: the immediate drop in postnatal examinations at pandemic onset remained unchanged (IRR of 0.87 and 0.84 for 6 and 8 weeks, respectively), although the 95% CI widened slightly, reflecting a more conservative estimate of uncertainty (Additional file 1: Tab.S3). The greatest reduction in IRRs was observed for age category 25–29 years (IRR 0.83 (0.79–0.86)) and for ethnicity classified as “Other” (IRR 0.77 (0.68–0.87)). IRRs for deprivation varied by quintiles from 0.81 (0.78–0.85) for quintile 3 to 0.91 (0.86–0.95) in the most deprived quintile 1. The counterfactual, reflecting the expected trend if no interruption had occurred, demonstrated a steady or continued downward trajectory in the rate of postnatal examinations overall (Additional file 1: Fig. S1) and by demographic sub-group. Table 2. Incident rate ratios (IRR) for the rate of postnatal examinations. IRRs were estimated comparing pre-pandemic rates with the first national lock-down period modelled as an interruption in an interrupted time series analysis for COVID-19. IRRs by demographic are displayed for the 8-week follow-up cohortIRR95% confidence interval6-weeks0.870.830.918-weeks0.840.810.8712-weeks1.061.041.08Age category (year) 14–190.890.820.98 20–240.840.800.89 25–290.830.790.86 30–340.840.800.88 35–390.840.800.89 40–440.860.770.95Ethnicity White0.840.800.87 Mixed0.810.720.92 Asian or Asian British0.880.830.94 Black or Black British0.830.740.92 Other0.770.680.87Deprivation Most deprived—10.910.860.95 20.820.780.86 30.810.780.85 40.830.790.87 Least deprived—50.820.780.86Region East0.830.790.87 East Midlands0.760.710.81 London0.840.760.92 North East1.050.961.16 North West0.850.800.90 South East0.790.740.85 South West0.800.760.84 West Midlands0.900.820.98 Yorkshire and The Humber0.960.911.01
The association of characteristics and no postnatal examination
The odds of no postnatal examination in the 8 weeks after birth were greater for women of ethnic minorities compared to White women (Table 3). For Chinese or Other, the odds ratio was 1.16 (95% confidence interval: 1.11–1.21), Asian 1.11 (1.09–1.14), Black 1.08 (1.03–1.12), Mixed 1.08 (1.03–1.14). The odds of no postnatal examination were also greater for the more deprived quintiles compared to the least deprived. The odds of not having a timely postnatal examination were 34% higher for the most deprived quintile compared to the least deprived, and 21% higher for the second most deprived quintile. Table 3. Modelling the association of patient characteristics for no postnatal examination within 6-, 8- or 12-week follow-up. Data presented as odds ratio (OR) and 95% confidence intervals (CI)6-weeks8-weeks^^12-weeksOR95% CIP* valueOR95% CIP valueOR95% CIP value(Intercept)4.063.784.351.721.621.830.000.880.840.93Age0.9980.9960.9990.0020.9990.9981.0000.2281.0101.0091.011< 0.001BMI0.9960.9940.997< 0.0010.9960.9950.997< 0.0010.9960.9950.997< 0.001Ethnicity Asian or Asian British1.031.001.060.031.111.091.14< 0.0011.021.001.040.06 Black or Black British1.010.971.060.601.081.031.12< 0.0011.061.021.10< 0.001 Chinese or Other Ethnic Groups1.071.011.130.011.161.111.21< 0.0011.091.051.14< 0.001Mixed1.030.971.100.281.081.031.14< 0.0011.131.081.18< 0.001Deprivation quintile< 0.001< 0.001 11.081.051.11< 0.0011.341.311.37< 0.0011.241.221.27< 0.001 21.061.031.09< 0.0011.211.181.24< 0.0011.111.091.13< 0.001 31.010.981.040.451.101.071.12< 0.0011.061.041.08< 0.001 40.970.951.000.061.041.021.07< 0.0011.021.001.040.11Region East1.561.511.62< 0.0010.940.910.97< 0.0010.610.590.63< 0.001 East Midlands1.761.701.83< 0.0011.321.281.37< 0.0011.041.011.070.01 North East1.771.691.87< 0.0011.391.331.45< 0.0010.990.961.030.67 North West1.521.461.58< 0.0011.191.151.24< 0.0010.800.770.83< 0.001 South East1.511.441.58< 0.0010.820.790.85< 0.0010.490.480.51< 0.001 South West1.471.421.53< 0.0010.890.860.92< 0.0010.650.630.67< 0.001 West Midlands1.231.171.29< 0.0011.331.271.39< 0.0011.010.971.050.62 Yorkshire and The Humber1.851.781.92< 0.0011.271.231.32< 0.0010.900.880.93< 0.001Charlson comorbidity Index Score > 00.930.900.97< 0.0011.010.981.040.521.091.061.12< 0.001Covid time1.071.051.08< 0.001When patients had more than one delivery code in the study period one was selected at random to modelReference categories for ethnicity: White, Deprivation quintile: 5 least deprived, region: London, Charlson comorbidity index score of zero^*^The model for 8 weeks follow-up was also adjusted for covid time where a value of one indicated a delivery from March 2020, and the reference category zero indicated before March 2020
The association between no examination and region varied substantially; for example, the odds for no postnatal examination in the recommended 6 weeks was 1.76 (1.70–1.83) for the East Midlands compared to London, but just 1.04 (1.01–1.07) within 12 weeks. Similarly, the odds were 0.49 (0.48–0.51) in 12 weeks follow-up in South East, but 1.51 in 6 weeks. This suggests most regions can accommodate examinations within a longer follow-up period, but some regions record more examinations in the recommended time than others. Furthermore, older women and women with a comorbidity were more likely to receive a timely examination compared to younger, healthier individuals (Table 3). Comparing associations of risk before and after the pandemic (2019 v 2022), age and BMI remain unchanged; however, the risk in some regions compared to London has improved. The odds of no examination for deprived socioeconomic groups remain and increased for a postnatal examination within 6-8 weeks for the North West and South East, those with existing comorbidity and Asian ethnicity (Additional file 1: Tab.S4).
Discussion
This study observed a substantial reduction in the rate of postnatal examinations in the first lockdown period of the COVID-19 pandemic in England. Rates fluctuated before gradually returning to pre-pandemic levels. However, the recovery of service delivery varied, showing that fewer patients received a postnatal examination in the recommended 6-8 weeks compared to 12 weeks follow-up throughout the pandemic and beyond. Furthermore, there were persistent regional, socioeconomical and ethnic disparities in accessing the routine postnatal check. These factors also remain significantly associated with the risk of no postnatal examination.
Reduction in postnatal care during the pandemic
The significant reduction observed in this study at the onset of the COVID-19 pandemic corresponds with the imposed lockdown and widespread restrictions in place across in England. Similar findings have been observed globally, including the initial changes to healthcare delivery and public behaviours. Routine healthcare was deprioritised as resources were redirected to containing the spread and managing the clinical impact of COVID-19 infections. Numerous studies have demonstrated similar findings in access and delivery of routine healthcare during this period [20–22].
Despite the interruption caused by the initial lockdown periods of the pandemic, the study showed a subsequent upward trajectory as healthcare services recovered. The upward trajectory demonstrated an improvement in rates of examinations within 6 or 8 weeks similar to 2019 by the end of 2022; however, recovery for examinations within 12 weeks was much quicker. This upward trend may not have been solely due to post-lockdown recovery but could also be attributed to other factors, such as a policy change implemented prior to the start of the pandemic. The general practitioner (GP) contract was updated in February 2020 to include a standardised 6-to-8 week postnatal check for new mothers, with the addition of £12 million in funding to support the change [4]. This change aimed to ensure that the postnatal check was offered as an essential service to all mothers as a separate appointment in addition to the routine baby check appointments during this period. The pandemic likely stalled the effects of the initial change in contract by limiting access to care in the first few months. At the same time, births in England and Wales fell from ~657,000 in 2019 to ~614,000 in 2020, with a modest recovery in 2021 (~625,000) before declining again (~605,000 in 2022; 591,000 in 2023; est. ~568,000 in 2024) [23]. While the total number of live births declined, the proportion of deliveries receiving a postnatal examination initially fell and later recovered, likely reflecting both the GP contractual changes and reduced demand. Nevertheless, disparities in access and delays in examinations remain, highlighting persistent inequities in care or patients’ ability to attend appointments.
Regional, socioeconomic and ethnic disparities
The analysis showed significant variation in postnatal care across regions, deprivation quintiles and between ethnic groups. Whilst these changes reflected the pandemic’s impact on routine antenatal care, factors that increase the likelihood of having late or no postnatal examination overlap with many risk factors for adverse outcomes of COVID-19 infections, such as ethnic minority groups and deprivation, meaning that the consequences of these changes may not have been evenly distributed. For example, ethnic minority groups were shown to have an increased risk of suffering more serious COVID-19 infections and outcomes [24]. As a result, the initial reduction in postnatal examinations for these groups may have been related to increased concern around contracting COVID-19 and were more likely to avoid appointments. However, comparing the risk before and after the pandemic recovery, in 2022, the risk of missing appointments remained higher for ethnic minority groups compared to White women, suggesting there are other factors contributing to the observed differences.
The Incidence Rate Ratios (IRRs) were not as pronounced for some groups, such as the most deprived quintile. The small reduction in IRR is likely because this group already exhibited the lowest rate of postnatal examinations before the onset of the pandemic. In contrast, more affluent groups experienced a substantial reduction in postnatal care appointments during the onset of the pandemic. This suggests that the abrupt change in healthcare delivery disproportionately affected those who previously had better access to care, whilst those with existing poor access or uptake were less affected. The eventual recovery in the rate of postnatal examinations did not eliminate the pre-existing disparities in postnatal care access or uptake, which were also significant for women from ethnic minority groups and younger women.
These findings align with longstanding research showing socioeconomic and ethnic disparities in healthcare access [25] and uptake [26], especially for maternal and perinatal care and health outcomes [27]. The MBRRACE-UK reports into maternal deaths and morbidity show Asian and Black women are two and four times more likely to die during pregnancy or up to 6 weeks after childbirth [28]. This association was also evident for infant mortality in ethnic minorities and deprived regions [29]. Similarly, a recent study highlighted in the introduction found that postnatal 6-to-8 week baby check appointments were less frequent among ethnic minority groups in the UK, even after accounting for other risk factors such as region [13]. It was also shown that infants were less likely to have a check if mothers also had no record of a postnatal maternal examination. This raises the question of whether these patient groups are less likely to be invited, or more probably, less likely to take up the invitation, suggesting potential barriers related to access, awareness and culturally sensitive follow-up care in the community, particularly if information about postnatal services was communicated in ways that were not inclusive.
The current study also highlighted regional disparities in postnatal care, with areas such as the North East, East and West Midlands and Yorkshire and The Humber having particularly lower rates of postnatal examinations. Access to care may be worse for ethnic minority groups in these regions, especially if existing challenges, such as deprivation, health illiteracy, language barriers, digital exclusion and culturally insensitive communication, are not addressed [30–32]. Efforts to promote equitable care postnatally should prioritise addressing these barriers and ensuring that care delivery is culturally sensitive and accessible to all.
The impact of delayed or no postnatal examinations on immediate and long-term maternal and infant health may well be exacerbated in marginalised communities, clustered in regions of the UK. There is evidence to support inequalities in outcomes of pregnancy and childbirth in these groups, such as an increased risk of small for gestational age babies, with a higher incidence of low Apgar scores (an assessment of a newborn's health performed shortly after birth) and more neonatal admissions [33, 34].
Policy implications and recommendations
While some recovery has been observed following the pandemic's initial phase, disparities in access or uptake remain. These findings demonstrate the urgent need for healthcare systems to prioritise equitable access to, and uptake of, postnatal care, particularly for socioeconomically disadvantaged and ethnic minority groups. This is critical due to the higher rates of maternal and infant mortality in these populations. This is particularly challenging when the number of GPs per patient also varies by local area, with 15% more patients to GPs in more deprived areas, equating to 370 more patients per single GP [35]. Further support to primary care services or expansion of postnatal follow-up within women’s health hubs is urgently needed to sustain postnatal follow-up, especially if the service will remain within an already overburdened primary care system [36, 37].
The observed disparity is highly likely to have significant implications for maternal and infant health outcomes, as maternal mortality is highest in the first 42 days postpartum [38]. Timely postnatal examinations are critical for identifying and managing complications. For example, achieving blood pressure (BP) control within 6 weeks is associated with a persistently lower BP at 6 months [39] and at 4 years, with an estimated 30% reduction in subsequent cardiovascular risk [40]. Echocardiographic improvements are also evident by 6 weeks but show little change from 6 weeks to 6 months [41], suggesting early control may limit vascular remodelling. Similarly, postpartum diabetes screening at 4–12 weeks enables earlier detection of dysglycaemia and timely intervention. Given that cardiometabolic conditions like hypertensive disorders of pregnancy and gestational diabetes are both common and disproportionately affect minoritised populations [42–44], equitable and timely postnatal assessment is essential to reduce long-term cardiometabolic risk. Further work is needed to understand if these disparities stem from certain patient groups not being offered appointments, not being offered them in a timely manner, or not taking up these appointments when offered—or a combination of these factors. Further understanding will help guide interventions to improve appointment offerings, as well as uptake and access for socioeconomically disadvantaged and ethnic minority groups.
Efforts to improve access and uptake of postnatal care should focus on immediate interventions for at-risk populations, alongside long-term strategies and early postnatal preventative action to address systemic health inequalities. However, financial incentives alone may not be sufficient; tailored interventions are also needed to address the unique needs of disadvantaged populations by targeting areas with the highest health inequalities [31]. This includes improving outreach to communities with low health literacy, language barriers and limited digital access [45]. Such change in the postnatal period likely needs effective collaboration and communication between maternity and primary care services.
Furthermore, improving health between pregnancies is an opportunity to prevent poor outcomes in subsequent pregnancies and in women’s later life, but requires timely interventions to address modifiable risk factors. This includes prioritising care for individuals at immediate risk, as well as those with long-term risk of developing comorbidities. Enhanced processes are needed to optimise care delivery and reduce the burden on the healthcare system, ensuring that high-risk groups receive targeted, effective interventions [31].
Strengths and limitations
These observations are based on comprehensive data from over 2500 primary care practices covering 43% of the English population [46]. This study provides valuable insights into postnatal care trends before, during and after the COVID-19 pandemic. However, it is important to note some limitations. The study relied on coded entries in the patient electronic health records to identify postnatal healthcare interactions, which may have led to an underestimation of interactions if they were not coded, documented in free text or coincided with the baby check appointment. Furthermore, the follow-up period (within 6, 8 and 12 weeks of a delivery code) may have missed checks that occurred after the follow-up. Conversely, the inclusion of all recorded postnatal examinations, including those in the community, may have led to a slight overestimation. Furthermore, in sensitivity analyses, we accounted for short-term autocorrelation using Newey-West robust standard errors, which had minimal impact on point estimates, though confidence intervals widened slightly. We did not adjust for seasonality; while England shows modest birth seasonality with a slight late-summer/early-autumn peak, the abrupt pandemic-related drop is unlikely to be explained by either factor. Our regression analyses used complete-case data. Missingness was very low for variables such as ethnicity (< 0.4%) and IMD (< 5%) and slightly higher for BMI (< 18.5%). While multiple imputation could not be performed due to the large size of the monthly extracts, this is unlikely to substantially affect the results. Complete-case analysis may introduce bias if missingness is related to maternal characteristics or service use, representing a potential limitation of the study. Despite this limitation, the study offers a comprehensive overview of postnatal care during a period of significant disruption and the status of healthcare provisions. Further research should explore the direct impact on long-term health for women who experience delayed or missed postnatal healthcare examinations across different patient populations to fully understand the broader health consequences.
Conclusion
The COVID-19 pandemic significantly disrupted postnatal care provision, with the greatest reductions observed during the initial phase. While there has been a recovery in service provision, disparities in access or uptake of care remain, particularly among socioeconomically disadvantaged and ethnic minority groups. Addressing these disparities will require a combination of policy changes, financial incentives and targeted, culturally appropriate interventions to promote equitable access to care for all mothers and infants.
Supplementary Information
Additional File 1: Additional Tables and Figures. Table S1: Charlson comorbidity characteristics of the population. Table S2: Ten most frequent birth and postnatal codes within the study period. Table S3: Incident rate ratios (IRR) for the rate of postnatal checks with autocorrelation adjustment. Figures S1: Interrupted Time Series analysis of the rate of postnatal examinations 6-, 8-, or 12-weeks follow-up cohorts with counterfactual. Table S4: Incident rate ratios (IRR) for the rate of postnatal examinations within 8-weeks, 2019 compared to 2020.
The reference list from the paper itself. Each links out to its DOI / PubMed record.
- 1National Institute for Health and Care Excellence (NICE). Postnatal care: Recommendations, Assessment and care of the woman 2021. Available from: https://www.nice.org.uk/guidance/ng 194/chapter/recommendations#assessment-and-care-of-the-woman.
- 2NHS England. GP six to eight week maternal postnatal consultation – what good looks like guidance 2023. Available from: https://www.england.nhs.uk/long-read/gp-six-to-eight-week-maternal-postnatal-consultation-what-good-looks-like-guidance/.
- 3NHS England. Overview | Postnatal care | Guidance | NICE 2021. Available from: https://www.nice.org.uk/guidance/ng 194.
- 4NHS England. NHS England » Investment and Evolution: Update to the GP contract agreement 2020/21 – 2023/24 2020. Available from: https://www.england.nhs.uk/publication/investment-and-evolution-update-to-the-gp-contract-agreement-20-21-23-24/.
- 5UK Health Security Agency. Coronavirus (COVID-19): guidance 2020. Available from: https://www.gov.uk/government/collections/coronavirus-covid-19-list-of-guidance.
- 6NHS England. Home - Technology reference update distribution -TRUD. Available from: https://isd.digital.nhs.uk/trud/users/guest/filters/0/home.
- 7Office for National Statistics. Live births. Available from: https://www.ons.gov.uk/peoplepopulationandcommunity/birthsdeathsandmarriages/livebirths.
- 8MBRRACE-UK;. Perinatal Mortality Surveillance: UK perinatal deaths of babies born in 2021 2023. Available from: https://www.npeu.ox.ac.uk/mbrrace-uk/reports/perinatal-mortality-surveillance.