Incidence of chronic osteomyelitis between 2016 and 2022 in a large, multicenter database in the United States
Rawabi Aljadani, Hyunkeun Cho, Martha L. Carvour

TL;DR
This study analyzed chronic osteomyelitis incidence in the U.S. from 2016 to 2022, finding a slight decrease during the pandemic and gender-specific patterns.
Contribution
The study provides the largest multicenter estimate of chronic osteomyelitis incidence in the U.S., including trends during the pandemic.
Findings
Chronic osteomyelitis incidence was steady over time but showed a slight decline starting in 2020.
Incidence was about 2-fold higher in males than females.
Vertebral COM became slightly more common than lower-extremity COM among females during the study period.
Abstract
Introduction: Chronic osteomyelitis (COM) is a serious musculoskeletal infection that affects a patient's quality of life and long-term survival. In this study, we assessed overall, regional, and patient-level characteristics of bacterial COM in a large, multicenter database in the United States. Methods: We used ICD-10 codes to identify incident bacterial COM in the TriNetX database between 1 January 2016 and 31 December 2022. We calculated COM incidence per 1000 adult patients with the associated 95 % confidence intervals. We used the Cochran–Armitage test to assess incidence trends across the study period. Results: A total of 93 324 adult patients were identified. Overall, a steady COM incidence was observed over time, with some indication of lower rates starting in 2020. The incidence was about 2-fold higher in males than females. As expected, lower-extremity COM was most common…
Genes, proteins, chemicals, diseases, species, mutations and cell lines named across the full text — each resolved to its canonical identifier and authoritative record.
Click any figure to enlarge with its caption.
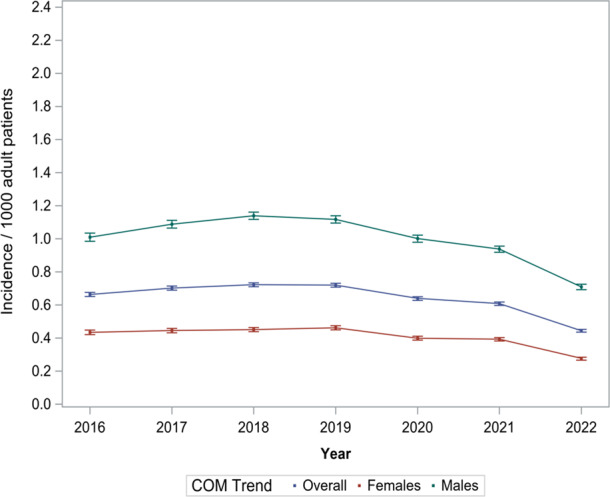 Figure 1
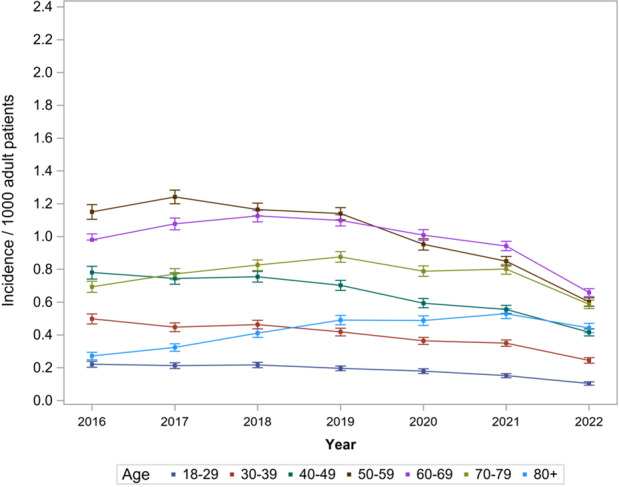 Figure 2
| Variable | Level | Overall | 2016 | 2017 | 2018 | 2019 | 2020 | 2021 | 2022 | ||||||||
|---|---|---|---|---|---|---|---|---|---|---|---|---|---|---|---|---|---|
| ( | ( | ( | ( | ( | ( | ( | ( | ||||||||||
|
| % |
| % |
| % |
| % |
| % |
| % |
| % |
| % | ||
| Age | 18–29 years | 4095 | 4.39 | 543 | 5.25 | 624 | 4.72 | 690 | 4.67 | 671 | 4.27 | 601 | 4.38 | 592 | 3.93 | 374 | 3.55 |
| 30–39 years | 7801 | 8.36 | 982 | 9.50 | 1096 | 8.30 | 1299 | 8.79 | 1239 | 7.89 | 1110 | 8.09 | 1250 | 8.30 | 825 | 7.83 | |
| 40–49 years | 12 431 | 13.32 | 1536 | 14.86 | 1799 | 13.62 | 2011 | 13.62 | 2041 | 13.00 | 1737 | 12.66 | 1922 | 12.76 | 1385 | 13.15 | |
| 50–59 years | 21 371 | 22.90 | 2513 | 24.32 | 3315 | 25.10 | 3409 | 23.08 | 3644 | 23.21 | 3061 | 22.32 | 3218 | 21.36 | 2211 | 20.99 | |
| 60–69 years | 24 754 | 26.52 | 2604 | 25.20 | 3454 | 26.15 | 3895 | 26.37 | 4131 | 26.32 | 3742 | 27.28 | 4098 | 27.20 | 2830 | 26.87 | |
| 70–79 years | 16 278 | 17.44 | 1601 | 15.49 | 2156 | 16.32 | 2486 | 16.83 | 2813 | 17.92 | 2419 | 17.64 | 2807 | 18.63 | 1996 | 18.95 | |
| | 80 | 6594 | 7.07 | 555 | 5.37 | 763 | 5.78 | 980 | 6.64 | 1159 | 7.38 | 1046 | 7.63 | 1178 | 7.82 | 913 | 8.67 |
| Sex | Female | 33 439 | 35.83 | 3830 | 37.06 | 4755 | 36.00 | 5217 | 35.32 | 5702 | 36.32 | 4807 | 35.05 | 5417 | 35.96 | 3711 | 35.23 |
| | Male | 59 881 | 64.16 | 6504 | 62.94 | 8452 | 64.00 | 9552 | 64.67 | 9996 | 63.68 | 8907 | 64.94 | 9648 | 64.04 | 6822 | 64.76 |
| Race/ | American Indian/Alaska Native | 631 | 0.68 | 70 | 0.68 | 110 | 0.83 | 103 | 0.70 | 101 | 0.64 | 92 | 0.67 | 90 | 0.60 | 65 | 0.62 |
| ethnicity | Asian | 935 | 1.00 | 73 | 0.71 | 103 | 0.78 | 161 | 1.09 | 154 | 0.98 | 146 | 1.06 | 182 | 1.21 | 116 | 1.10 |
| Black/African American | 16 413 | 17.59 | 1988 | 19.24 | 2407 | 18.23 | 2507 | 16.97 | 2600 | 16.56 | 2402 | 17.51 | 2761 | 18.33 | 1748 | 16.59 | |
| Hispanic/Latino | 2342 | 2.51 | 300 | 2.90 | 315 | 2.39 | 332 | 2.25 | 377 | 2.40 | 345 | 2.52 | 383 | 2.54 | 290 | 2.75 | |
| Native Hawaiian/Pacific Islander | 85 | 0.09 | 16 | 0.16 | 7 | 0.05 | 16 | 0.11 | 15 | 0.10 | 13 | 0.10 | 10 | 0.07 | 8 | 0.08 | |
| White | 62 383 | 66.85 | 6800 | 65.80 | 8821 | 66.79 | 10 029 | 67.90 | 10 419 | 66.37 | 9154 | 66.74 | 9918 | 65.83 | 7242 | 68.75 | |
| | Unknown | 10 535 | 11.29 | 1087 | 10.52 | 1444 | 10.93 | 1622 | 10.98 | 2032 | 12.94 | 1564 | 11.40 | 1721 | 11.42 | 1065 | 10.11 |
| Marital | Married | 16 487 | 17.67 | 1942 | 18.79 | 2238 | 16.95 | 2590 | 17.54 | 2712 | 17.28 | 2396 | 17.47 | 2756 | 18.29 | 1853 | 17.59 |
| status | Single | 23 479 | 25.16 | 2768 | 26.79 | 3221 | 24.39 | 3608 | 24.43 | 3903 | 24.86 | 3449 | 25.15 | 3808 | 25.28 | 2722 | 25.84 |
| | Unknown | 53 358 | 57.18 | 5624 | 54.42 | 7748 | 58.67 | 8572 | 58.04 | 9083 | 57.86 | 7871 | 57.39 | 8501 | 56.43 | 5959 | 56.57 |
| Region | Midwestern United States | 13 113 | 14.05 | 1752 | 16.95 | 1850 | 14.01 | 1958 | 13.26 | 2174 | 13.85 | 1871 | 13.64 | 1963 | 13.03 | 1545 | 14.67 |
| Northeastern United States | 22 738 | 24.36 | 2553 | 24.70 | 2909 | 22.03 | 3765 | 25.49 | 4026 | 25.65 | 3517 | 25.64 | 3629 | 24.09 | 2339 | 22.20 | |
| Southern United States | 38 122 | 40.85 | 4285 | 41.47 | 5272 | 39.92 | 5858 | 39.66 | 6145 | 39.15 | 5641 | 41.13 | 6539 | 43.41 | 4382 | 41.60 | |
| Western United States | 12 739 | 13.65 | 1592 | 15.41 | 1743 | 13.20 | 1936 | 13.11 | 1995 | 12.71 | 1804 | 13.15 | 2022 | 13.42 | 1647 | 15.64 | |
| Other/outside United States | 2132 | 2.28 | 136 | 1.32 | 229 | 1.73 | 239 | 1.62 | 515 | 3.28 | 328 | 2.39 | 448 | 2.97 | 237 | 2.25 | |
| | Unknown | 4480 | 4.80 | 16 | 0.16 | 1204 | 9.12 | 1014 | 6.87 | 843 | 5.37 | 555 | 4.05 | 464 | 3.08 | 384 | 3.65 |
| Anatomic | Lower extremity | 41 875 | 44.87 | 4679 | 45.28 | 6144 | 46.52 | 6977 | 47.24 | 7095 | 45.20 | 6029 | 43.96 | 6360 | 42.22 | 4591 | 43.58 |
| site | Upper extremity | 4135 | 4.43 | 527 | 5.10 | 603 | 4.57 | 630 | 4.27 | 740 | 4.71 | 573 | 4.18 | 620 | 4.12 | 442 | 4.20 |
| Vertebral column | 31 994 | 34.28 | 3417 | 33.07 | 4318 | 32.69 | 4934 | 33.41 | 5174 | 32.96 | 4867 | 35.48 | 5564 | 36.93 | 3720 | 35.31 | |
| | Other sites | 15 320 | 16.42 | 1711 | 16.56 | 2142 | 16.22 | 2229 | 15.09 | 2689 | 17.13 | 2247 | 16.38 | 2521 | 16.73 | 1781 | 16.91 |
| Chronic | Diabetes | 47 608 | 51.01 | 4735 | 45.82 | 6638 | 50.26 | 7663 | 51.88 | 8199 | 52.23 | 7079 | 51.61 | 7775 | 51.61 | 5519 | 52.39 |
| conditions | Hypertension | 60 667 | 66.13 | 6320 | 61.16 | 8402 | 63.62 | 9583 | 64.88 | 10 373 | 66.08 | 9139 | 66.63 | 9849 | 65.38 | 7001 | 66.46 |
| Cardiovascular disease | 50 012 | 54.52 | 4944 | 47.84 | 6593 | 49.92 | 7816 | 52.92 | 8494 | 54.11 | 7754 | 56.53 | 8363 | 55.51 | 6048 | 57.41 | |
| Chronic liver disease | 2784 | 3.03 | 423 | 4.09 | 423 | 3.20 | 427 | 2.89 | 421 | 2.68 | 410 | 3.00 | 404 | 2.68 | 276 | 2.62 | |
| Chronic kidney disease | 26 922 | 29.35 | 2744 | 26.55 | 3680 | 27.86 | 4269 | 28.90 | 4589 | 29.23 | 4121 | 30.05 | 4402 | 29.22 | 3117 | 29.59 | |
| Chronic lung disease | 10 648 | 11.61 | 1337 | 12.94 | 1420 | 10.75 | 1596 | 10.81 | 1708 | 10.88 | 1640 | 11.96 | 1726 | 11.46 | 1221 | 11.59 | |
| Cerebrovascular disease | 13 485 | 14.70 | 1064 | 10.30 | 1568 | 11.87 | 1954 | 13.23 | 2265 | 14.43 | 2199 | 16.03 | 2546 | 16.90 | 1889 | 17.93 | |
| Chronic neurological condition | 13 913 | 15.17 | 1493 | 14.45 | 1888 | 14.30 | 2127 | 14.40 | 2297 | 14.63 | 2149 | 15.67 | 2291 | 15.21 | 1668 | 15.83 | |
| Variable | Level | 2016 | 2017 | 2018 | 2019 | 2020 | 2021 | 2022 |
| ||||||||||||||
|---|---|---|---|---|---|---|---|---|---|---|---|---|---|---|---|---|---|---|---|---|---|---|---|
| | | | | | | | (test for trend) | ||||||||||||||||
| Rate | 95 % CI | Rate | 95 % CI | Rate | 95 % CI | Rate | 95 % CI | Rate | 95 % CI | Rate | 95 % CI | Rate | 95 % CI | ||||||||||
| LL | UL | LL | UL | LL | UL | LL | UL | LL | UL | LL | UL | LL | UL | ||||||||||
| Regiona | Midwestern United States | 0.53 | 0.51 | 0.56 | 0.56 | 0.54 | 0.59 | 0.59 | 0.57 | 0.62 | 0.64 | 0.61 | 0.66 | 0.55 | 0.53 | 0.58 | 0.59 | 0.56 | 0.61 | 0.49 | 0.46 | 0.51 | 1 |
| Northeastern United States | 0.63 | 0.61 | 0.66 | 0.65 | 0.62 | 0.67 | 0.69 | 0.67 | 0.72 | 0.71 | 0.69 | 0.73 | 0.64 | 0.62 | 0.66 | 0.55 | 0.53 | 0.57 | 0.36 | 0.35 | 0.38 | 0.8 | |
| Southern United States | 0.79 | 0.76 | 0.81 | 0.88 | 0.86 | 0.91 | 0.87 | 0.85 | 0.90 | 0.85 | 0.83 | 0.88 | 0.78 | 0.76 | 0.80 | 0.74 | 0.72 | 0.76 | 0.51 | 0.50 | 0.53 | 0.8 | |
| | Western United States | 0.73 | 0.70 | 0.77 | 0.74 | 0.70 | 0.77 | 0.74 | 0.71 | 0.78 | 0.72 | 0.69 | 0.75 | 0.59 | 0.56 | 0.61 | 0.61 | 0.59 | 0.64 | 0.60 | 0.57 | 0.63 | 0.9 |
| Anatomic siteb | Lower extremity | 0.30 | 0.29 | 0.31 | 0.33 | 0.32 | 0.34 | 0.34 | 0.33 | 0.35 | 0.33 | 0.32 | 0.33 | 0.28 | 0.27 | 0.29 | 0.26 | 0.25 | 0.26 | 0.19 | 0.19 | 0.20 | 0.9 |
| Upper extremity | 0.03 | 0.03 | 0.04 | 0.03 | 0.03 | 0.04 | 0.03 | 0.03 | 0.03 | 0.03 | 0.032 | 0.04 | 0.03 | 0.03 | 0.03 | 0.03 | 0.02 | 0.03 | 0.02 | 0.02 | 0.02 | 1 | |
| Vertebral column | 0.22 | 0.21 | 0.23 | 0.23 | 0.22 | 0.24 | 0.24 | 0.23 | 0.25 | 0.24 | 0.23 | 0.24 | 0.23 | 0.22 | 0.23 | 0.22 | 0.22 | 0.23 | 0.16 | 0.15 | 0.16 | 0.9 | |
| Other sitesd | 0.11 | 0.11 | 0.12 | 0.11 | 0.11 | 0.12 | 0.11 | 0.11 | 0.11 | 0.12 | 0.12 | 0.13 | 0.11 | 0.10 | 0.11 | 0.10 | 0.10 | 0.11 | 0.08 | 0.07 | 0.08 | 0.9 | |
- —National Institutes of Health via the University of Iowa Institute for Clinical and Translational Science
Peer Reviews
No public reviews on file for this paper yet. If you reviewed it on a platform where reviews are public (OpenReview, ICLR, NeurIPS, ICML), you can paste yours below so the community can read it here.
Videos
No videos yet. Explain this paper in a talk, walkthrough, or lecture? Add one.
Taxonomy
TopicsOrthopedic Infections and Treatments · Osteomyelitis and Bone Disorders Research · Hematological disorders and diagnostics
Introduction
1
Chronic osteomyelitis (COM) is a serious infection that impacts a patient's functional status, quality of life, and long-term survival (Akiyama et al., 2013; Lang et al., 2023). COM diagnoses often rely on a combination of clinical, radiological, microbiological, and histopathological features; this diagnostic evaluation and subsequent treatment for COM can be complicated and costly. In the United States, a 12-month average cost for osteomyelitis (OM) with a segmental bone defect has been estimated at USD 156 818 (95 % CI: USD 112 970–217 685) (Norris et al., 2021). This estimate was based on index surgery costs, perioperative costs (including costs associated with bleeding; infectious complications, such as pneumonia; cardiovascular and renal complications; other complications; length of hospital stay; operating room time; and total index hospital costs), and post-operative costs during a 12-month window after surgery (Norris et al., 2021), using the Premier Healthcare and MarketScan databases.
Despite the substantial impacts of COM on patient outcomes and entire health systems, the overall incidence of COM in the United States is not well defined, with many prior studies emphasizing acute or general forms of OM. Previously, population-based OM incidence was reported among residents in Olmsted County, Minnesota, between 1969 and 2009 (Kremers et al., 2015). The study found an overall age- and sex-adjusted OM incidence rate of 21.8 per 100 000 person-years (Kremers et al., 2015). Even though this was the first study to provide an insight into OM incidence at a population level, the results provide limited context about (1) the impact of diagnostic quality over time (extending back to 1969) on OM incidence; (2) the distinction, if any, between acute and chronic OM; and (3) the relationship of competing or contributing risks – such as diabetes and fractures – over time in this population.
Due to the lack of an established OM registry or another comprehensive data source to assess national OM incidence, other studies have emphasized OM-related national hospital admission rates for adults and children, usually for specific anatomic sites (Henke et al., 2005; Shaikh et al., 2021; Schmidt et al., 2023; Issa et al., 2018). Vertebral-OM-related national hospital admissions were estimated at 5.4 admissions per 100 000 patients in 2013 (Henke et al., 2005), while foot- and toe-OM-related hospital admissions were estimated at 9 admissions per 10 000 patients per year (Issa et al., 2018). However, because these estimates identified OM in inpatient settings, the results may underestimate OM diagnosed or treated exclusively in outpatient settings and may, thus, underestimate OM incidence overall.
There is a need to better characterize the epidemiology of COM across centers over time. In this study, we computed bacterial COM incidence rates in a large, multicenter dataset for each year between 1 January 2016 and 31 December 2022 and identified patterns in COM incidence stratified by geographic and patient-level characteristics.
Methods
2
Data source and study population
2.1
We used the TriNetX network database, a real-world data source based in the United States, which consists of anonymized electronic medical record data from a network of approximately 80 healthcare organizations (TriNetX, 2024). The majority of the network's healthcare organizations are adult acute-care hospitals with many locations and large academic medical institutions with both inpatient and outpatient services (TriNetX, 2024). The study population included all adult patients ( 18 years) recorded in the multicenter TriNetX network research database between 1 January 2016 and 31 December 2022.
COM case definition, identification, and classification
2.2
A bacterial COM case was defined as any of the following ICD-10 codes recorded between 1 January 2016 and 31 December 2022: M86.3-86.6 and M46.2 (Table S1 in the Supplement). To reduce duplication of patients for whom ICD-10 codes may have been recorded multiple times (e.g., across healthcare encounters during treatment or upon relapse or recurrence), only the first documented ICD-10 code for each patient within the study period was used. We excluded codes specific to fungal and mycobacterial COM, as the diagnosis and treatment of these infections differ significantly from most common causes of bacterial COM. ICD-10 codes were used, whenever possible, to further classify cases based on COM anatomic sites, including upper-extremity, lower-extremity, vertebral column, and other (skull, ribs, sternum, and unspecified site) sites.
Covariates
2.3
Additional covariates included from the TriNetX database were age, sex, race/ethnicity, marital status, hospital region, and the following chronic conditions (using ICD-10 codes as outlined in Table S2): diabetes, hypertension, cardiovascular disease, chronic liver disease, chronic kidney disease, chronic lung disease, cerebrovascular disease, and chronic neurological condition. All covariates were assessed at baseline, i.e., at the time of the COM diagnosis. Chronic conditions could be present at or any time prior to the time of the COM diagnosis.
Data analysis
2.4
Baseline categorical characteristics were summarized as frequencies and percentages. To estimate the overall incidence of COM in the multicenter TriNetX database, we calculated the incidence of overall COM, anatomic-site-specific COM, and hospital-region-specific COM per 1000 adult patients recorded in the database (COM cases/population at risk) for each year from 2016 through 2022. Age- and sex-specific incidence of overall COM and anatomic-site-specific COM were also computed. We calculated the 95 % confidence intervals (CIs) for all estimates. Additionally, treating the year of diagnosis as an ordinal variable, we used the Cochran–Armitage test for trend to investigate potential trends in overall and stratum-specific COM incidence across the study period. We used a prespecified -value threshold of 0.05 for statistical testing. This analysis was done using SAS version 9.4 (SAS Institute Inc., 2013).
Results
3
We identified a total of 93 324 adult patients with COM documented in the TriNetX database between 1 January 2016 and 31 December 2022 from approximately 80 healthcare organizations. The majority of affected patients were male (64.16 %). Lower-extremity COM was the most common anatomic site (44.87 %). Demographic and clinical characteristics for patients with COM are shown for each year of the study in Table 1; overall age and sex distributions in the TriNetX database are shown in Table S3.
COM incidence in the TriNetX database
3.1
Overall, we observed a steady COM incidence rate over time (0.44–0.72 per 1000 patients recorded in the TriNetX database), with some indication of lower rates between 2020 and 2022 (Table S4 and Fig. 1). Males had a higher COM incidence compared to females (0.71–1.14 vs. 0.28–0.46 per 1000 patients). We also found steady COM trends across age groups. Patients aged 50 to 59 had a minor, non-significant reduction in the trend starting in 2019 ( ), while patients aged 70 or older appeared to have slightly increasing incidence over time (Table S4 and Fig. 2).
Overall and sex-specific incidence of chronic osteomyelitis (COM) per 1000 adult patients recorded in the multicenter TriNetX database (2016–2022).
Age-specific COM incidence per 1000 adult patients recorded in the multicenter TriNetX database (2016–2022).
Region-specific COM incidence
3.2
COM incidence differed by region, and regional COM incidence varied over the study period. The Southern United States had the highest COM incidence (0.51–0.85 per 1000 adult patients), whereas the Midwestern United States had the lowest COM incidence (0.49–0.64 per 1000 adult patients) (Table 2). All regions experienced a reduction in incidence between 2019 and 2020.
Anatomic-site-specific COM incidence
3.3
COM trends also differed by anatomic site. Lower-extremity COM had the highest incidence (0.19–0.34 per 1000 adult patients), followed by vertebral COM (0.16–0.24 per 1000 adult patients) (Table 2). While vertebral COM incidence remained stable during the initial onset of the COVID-19 pandemic (between 2019 and 2020), we observed a slightly decreasing trend of lower-extremity COM and upper-extremity COM incidence during that time (Table 2).
In general, males and patients aged 50–59 and 60–69 years had a higher incidence of all types of anatomical-site-specific COM (Tables S5 and S6), and males had a higher incidence of lower-extremity COM compared to other subtypes (Table S5). In female patients, vertebral COM and lower-extremity COM had comparable incidence, although vertebral COM appeared to become slightly more common than lower-extremity COM among females starting in 2020 (Table S5). Likewise, in patients aged 50–59 and 60–69 years, site-specific COM trends were generally steady over time, except for slight decreases observed starting in 2020 (Table S6). In contrast, patients aged 80 had a slightly increasing trend in lower-extremity and vertebral COM between 2016 and 2022 (Table S6).
Discussion
4
Our evaluation of COM incidence trends in the TriNetX database between 2016 and 2022 revealed a slight decline in overall COM incidence starting in 2020. While there are no published reports that compare COM diagnosis trends before and during the COVID-19 pandemic, many existing studies assess the change in a major COM risk factor (i.e., trauma) during the pandemic (Sutherland et al., 2020; Patwary and Khattak, 2023; Yasin et al., 2021a; Hughes et al., 2023; Yasin et al., 2021b; Vandoros, 2022). Investigations from Tennessee, California, Florida, New York, and Massachusetts showed 15 %–49 % reductions in road traffic during the pandemic (2020) compared to a pre-pandemic period (Patwary and Khattak, 2023; Sutherland et al., 2020; Hughes et al., 2023). Meanwhile, a moderate negative correlation in vehicle collisions and vehicle injuries ( ) between 2019 and 2020 was observed in Florida, New York, and Massachusetts (Sutherland et al., 2020). Globally, reports from different countries, including China, the United Kingdom, Spain, the United Arab Emirates, and Greece, showed similar reductions in road traffic and trauma treatment during the pandemic (Yasin et al., 2021a, b; Vandoros, 2022). This reduction in vehicle collisions and crashes may be expected to reduce the overall risk for trauma-associated COM.
Similarly, competing events, such as death during the COVID-19 pandemic, might have affected the observed rates during this period, especially as COVID-19 mortality was strongly associated with diabetes, a major risk factor for COM (Lv et al., 2022; Yao et al., 2023), especially COM involving the lower extremities. An assessment of diabetes-related deaths between 2006 and 2021 found a 30 % increase in mortality during the pandemic (Lv et al., 2022). In another investigation examining death data between 2018 and 2022, similar findings were reported, with a 47.6 % increase in deaths observed where diabetes was one of multiple contributing causes (Yao et al., 2023).
Furthermore, the decline in overall COM incidence between 2019 and 2022 may be attributed to delays in COM diagnosis, which might have been caused or exacerbated by healthcare system overload. In a survey conducted in June 2020, 40.9 % of respondents reported delaying or avoiding healthcare for either emergency or routine care (Czeisler et al., 2020). In another assessment, a 10 % decline in United States emergency room visits for diabetes-related emergencies between March and May 2020 was reported (Lange et al., 2020). Globally, French and Canadian population-based analyses showed reductions in diabetic foot ulcer hospitalization, OM, and revascularization procedures during the pandemic compared to the pre-pandemic period (Mariet et al., 2021; de Mestral et al., 2022).
Our study's findings are generally consistent with prior research, including the demonstration of higher rates of COM among males compared to females and increasing rates of COM with age (Kremers et al., 2015; Walter et al., 2021). However, prior data showed a higher COM incidence among patients aged 80 years or older (Kremers et al., 2015), while our data demonstrated higher COM incidence rates among patients aged 50 to 69 years old for whom occupational or motor vehicle trauma and diabetes-related foot ulcers may be more common. This is supported by an analysis of the United States Diabetes Surveillance System Database (USDSSD), which showed an increasing trend of diabetes diagnosis between 2000 and 2022, with the highest reported trend among patients aged 65 or older (Nwachukwu et al., 2023).
We observed a higher incidence of COM in the southern region of the United States. To our knowledge, this study is the first to investigate regional COM trends in the United States, so it is unknown if this finding is consistent with previously examined OM data. However, regional distributions of COM-related risk factors strongly support this result (Nwachukwu et al., 2023). In the USDSSD study described above, the southern region had the highest reported diabetes diagnosis trend (Nwachukwu et al., 2023); this could explain the difference between our findings and the prior examination of OM in a county in the Midwestern United States (Kremers et al., 2015). Additionally, in an analysis of the National Hospital Ambulatory Medical Care Survey of nonfederal, general, and short-stay hospitals between 2017 and 2018, the southern region had the highest rates of motor-vehicle-accident-related emergency department visits (13.6 visits per 1000 persons) (Davis and Cairns, 2021), a difference which could contribute to trauma-related COM.
In our site-specific COM incidence assessment, lower-extremity COM had the highest incidence both overall and among males over time, while among females, vertebral and lower-extremity COM had comparable incidence with a possible shift toward vertebral COM beginning in 2020. Anatomic-site-specific COM incidence trends have not been previously established, although our findings align well with prior limited evidence. Our findings are consistent with a German investigation of lower-extremity OM burden between 2008 and 2018 (Walter et al., 2021). Different rates in lower-extremity trauma or diabetes may have contributed to the observed differences in site-specific COM incidence between males and females. Although we are unable to conclusively distinguish between subtypes of lower-extremity COM (e.g., long bone vs. foot), we expect this category to include a large number of cases of foot COM among patients with diabetes, and national diabetes statistics show a higher prevalence of diabetes among men compared to women (CDC, 2024). Meanwhile, an analysis of the Nationwide Inpatient Sample database showed a comparable incidence of vertebral OM admissions between males and females (Issa et al., 2018); this is in contrast to our findings, which demonstrated a higher incidence of vertebral COM among males than females. Furthermore, the stable incidence of vertebral COM among females throughout the pandemic might imply a minor increase in incidence, assuming that the pandemic had an equivalent impact on diagnosis rates of all COM subtypes in males and females.
There are some potential limitations to our study. First, COM incidence trends calculated from an electronic medical record database may not be representative of the general population. Incidence rates calculated within the TriNetX network, which is primarily composed of acute-care hospitals with multiple locations and large academic medical centers, may overestimate the incidence compared to other regional and community hospitals. This difference may be offset, at least in part, by the use of codes specific to COM in this study, which may underestimate COM in some cases (e.g., silent or undiagnosed COM or misclassification of COM as acute or unspecified OM). Furthermore, this study examines incidence trends within clinically and epidemiologically relevant strata (e.g., sex) over time. In the absence of another population-based OM dataset, our large, multicenter, and multi-region analysis provides an important steppingstone toward understanding national COM trends; however, further research is needed.
Second, we acknowledge that ICD-10 codes are less reliable for identifying COM cases compared to direct chart review or prospective studies, where more precise microbiological or histopathological findings may be recorded (Panteli and Giannoudis, 2016), and provide a less detailed characterization of other diagnostic features (e.g., distinctions between anatomic sites, such as long-bone COM in the lower extremities compared to foot COM; direct correlation with previous fractures or hardware placements at the same anatomic site; or consistently available information about microbiological causes). Direct comparison of ICD-10 codes against detailed patient records or diagnostic reasoning for individual cases was not feasible because of the anonymized nature of the data source. However, an analysis of TennCare Medicaid program data previously demonstrated that ICD codes have reasonable reliability for identifying OM (Wiese et al., 2018). Furthermore, we cannot directly assess changes in ICD coding practices over time, although we restricted our analysis to 2016–2022 to circumvent the impact of the healthcare coding system transition from ICD-9 to ICD-10 prior to 2016. While some conditions may have similar classifications in ICD-9 and ICD-10, this is not the case for OM. For example, unlike ICD-9, ICD-10 includes a code for vertebral OM.
Finally, we note that we deliberately included chronic recurrent multifocal osteomyelitis (CRMO), a rare autoimmune disease that mostly affects children and adolescents (Zhao et al., 2021) in our analysis. CRMO is exceptionally rare in adults (Yılmaz and İncesoy, 2024) and is a diagnosis of exclusion that requires ruling out an infectious cause, which is clinically difficult to achieve because pathogen identification is often difficult, even in bacterial COM (García Del Pozo et al., 2018a; Lew and Waldvogel, 2004). Thus, in ICD-10 coding data for adult patients, CRMO cannot be reliably distinguished from bacterial COM. Although CRMO accounts for about 4 % of all COM cases included in our incidence calculations, this decision could lead to minor overestimations in some rates. Despite these weaknesses, this study addresses a crucial question about COM and fills a significant knowledge gap about COM epidemiology and clinical care needs in the United States.
Conclusions
5
COM incidence in the TriNetX database was generally steady over the 2016–2022 period, with a possible slight reduction during the COVID-19 pandemic (after 2019). This study offers a unique snapshot of how the pandemic may have affected COM trends in the United States, particularly in terms of underlying risk factors, delays in diagnosis, and competing events. In addition, our results demonstrate the importance of vertebral COM, along with lower-extremity COM, in health systems and orthopedic infectious disease care in the United States.
Supplement
10.5194/jbji-10-377-2025-supplementThe supplement related to this article is available online at https://doi.org/10.5194/jbji-10-377-2025-supplement.
The reference list from the paper itself. Each links out to its DOI / PubMed record.
- 1Akiyama T Chikuda H Yasunaga H Horiguchi H Fushimi K Saita K Incidence and risk factors for mortality of vertebral osteomyelitis: a retrospective analysis using the Japanese diagnosis procedure combination database BMJ Open 3e 00241210.1136/bmjopen-2012-0024122013 PMC 361274223533214 · doi ↗ · pubmed ↗
- 2CDC: National Diabetes Statistics Report Centers for Disease Control and Prevention (CDC)2024 last access: 12 Aug 2024 https://www.cdc.gov/diabetes/php/data-research/index.html
- 3Czeisler M Marynak K Clarke KEN Salah Z Shakya I Thierry JM Ali N Mc Millan H Wiley JF Weaver MD Czeisler CA Rajaratnam SMW Howard ME Delay or Avoidance of Medical Care Because of COVID-19-Related Concerns – United States, June 2020 MMWR Morb Mortal Wkly Rep 691250125710.15585/mmwr.mm 6936 a 4202032915166 PMC 7499838 · doi ↗ · pubmed ↗
- 4Davis D Cairns C Emergency Department Visit Rates for Motor Vehicle Crashes by Selected Characteristics: United States, 2017–2018 NCHS Data Brief 41018202134191706 · pubmed ↗
- 5de Mestral C Gomez D Wilton AS Lee DS Albalawi Z Austin PC Jacob-Brassard J Urbach DR Al-Omran M Baxter NN A Population-Based Analysis of Diabetes-Related Care Measures, Foot Complications, and Amputation During the COVID-19 Pandemic in Ontario, Canada JAMA Netw Open 5e 214235410.1001/jamanetworkopen.2021.42354202234985514 PMC 8733837 · doi ↗ · pubmed ↗
- 6García Del Pozo E Collazos J Cartón JA Camporro D Asensi V Bacterial osteomyelitis: microbiological, clinical, therapeutic, and evolutive characteristics of 344 episodes Rev Esp Quimioter 31217225201829756429 PMC 6166254 · pubmed ↗
- 7Henke PK Blackburn SA Wainess RW Cowan J Terando A Proctor M Wakefield TW Upchurch Jr.GR Stanley JC Greenfield LJ Osteomyelitis of the foot and toe in adults is a surgical disease: conservative management worsens lower extremity salvage Ann Surg 24188589210.1097/01.sla.0000164172.28918.3f 200515912038 PMC 1357594 · doi ↗ · pubmed ↗
- 8Hughes JE Kaffine D Kaffine L Decline in Traffic Congestion Increased Crash Severity in the Wake of COVID-19Transp Res Rec 267789290310.1177/03611981221103239202337153182 PMC 10149483 · doi ↗ · pubmed ↗