Sparse polygenic risk score inference with the spike-and-slab LASSO
Junyi Song, Shadi Zabad, Archer Yang, Simon Gravel, Yue Li

TL;DR
This paper introduces SSLPRS, a new method for predicting disease risk from genetic data that improves accuracy and efficiency compared to existing approaches.
Contribution
SSLPRS bridges Bayesian and penalized regression methods using the Spike-and-Slab LASSO for sparse polygenic risk score inference.
Findings
SSLPRS shows up to 50% improvement in positive predictive value in simulations.
Selected variants are enriched for meaningful genomic annotations in real data.
SSLPRS outperforms existing methods in variable selection for sparse genetic architectures.
Abstract
Large-scale biobanks, with rich phenotypic and genomic data across hundreds of thousands of samples, provide ample opportunities to elucidate the genetics of complex traits and diseases. Consequently, there is growing demand for robust and scalable methods for disease risk prediction from genotype data. Inference in this setting is challenging due to the high-dimensionality of genomic data, especially when coupled with smaller sample sizes. Popular Polygenic Risk Score (PRS) inference methods address this challenge by adopting sparse Bayesian priors or penalized regression techniques, such as the Least Absolute Shrinkage and Selection Operator (LASSO). However, the former class of methods are not as scalable and do not produce exact sparsity, while the latter tends to over-shrink large coefficients. In this study, we present SSLPRS, a novel PRS method based on the Spike-and-Slab LASSO…
Genes, proteins, chemicals, diseases, species, mutations and cell lines named across the full text — each resolved to its canonical identifier and authoritative record.
Click any figure to enlarge with its caption.
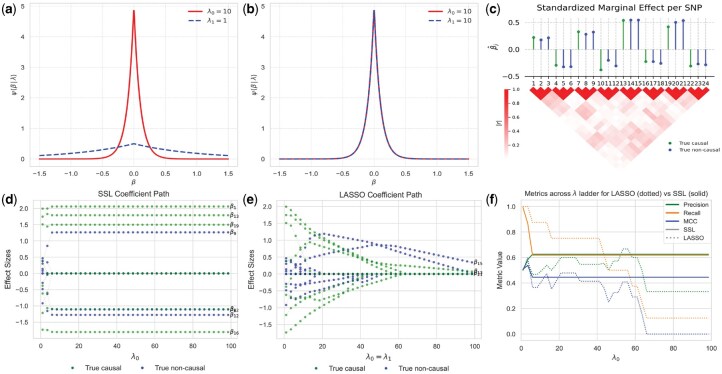 Figure 1
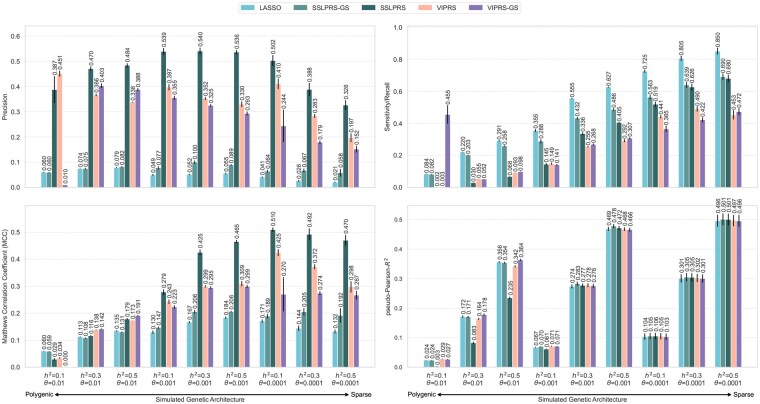 Figure 2
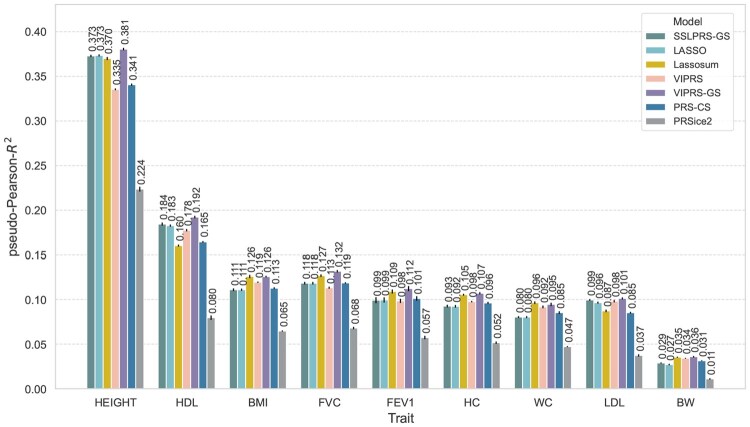 Figure 3
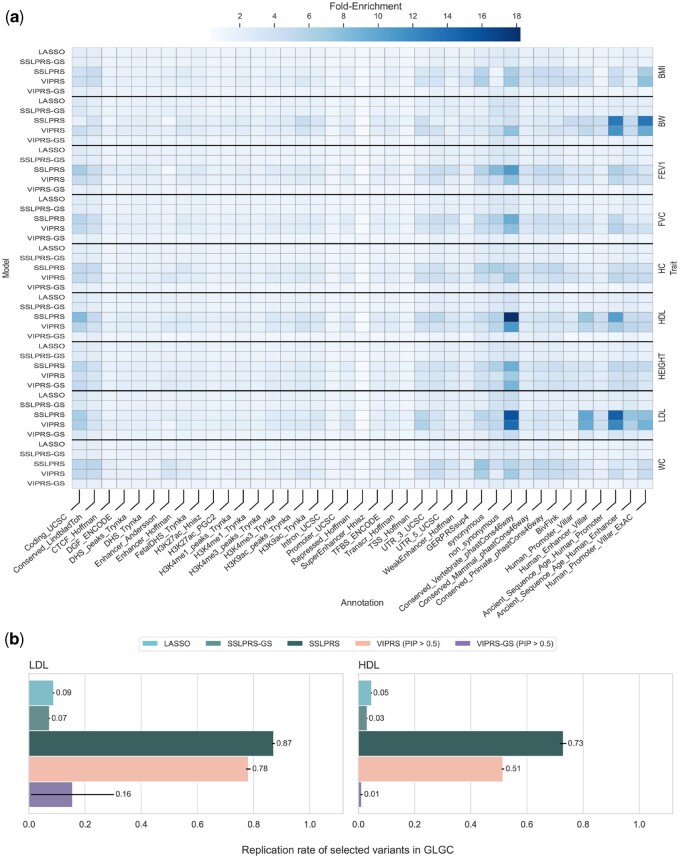 Figure 4
- —Canada Research Chair
- —Machine Learning for Genomics and Healthcare
- —Natural Sciences and Engineering Research Council
Peer Reviews
No public reviews on file for this paper yet. If you reviewed it on a platform where reviews are public (OpenReview, ICLR, NeurIPS, ICML), you can paste yours below so the community can read it here.
Videos
No videos yet. Explain this paper in a talk, walkthrough, or lecture? Add one.
Taxonomy
TopicsGene expression and cancer classification · Genetic Associations and Epidemiology · Genetic and phenotypic traits in livestock
1 Introduction
Polygenic risk scores are emerging as an important tool to quantify the heritable component of complex traits and diseases, with an array of promising clinical applications, including genetic risk stratification and personalized medicine (Torkamani et al. 2018, Lewis and Vassos 2020). However, inference of polygenic scores from large-scale Genome-wide Association Study (GWAS) data is practically challenging due to two main factors. First, due to privacy concerns, individual-level data is rarely publicly available, and consequently, inference has to be carried out using “GWAS summary statistics” (Pasaniuc and Price 2017), which are the marginal association statistics per variant, coupled with Linkage-Disequilibrium (LD) matrices that record the pairwise correlations between variants in the dataset. The second factor is the ultra high-dimensional nature of genetic data, with modern biobank initiatives routinely measuring and imputing data for upwards of 20 million genetic markers (Karczewski et al. 2024). Considering that GWAS sample sizes, even for the largest meta-analyses, rarely exceed two million samples (Zhou et al. 2022), this setup calls for robust and scalable regularized or Bayesian regression frameworks.
Previous work has explored various statistical and algorithmic approaches to meet these challenges (Jayasinghe et al. 2024). This includes sparse penalized regression methods, such as Lassosum (Mak et al. 2017), as well as a wide array of sparse Bayesian priors, including Horseshoe (PRScs) (Ge et al. 2019), Spike-and-slab (LDPred, VIPRS) (Privé et al. 2020, Zabad et al. 2023), and sparse mixture priors (SBayesR, MegaPRS) (Lloyd-Jones et al. 2019, Zhang et al. 2021). While the overall prediction accuracy of these methods is roughly comparable (Pain et al. 2021, Zabad et al. 2023), they can differ substantially in terms of computational resource utilization, the quality of selected variables, and the statistical properties of their inferred effect sizes. On typical GWAS datasets with 1 million genetic variants, total wallclock time ranges from 15 min for optimization-based approaches (VIPRS) to several hours for Markov-Chain Monte-Carlo (MCMC)-based Bayesian methods (PRScs) (Zabad et al. 2023). While Bayesian methods can provide accurate and unbiased effect sizes estimates, their coefficients are not truly sparse, which can complicate interpretation and deploying these predictors in some practical settings. On the other hand, traditional penalized regression methods such as the LASSO provide sparse effect sizes estimates, but they are known to over-shrink large coefficients, thus introducing a bias (James et al. 2019).
Here, we bridge the gap between sparse Bayesian methods and traditional penalized regression approaches by developing and testing a new PRS model based on the recently proposed Spike-and-slab LASSO (SSL) prior (Ročková and George 2018). The SSL prior is a mixture of two Laplace densities that together form a non-concave penalty, and through posterior mode estimation, small coefficients are shrunk to exactly zero while preserving larger effect sizes. In addition to fast coordinate-ascent inference algorithms, the SSL prior comes with many attractive theoretical properties and, depending on the setting of its hyperparameters, can smoothly interpolate between the LASSO and Spike-and-slab priors (Ročková and George 2018, Bai et al. 2021). Our contributions include the following: (i) Deriving a version of the SSL inference algorithms that operates on GWAS summary statistics. (ii) Providing a fast and memory-efficient software implementation in the open-source penprs package, incorporating state-of-the-art techniques (Zabad et al. 2025) for scaling PRS inference to millions of genetic markers. (iii) Examining the statistical and computational performance of the SSLPRS model on both simulated data and real quantitative phenotypes in the UK Biobank (Bycroft et al. 2018). The package also includes a new implementation of the LASSO model that takes advantage of highly optimized data structures and algorithms (Zabad et al. 2025), which improves its runtime by more than an order of magnitude compared to the original version (Lassosum) (Mak et al. 2017, Zabad et al. 2023).
2 Materials and methods
2.1 Overview of SSLPRS
In a sample of n individuals with paired genotype and phenotype data of p variants, the standard linear model is used to parameterize the dependence of phenotype on the genotype,
where y is an 1 vector of phenotypic measurements for each individual, is an genotype matrix, is a vector of effect sizes per variant, and is an vector representing the residual effects of the phenotype for each individual. We adapted the SSL framework (Ročková and George 2018), originally operating on individual level data, to support GWAS summary statistics for polygenic risk prediction.
The SSL prior primarily consists of two Laplace densities, to model the “spike” and the “slab” respectively. This formulation facilitates the adaptive shrinkage of variants based on their covariance and the associations with the target phenotype:
where .
Typically, the scale parameters are chosen such that , so is diffuse, representing a slab with respect to the spiky that is dense around zero. The Laplace distributions of the prior introduce essentially two LASSO components where effect sizes of variants assigned to the “spike” component can be driven to exact sparsity by a strong penalty, whereas those in the “slab” component undergo usually minimal shrinkage by a relatively weaker penalty. Here, denotes the mixing proportion, and the shared prior in Equation (2) renders the SSL penalty non-separable, enabling SSL to borrow information across coefficients and adapt to sparsity patterns (Ročková and George 2018, Bai et al. 2021). The prior on can be parameterized on by marginalizing out :
The selection of and , specifically the ratio places SSL on the continuum of the LASSO case and the ideal spike-and-slab (Fig. 1a). In the case where or , SSL simplifies to the LASSO penalty (Fig. 1b). On the other hand, choosing gives a theoretical point-mass spike (Ročková and George 2018).
Overview of the statistical properties and inference dynamics of the SSL and LASSO on simulated genetic data. (a, b) Illustration of the densities ψ(β|λ0), ψ(β|λ1) of the SSL prior with (a) λ0=10 and λ1=1 (b) λ0=λ1=10, which reduces to the LASSO case. (c) Simulated genetic data with 24 genetic variants with block-diagonal correlation structure. In this setup, 8 of the variants are causal (green) while 16 are non-causal (blue). Marginal effect sizes are shown in the top panel and absolute pairwise correlations between the variants are shown in the bottom panel. (d, e) Effect size estimates of (d) SSL and (e) LASSO models are shown along a ladder of increasing λ0 values. Ground truth causal and non-causal variants are distinguished as indicated in the legend. Non-zero effect size estimates at the end of λ ladder are labeled with their corresponding index. (f) Variable selection metrics, including precision, recall, and Matthews Correlation Coefficient (MCC), for the LASSO and SSL models across the λ ladder.
2.2 SSLPRS inference
Ročková and George (2018) and Moran et al. (2019) introduced an efficient coordinate ascent Maximum A Posteriori (MAP) algorithm for SSL. In this work, we developed an improved framework of the coordinate ascent algorithm with support for GWAS summary statistics, alongside inference optimizations. The objective function is the log posterior, under the assumptions that both the genotype matrix and phenotype vector have been standardized column-wise for unit variance and zero mean for GWAS summary statistics:
where N is the GWAS sample size. denotes the standardized marginal GWAS effect size for SNP j with as the jth column of . defines the Linkage Disequilibrium (LD) matrix with . The last term in Equation (SSLPRS inference) is the separable spike-and-slab Lasso penalty (Ročková and George 2018):
In high-dimensional analysis, the posterior is likely to be multi-modal. The Karush–Kuhn–Tucker (KKT) conditions, coinciding with the standard LASSO estimate criteria (Zhao and Yu 2006), provide only the necessary condition for to be a global mode under the SSL prior, expressed as soft-thresholding on . Sufficient conditions require the filtering of sub-optimal local modes, achieved through hard-thresholding with (Zhang and Zhang 2012, Ročková and George 2018, Moran et al. 2019). Combining these conditions gives
and corresponds to the partial derivative of pen with respect to (Ročková and George 2018), and is expressed as:
Here, , which can be approximated (Moran et al. 2019) by:
In our initial experiments, we found that fitting SSLPRS with sparse LD matrices may encounter numerical instabilities, due to the fact that these matrices lose their positive semi-definite (PSD) property (Zabad et al. 2025). To ensure stability, we introduced , a quantity derived from spectral properties of the LD matrix, in Equation (7) to regularize the update and avoid modes aligned with negative eigenvalues (details in Methods 3.5, available as supplementary data at Bioinformatics online).
The global mode can subsequently be determined through an efficient coordinate ascent algorithm (Algorithm 1), applied to summary statistics, by iteratively updating the model parameters until convergence. By Lemma 4 from (Ročková and George 2018), can be approximated by
where is the number of non-zero coefficients.
In this work, we kept constant as a hyperparameter. A variation of the coordinate ascent algorithm is the unknown variance case (Bai et al. 2021), which we present in full for summary statistics in the Methods 3.3, available as supplementary data at Bioinformatics online.
Algorithm 1SSLPRS Coordinate Ascent1: Input: 2: Initialize of 3: for k in 1 … do 4: Update by Equation (10)5: for j in 1 …p do 6: Update each with Equation (7)7: if M updates of have occurred then 8: Update by Equation (12)9: end if 10: end for 11: if then 12: break13: end if 14: end for
Algorithm 2SSLPRS Dynamic Warm-start.1: Input: and ladder of 2: Initialize of 3: for do 4: Initialize 5: Run coordinate ascent with Algorithm 1.6:
7: end for
2.3 Hyperparameter choices
The default SSLPRS model operates on the fixed variance case, where we set based on the assumption that the data is standardized. For hyperparameters a, b in the update, we set and so the beta prior mean is 0.05 [Equation (2)], reflecting an estimate of 5% causality in the dataset. The selection of penalty values scales with the data through , which is the maximum penalty LASSO can take before all effect sizes are shrunk to zero (Friedman et al. 2010). To ensure that the slab is sufficiently diffuse, is set to , where . In the single-fit case, is scaled to be or 10% of . is set to the minimum value for the LD matrix to remain positive semi-definite and numerically stable (Zabad et al. 2025). Details of hyperparameter choices and corresponding ablation analyses can be found in Results 4.3, available as supplementary data at Bioinformatics online.
2.3.1 Dynamic posterior exploration
Since the choice of hyperparameters and greatly affects the shrinkage and degree of the spike and slab formulation of SSLPRS on the continuum between LASSO and the point mass spike and slab, optimizing the performance requires a precise selection of these hyperparameters. (Ročková and George 2018) detailed a dynamic posterior exploration strategy, where a ladder of gradually increasing values are selected while is kept at a sufficiently diffuse value relative to the choices of in the ladder. The initial value in the ladder is typically selected such that , which makes the objective (Eq. SSLPRS inference) convex (Bai et al. 2021). The convex solution can be used as a “warm-start” for non-convex problems, which occurs when . In particular, after fitting each on the ladder with Algorithm 1, the MAP estimation of , along with model parameters are used to “warm-start” the fit for (Algorithm 2).
Our experiments show that becomes the minimum penalty beyond which all negligible coefficients would be set to zero (Friedman et al. 2010), essentially “converging” along the coefficient path of the ladder. This also provides a strict range of values to search in for hyperparameter tuning. By default, SSLPRS performs a warm-start exploration on a 20-step scaled ladder from to , which does not require grid search.
2.3.2 Hyperparameter search
In the grid-search (SSLPRS-GS) case, hyperparameter search is conducted independently for each chromosome, where effect size estimates are taken from the best performing value of the warm-start ladder on the validation set. Since warm-start is performed to the end of the ladder, SSLPRS can be concurrently fit as well. Hyperparameters a, b are kept at their default setting of and is set fixed to 1.
2.4 Baseline models and their specifications
To assess the relative performance of the SSLPRS model on real GWAS data, we compared it to a baseline C + T method PRSice2 (Choi and O’Reilly 2019), and three state-of-the-art PRS inference methods: Lassosum (Mak et al. 2017), VIPRS (Zabad et al. 2023) and PRS-CS (Ge et al. 2019). Lassosum imposes a single Laplace density, i.e. penalty, on the effect sizes and performs coordinate ascent on the penalized loglikelihood to estimate the coefficients. VIPRS uses a Gaussian Spike-and-slab prior and uses Coordinate Ascent Variational Inference (CAVI) to approximate the posteriors. PRS-CS assigns a continuous shrinkage prior and performs Gibbs sampling. Comparisons with Lassosum and VIPRS are particularly informative, as SSL can theoretically interpolate between their respective formulations, thereby highlighting its statistical flexibility and computational properties (Ročková and George 2018). At the same time, evaluating against PRSice2 and PRS-CS provides a complementary baseline for widely used and state-of-the-art alternatives.
To enable fair comparisons, we included our optimized implementation, LASSO, of Lassosum (Mak et al. 2017) using optimizations described in Methods 3.6, available as supplementary data at Bioinformatics online, as provided in the open source software package penprs v0.0.1. By default, the LASSO performs coordinate ascent inference using the pathwise algorithm (Friedman et al. 2010), on a grid of 20 values for the penalty hyperparameter , ranging from to on a scale. Lassosum used a 20 point grid grid on a log-scale from 0.001 to 0.1. For the VIPRS method (Zabad et al. 2023, 2025), we tested the standard EM algorithm that does not require any hyperparameter tuning as well as a grid-search (VIPRS-GS) version that tunes the hyperparameter , which corresponds to the prior mean on the proportion of causal variants. We used a 20 point grid for on a scale from to , where p is the number of variants used during inference. For PRS-CS, we used the auto variant where the hyperparameter is inferred automatically. All models were run with four threads using parallelism when available.
2.5 UK biobank data
2.5.1 Real phenotype analyses
To empirically examine the performance of SSLPRS on real complex traits and diseases, we leveraged paired genotype and phenotype data from 337 205 unrelated White British samples in the UK Biobank (Bycroft et al. 2018). We briefly summarize below the data pre-processing and Quality Control (QC) pipeline that was described in detail in earlier reports by the same group (Zabad et al. 2023, 2025), resulting in a set of 1 093 308 high quality SNPs used in subsequent analyses.
The genotype data, which represents the features used for prediction, was extracted by applying standard quality control filters along the sample and variant dimensions. For the complex traits, which represent the target of our predictors, we extracted measurements for nine quantitative phenotypes for the White British samples described earlier. The phenotypes are standing height (HEIGHT), body mass index (BMI), hip circumference (HC), waist circumference (WC), birth weight (BW), Forced Vital Capacity (FVC), Forced Expiratory Volume in the first second (FEV1), High-density Lipoprotein (HDL), and Low-density Lipoprotein (LDL). The detailed pipeline is described in Methods 3.1.2, available as supplementary data at Bioinformatics online.
To facilitate robust analyses of the predictive performance of the SSLPRS and baseline models, we performed 5-fold cross-validation per phenotype. In each round, 80% of the data was used for training the models while the remaining 20% are used for testing; the training set was further split into 90% training and 10% validation for models requiring hyperparameter tuning. We performed genome-wide association testing within each split and generated GWAS summary statistics for the training, validation, and test sets. The 5-fold cross-validation GWAS data are available at https://zenodo.org/records/14612130. The association testing within each split was done with plink2 (Chang et al. 2015).
Finally, we utilized Linkage-Disequilibrium (LD) matrices for European samples to record pairwise correlations between genetic variants published in a recent study (Zabad et al. 2025), where they served as input to PRS inference methods: https://shz9.github.io/viprs/download_ld/. The matrices were estimated from 362 446 unrelated European samples in the UK Biobank (Bycroft et al. 2018).
2.5.2 Simulation experiments
To assess the variable selection performance and capabilities of the SSLPRS model under controlled conditions, we used the magenpy v0.1.5 package (Zabad et al. 2023, 2025) to simulate phenotype data for the UKB participants described above according to a variety of genetic architectures. The phenotypes were simulated using heritability values , and causal proportion of variants , for a total of 9 simulation settings. Note that the magenpy simulator draws effect sizes according to the Gaussian spike-and-slab generative model (Zabad et al. 2023). We’ve also included a mixture of normals simulation in Fig. 5, available as supplementary data at Bioinformatics online. For each setting, we simulated five independent replicates, for a total of 45 simulated phenotypes. The magenpy simulator outputs the true causal variants and their effect sizes, and this information was used to examine the variable selection accuracy of each method.
To examine predictive performance in the simulation experiments, the UKB samples were split into 70% training, 15% validation, and 15% testing. The validation set was used for hyperparameter tuning of the grid search (GS) models. These sub-cohorts were then used to perform GWAS using plink2 (Chang et al. 2015) to obtain marginal association statistics.
2.6 Evaluation metrics and criteria
We evaluated the SSLPRS and baseline models based on a number of metrics that account for both computational and statistical performance. The statistical evaluation criteria include prediction accuracy on held-out test sets as well as a number of metrics that quantify variable selection accuracy. In the context of our simulation analyses, the latter includes metrics such as precision ( ), recall ( ), and the Matthews Correlation Coefficient (Ročková and George 2018) which accounts for all confusion matrix components and thus offers a balanced measure of selection accuracy. Here, TP refers to true positives, TN true negatives, FP false positives, and FN false negatives. For Bayesian models like VIPRS, we experimented with different Posterior Inclusion Probability (PIP) thresholding for variable selection (Results 4.3.6, available as supplementary data at Bioinformatics online) and found that selecting variants with the median rule of PIP (Ishwaran and Sunil Rao 2005) worked the best.
To assess the biological significance and replicability of the selected variants, we measure the fold enrichment, defined as
for quantifying the relative concentration of selected variants within a specific annotation compared to their prevalence in the overall background, and the replication rate, which is the proportion of selected variants that is also considered significant in an separate, independent study.
For the grid-search models, we evaluated the prediction performance of hyperparameters in terms of the proportion of variance explained (R-squared). Given a set of inferred coefficients , the R-Squared on the validation set can be approximated from GWAS summary statistics via the pseudo- metric (Mak et al. 2017, Zabad et al. 2023):
where are the standardized marginal GWAS effect sizes from the test set and is the corresponding LD matrix. Although pseudo- offers superior discriminating power for hyperparameter selection, it can be problematic when sparsified LD matrices are used to evaluate external models trained on different reference panels. Thus, we adopted the more robust pseudo-Pearson- for evaluation on held-out test sets.
In addition to these statistical performance metrics, we examined total wallclock time (in minutes), peak memory utilization (in MB), and inference time (in seconds). Total wallclock time includes the time to load the GWAS and LD data, perform harmonization, load software dependencies, perform inference, and finally conduct cross-validation for model selection (Zabad et al. 2025). Peak memory utilization records the maximum amount of Random Access Memory (RAM) used throughout the lifetime of the program in Megabytes. Finally, inference/fit time records the number of seconds it takes to reach convergence using the coordinate-ascent inference procedure.
3 Results
3.1 Simple simulation study
To illustrate the properties of the SSL prior, we designed a simple simulation experiment similar to the setup presented by Bai et al. (2021), with a sample of for SNPs on highly correlated blocks, visually illustrated in Fig. 1c. Details can be found in Methods 3.1.1, available as supplementary data at Bioinformatics online.
Fitting SSLPRS on this simulated data with an increasing ladder through warm-start reveals the model’s ability to simultaneously perform variable selection and stable effect size estimation, i.e. the effects of selected variants are held steady and the rest are shrunk to zero (Fig. 1d). Despite the tight correlation structure, SSLPRS performs well across the ladder in variable selection in terms of MCC. (Fig. 1f). In contrast, the LASSO over-shrinks effects with increasing penalization(Fig. 1e), which in turn also leads to unstable and degraded variable selection performance across the ladder.
3.2 Simulation of UK Biobank data
To evaluate variable selection and predictive capabilities under diverse genetic architectures, we conducted a 5-replicate analysis on each of the 9 simulation settings (Section 2.5.2). In these analyses, the base SSLPRS model is compared to SSLPRS-GS and the baseline models. Warm-starting SSLPRS to the ladder’s end substantially improves precision, with a modest trade-off in recall, yielding a net gain in MCC in most cases. This behavior is detailed in Results 4.1, available as supplementary data at Bioinformatics online.
The 5-replicate results are shown in Fig. 2, with exact numerical values in Table 2, available as supplementary data at Bioinformatics online. Across all settings, SSLPRS exhibits lower recall but substantially higher precision compared to LASSO and SSLPRS-GS. This difference arises because SSLPRS selects variants at the end of the ladder, resulting in fewer but more confidently identified causal variants. In contrast, the grid-search based LASSO and SSLPRS-GS typically select lower penalty values, leading to broader but less precise variant selection. Overall, SSLPRS performs a balanced variant selection, resulting in a superior MCC performance across most settings. Though, in the less sparse settings ( ), causal variants are more numerous but have smaller effect sizes, especially under low heritability. Although, SSLPRS has slightly lower but still competitive MCC compared to the best performing model in these challenging polygenic settings, it still achieves high precision among the models.
Variable selection and predictive performance of summary statistics-based PRS methods on simulated UK Biobank phenotypes. Performance is evaluated using four metrics: Precision (top-left), Recall/sensitivity (top-right), Matthews correlation coefficient (MCC, bottom-left), and pseudo-Pearson-R2 (prediction accuracy, bottom-right) on held-out test set. The simulation configurations span three heritability settings, h2={0.1,0.3,0.5}, and three proportions of causal variants, θ={0.01,0.001,0.0001}. Five summary statistics-based PRS methods are included in this figure: LASSO, our proposed SSLPRS and SSLPRS-GS (grid search), as well as VIPRS and VIPRS-GS (grid search). Bars represent the mean value over five independent replicates. The black vertical lines denote the standard error across the replicates. For the variable selection metrics, the median rule was applied for the VIPRS models, where variants with Posterior Inclusion Probability (PIP) > 0.5 were considered as selected.
In terms of predictive performance, Fig. 2 reveals that in the polygenic ( ) scenario, SSLPRS-GS is more robust in terms of predictive performance compared to SSLPRS. SSLPRS-GS achieves pseudo-Pearson- scores that are comparable to or exceed those of the baseline models. Notably, SSLPRS-GS is either on-par or outperforms LASSO in all settings. While SSLPRS performs well in variable selection, incorporating grid search may further enhance predictive performance, particularly in complex genetic architectures where optimization of pseudo-Pearson- should be optimized.
3.3 Real phenotype analysis in the UK Biobank
To examine the predictive performance of the SSLPRS model on real data, we conducted a 5-fold cross-validation analysis on 9 quantitative phenotypes from the UK Biobank (Bycroft et al. 2018). As this analysis focuses on predictive performance, we compared SSLPRS-GS, for the best SSLPRS performance, to the main baseline models (Section 2.4). Our results show that across all phenotypes examined, SSLPRS-GS shows competitive prediction accuracy compared to the baseline models (Fig. 3). Small but significant differences between the models are observed for some phenotypes. For instance, in standing height, models that use grid search to tune hyperparameters outperform VIPRS and PRS-CS by up to 10%, and in LDL cholesterol, improvements of up to 16% are shown when compared to PRS-CS. Across phenotypes, SSLPRS-GS matches or outperforms LASSO, with advantages in traits such as LDL cholesterol (Fig. 3). Interestingly, LDL is a trait known to have a sparse genetic architecture driven by large effect variants (Graham et al. 2021). This may be a case where bias from excessive shrinkage hurts the performance of the LASSO, whereas SSLPRS-GS benefits from high-quality sparse effect size estimates in a well-selected variant set. Earlier simulations (Fig. 2) similarly demonstrated SSLPRS-GS performs best under sparse genetic architectures, suggesting that real traits with comparable configurations may yield substantial predictive gains. It’s worth noting that although LASSO and Lassosum share the same prior formulation, differences in LD scaling, where Lassosum tends to an elastic-net like solution, along with other minor variations, can lead to trait-specific performance, with LASSO performing better for traits like HDL and LDL, and Lassosum for traits like BMI and FEV1 (Details in Results 4.2, available as supplementary data at Bioinformatics online). In addition, we assessed model predictive performance transferability to minority populations (Results 4.4, available as supplementary data at Bioinformatics online).
Predictive performance of summary statistics-based PRS methods on real quantitative phenotypes in the UK Biobank. Prediction accuracy (pseudo-Pearson-R2) on held-out test sets in an analysis of nine quantitative phenotypes: standing height (HEIGHT), high-density lipoprotein (HDL), body mass index (BMI), forced vital capacity (FVC), forced expiratory volume in 1 s (FEV1), hip circumference (HC), waist circumference (WC), low-density lipoprotein (LDL), and birth weight (BW). The bars represent the average model performance based on 5-fold cross-validation, with black vertical lines indicating the associated standard errors. Six summary statistics-based PRS models are shown with different colors: our proposed SSLPRS-GS (grid search), LASSO, Lassosum, VIPRS, VIPRS-GS (grid search), PRS-CS (auto), PRSice2.
3.4 Enrichment and replication of selected variants
To assess the biological relevance of selected variants, we evaluated the functional enrichment across 39 genomic annotations (Finucane et al. 2015) and replicability in large-scale GWAS studies. Figure 4a reveals that top performing models in variable selection scenarios, SSLPRS and VIPRS, exhibit substantial fold-enrichment in some of the biological annotations typically used in partitioning trait heritability (Finucane et al. 2015). Notably, the variants are most enriched in non-synonymous sites, altering amino acid sequence and thus protein function in lipid-regulating genes, and regulatory elements such as promoters and enhancers, underscoring their functional relevance for traits such as HDL and LDL.
Functional enrichment and biological relevance of selected variants in real complex trait analyses. (a) Heatmap of fold enrichment, defined as the ratio between the proportion of selected SNPs in a given annotation and the background proportion of all SNPs in that annotation. Enrichment is shown across 39 functional annotations (x-axis), stratified by model (left y-axis) and trait (right y-axis). (b) Replication rate of selected variants during training on UK Biobank data for high- and low-density lipoprotein (HDL and LDL) phenotypes in the Global Lipids Genetics Consortium (GLGC) meta-analysis. Replication is defined in terms of the variants being significantly associated with the phenotype (P-value <5×10⁻⁸) in the GLGC. Bars and black horizontal bars represent mean replication rate and standard error across the 5-fold cross-validation analyses respectively. Five summary statistics-based PRS methods are included: LASSO, our proposed SSLPRS and SSLPRS-GS (grid search), as well as VIPRS and VIPRS-GS (grid search).
To see if selected variants are replicated in large-scale GWAS analyses, we examined summary statistics provided by the Global Lipids Genetics Consortium (GLGC) (Graham et al. 2021), with samples sizes exceeding 1.6 million. We assumed that significant associations reported by that study (P-values < ) as our reference and examined the number of selected variants from the UK Biobank data that are replicated in that larger study. Figure 4b reveals that a substantial proportion of selected variants attain genome‐wide significance in the GLGC meta‐analysis; SSLPRS exhibits the highest replication rate, followed by VIPRS in both the LDL and HDL traits. The number of selected, significant, and replicated variants for each model across the 5-folds can be found in Table 3, available as supplementary data at Bioinformatics online. Together, these results indicate that SSLPRS yields a high-quality, sparse set of biologically relevant variants.
3.5 Scalability and computational performance
To assess the computational performance of SSLPRS with the optimizations detailed in Methods 3.6, available as supplementary data at Bioinformatics online, we compared our summary statistics implementation of SSL to the individual-level R-based SSLASSO (Ročková and George 2018), benchmarked on an identical chromosome 22 dataset from the UK Biobank standing‐height data. SSLPRS achieved a multi-order improvement compared to SSLASSO. Specifically, across settings, SSLPRS had an average inference time of 5.3 s and a peak memory usage of 73MB, compared to 22.4 min and 41 00 MB for SSLASSO (Details in Results 4.6, available as supplementary data at Bioinformatics online).
4 Discussion
In this work, we presented the novel PRS method SSLPRS for sparse and accurate prediction of complex traits from GWAS summary data. Our experiments on real and simulated traits show that SSLPRS combines competitive prediction accuracy with strong variable selection performance for effective and interpretable PRS construction, especially for sparse genetic architectures. In particular, we emphasized variable selection because the prior, while not perfect, proves more accurate than existing methods in this aspect. This ability is valuable for downstream applications where efficiently obtaining a limited subset of variants is important, and for pipelines that rely on heuristic selection strategies such as P + T or C + T, SSLPRS could provide both improved accuracy and efficiency. Through its dynamic posterior exploration with the mode-targeted MAP coordinate ascent algorithm, SSLPRS’s performance is complemented by its ability to produce truly sparse effect size estimates—retaining a high quality set of biologically significant variants without excessive shrinkage. In addition SSLPRS comes with fast, memory-efficient, and highly scalable algorithms for genome-wide inference, available in penprs v0.0.1. Further extensions could explore posterior mean estimation of SSL via MCMC or Variational inference similar to methods of (Hof and Speed 2025), to enable a dense regression approach like VIPRS, which demonstrated strong predictive performance. Overall, we believe that SSLPRS provides effective analytical tools for predicting and understanding the genetic underpinnings of complex traits and diseases.
Supplementary Material
btaf578_Supplementary_Data
The reference list from the paper itself. Each links out to its DOI / PubMed record.
- 1Bai R , RočkováV, George EI. Spike-AND-slab meets lasso: A review of the spike-AND-slab lasso. In: Tadesse MG, Vannucci M (eds) Handbook of Bayesian Variable Selection. Boca Raton (FL): Chapman & Hall/CRC (Taylor & Francis Group), 2021, 81–108.
- 2Bycroft C , Freeman C, Petkova D et al The UK biobank resource with deep phenotyping and genomic data. Nature 2018;562:203–9. 10.1038/s 41586-018-0579-z 30305743 PMC 6786975 · doi ↗ · pubmed ↗
- 3Chang CC , Chow CC, Tellier LC, et al Second-generation plink: rising to the challenge of larger and richer datasets. Gigascience 2015;4:7. 10.1186/s 13742-015-0047-8PMC 434219325722852 · doi ↗ · pubmed ↗
- 4Choi SW , O'Reilly PF. Prsice-2: polygenic risk score software for biobank-scale data. Gigascience 2019;8:giz 082. 10.1093/gigascience/giz 082PMC 662954231307061 · doi ↗ · pubmed ↗
- 5Finucane HK , Bulik-Sullivan B, Gusev A et al; RACI Consortium. Partitioning heritability by functional annotation using genome-wide association summary statistics. Nat Genet 2015;47:1228–35. 10.1038/ng.340426414678 PMC 4626285 · doi ↗ · pubmed ↗
- 6Friedman JH , Hastie T, Tibshirani R. Regularization paths for generalized linear models via coordinate descent. J Stat Softw 2010;33:1–22. 10.18637/jss.v 033.i 0120808728 PMC 2929880 · doi ↗ · pubmed ↗
- 7Ge T , Chen CY, Ni Y et al Polygenic prediction via Bayesian regression and continuous shrinkage priors. Nat Commun 2019;10:1776. 10.1038/s 41467-019-09718-530992449 PMC 6467998 · doi ↗ · pubmed ↗
- 8Graham SE , Clarke SL, Wu K-HH et al; Global Lipids Genetics Consortium. The power of genetic diversity in genome-wide association studies of lipids. Nature 2021;600:675–9. 10.1038/s 41586-021-04064-3PMC 873058234887591 · doi ↗ · pubmed ↗