Concordance of Cephalometric Classifications of Divergence in Orthodontics
Maria E Saadeh

TL;DR
This study compares five cephalometric methods for classifying facial divergence in orthodontics and finds significant differences in their classifications.
Contribution
The study evaluates the concordance of five commonly used cephalometric methods for vertical skeletal classification in orthodontics.
Findings
Divergence prevalence varied significantly between methods, with hypodivergent rates ranging from 16% to 30%.
Agreement was substantial between SN/GoGn and MP/SN (κ = 0.656), but lowest when FAA was compared (κ ≈ 0.11-0.22).
Overall agreement across all methods was fair (κ = 0.375), suggesting methods are not interchangeable.
Abstract
Background Vertical skeletal pattern is central to orthodontic diagnosis. We compared five cephalometric methods-Steiner (Sella-Nasion to mandibular plane, SN/GoGn), Downs (mandibular plane to Sella-Nasion, MP/SN), Tweed (Frankfort-mandibular plane angle, FMA), Arnett (palatal plane to mandibular plane, PP/MP), and Ricketts (facial axis angle, FAA)-for classifying facial divergence. Methods We retrospectively analyzed 300 lateral cephalograms (114 males, 186 females; mean age 26.4 ± 9.9 years) from skeletal Class I adults (A point-Nasion-B point angle, ANB, 0° < ANB < 4°). Each method classified subjects as hypo-, normo-, or hyperdivergent. Agreement was assessed using Cohen’s kappa (κ), and ordinal association using Kendall’s tau-b (τ_b). Results Divergence prevalence varied by method: hypodivergent 16% (48/300) with MP/SN to 30% (90/300) with SN/GoGn; hyperdivergent 15.3%…
Genes, proteins, chemicals, diseases, species, mutations and cell lines named across the full text — each resolved to its canonical identifier and authoritative record.
Click any figure to enlarge with its caption.
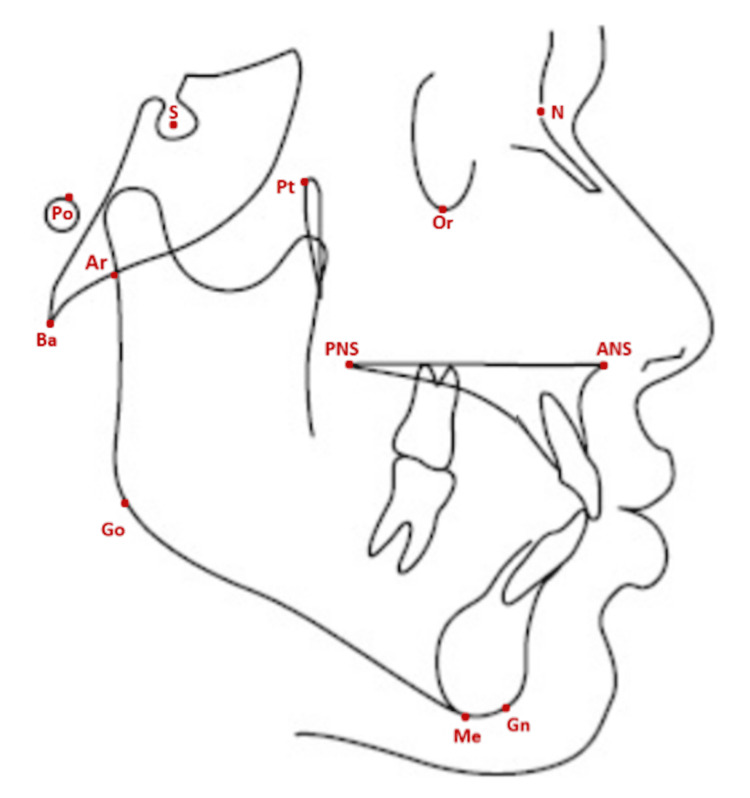 Figure 1
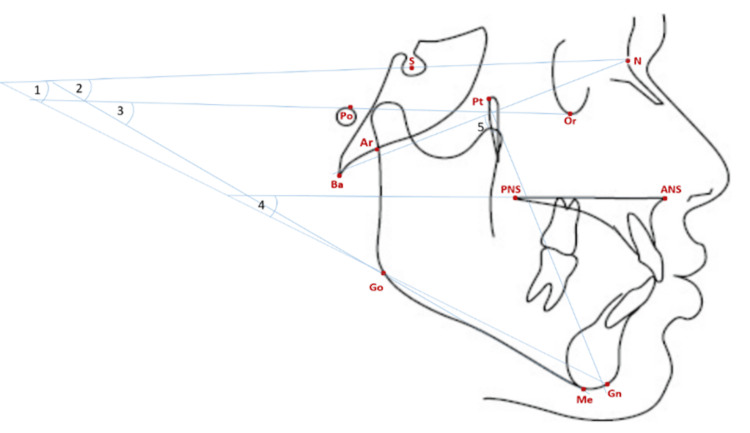 Figure 2
| Analysis | Measurement | Interpretation | Classification |
| Steiner CC [ | Mandibular Plane Angle (MPA) | Angle formed by the Sella-Nasion (SN) plane and the mandibular plane (Go-Gn) | Hypodivergent < 28° Normodivergent 28-36° Hyperdivergent > 36° |
| Downs WB [ | MP/SN angle | Angle formed by the Sella-Nasion (SN) plane and the mandibular plane (Go-Me) | Hypodivergent < 27° Normodivergent 27-37° Hyperdivergent > 37° |
| Tweed CH [ | FMA | Angle between the mandibular plane (Go-Me) and the Frankfort horizontal plane (Po-Or) | Hypodivergent < 20° Normodivergent 20-28° Hyperdivergent > 28° |
| Arnett GW et al. [ | PP/MP angle | Angle formed by the palatal plane (ANS-PNS) and the mandibular plane (Go-Gn) | Hypodivergent < 20° Normodivergent 20-30° Hyperdivergent > 30° |
| Ricketts RM et al. [ | Facial Axis Angle (FAA) | Angle formed by the facial axis line (Ba-N) and the Pterygoid-Gnathion line (Pt-Gn) | Hypodivergent > 93° Normodivergent 87-93° Hyperdivergent < 87° |
| Measurement | Minimum | Maximum | Mean | SD |
| Age (years) | 16 | 61.58 | 26.41 | 9.93 |
| SN/GoGn (Steiner) | 16.3° | 47.8° | 31.36° | 5.74 |
| MP/SN (Downs) | 17.9° | 49.3° | 33.38° | 5.83 |
| FMA (Tweed) | 8.1° | 40.9° | 24.16° | 4.94 |
| PP/MP (Arnett) | 8.1° | 39.9° | 24.38° | 5.68 |
| FAA (Ricketts) | 77.8° | 102.0° | 89.90° | 4.06 |
| Group | SN/GoGn n (%) | MP/SN n (%) | FMA n (%) | PP/MP n (%) | FAA n (%) |
| Overall (n = 300) | |||||
| Hypodivergent | 90 (30.0) | 48 (16.0) | 63 (21.0) | 72 (24.0) | 67 (22.3) |
| Normodivergent | 155 (51.7) | 177 (59.0) | 180 (60.0) | 182 (60.7) | 166 (55.3) |
| Hyperdivergent | 55 (18.3) | 75 (25.0) | 57 (19.0) | 46 (15.3) | 67 (22.3) |
| Females (n = 186) | |||||
| Hypodivergent | 50 (26.9) | 24 (12.9) | 37 (19.9) | 48 (25.8) | 43 (23.1) |
| Normodivergent | 106 (57.0) | 119 (64.0) | 111 (59.7) | 115 (61.8) | 97 (52.2) |
| Hyperdivergent | 30 (16.1) | 43 (23.1) | 38 (20.4) | 23 (12.4) | 46 (24.7) |
| Males (n = 114) | |||||
| Hypodivergent | 40 (35.1) | 24 (21.1) | 26 (22.8) | 24 (21.1) | 24 (21.1) |
| Normodivergent | 49 (43.0) | 58 (50.9) | 69 (60.5) | 67 (58.8) | 69 (60.5) |
| Hyperdivergent | 25 (21.9) | 32 (28.1) | 19 (16.7) | 23 (20.2) | 21 (18.4) |
| Group | MP/SN | FMA | PP/MP | FAA |
| Overall (n = 300) | ||||
| Hypodivergent (n = 90) | 48 | 55 | 55 | 36 |
| Normodivergent (n = 155) | 135 | 127 | 125 | 92 |
| Hyperdivergent (n = 55) | 55 | 37 | 31 | 21 |
| Females (n = 186) | ||||
| Hypodivergent (n = 50) | 24 | 33 | 34 | 22 |
| Normodivergent (n = 106) | 93 | 86 | 85 | 60 |
| Hyperdivergent (n = 30) | 30 | 22 | 15 | 14 |
| Males (n = 114) | ||||
| Hypodivergent (n = 40) | 24 | 22 | 21 | 14 |
| Normodivergent (n = 49) | 42 | 41 | 40 | 32 |
| Hyperdivergent (n = 25) | 25 | 15 | 16 | 7 |
| Group | SN/GoGn | FMA | PP/MP | FAA |
| Overall (n = 300) | ||||
| Hypodivergent (n = 48) | 48 | 36 | 34 | 17 |
| Normodivergent (n = 177) | 135 | 137 | 128 | 98 |
| Hyperdivergent (n = 75) | 55 | 44 | 35 | 28 |
| Females (n = 186) | ||||
| Hypodivergent (n = 24) | 24 | 18 | 18 | 8 |
| Normodivergent (n = 119) | 93 | 90 | 82 | 61 |
| Hyperdivergent (n = 43) | 30 | 28 | 16 | 19 |
| Males (n = 114) | ||||
| Hypodivergent (n = 24) | 24 | 18 | 9 | 9 |
| Normodivergent (n = 58) | 42 | 47 | 46 | 37 |
| Hyperdivergent (n = 32) | 25 | 16 | 19 | 9 |
| Group | SN/GoGn | MP/SN | PP/MP | FAA |
| Overall (n = 300) | ||||
| Hypodivergent (n = 63) | 55 | 36 | 50 | 30 |
| Normodivergent (n = 180) | 127 | 137 | 141 | 111 |
| Hyperdivergent (n = 57) | 37 | 44 | 29 | 24 |
| Females (n = 186) | ||||
| Hypodivergent (n = 37) | 33 | 18 | 32 | 20 |
| Normodivergent (n = 111) | 86 | 90 | 89 | 67 |
| Hyperdivergent (n = 38) | 22 | 28 | 17 | 18 |
| Males (n = 114) | ||||
| Hypodivergent (n = 26) | 22 | 18 | 18 | 10 |
| Normodivergent (n = 69) | 41 | 47 | 52 | 44 |
| Hyperdivergent (n = 19) | 15 | 16 | 12 | 6 |
| Group | SN/GoGn | MP/SN | FMA | FAA |
| Overall (n = 300) | ||||
| Hypodivergent (n = 72) | 55 | 34 | 50 | 33 |
| Normodivergent (n = 182) | 125 | 128 | 141 | 105 |
| Hyperdivergent (n = 46) | 31 | 35 | 29 | 15 |
| Females (n = 186) | ||||
| Hypodivergent (n = 48) | 34 | 18 | 32 | 22 |
| Normodivergent (n = 115) | 85 | 82 | 89 | 64 |
| Hyperdivergent (n = 23) | 15 | 16 | 17 | 11 |
| Males (n = 114) | ||||
| Hypodivergent (n = 24) | 21 | 16 | 18 | 11 |
| Normodivergent (n = 67) | 40 | 46 | 52 | 41 |
| Hyperdivergent (n = 23) | 16 | 19 | 12 | 4 |
| Group | SN/GoGn | MP/SN | FMA | PP/MP |
| Overall (n = 300) | ||||
| Hypodivergent (n = 67) | 36 | 17 | 30 | 33 |
| Normodivergent (n = 166) | 92 | 98 | 111 | 105 |
| Hyperdivergent (n = 67) | 21 | 28 | 24 | 15 |
| Females (n = 186) | ||||
| Hypodivergent (n = 43) | 22 | 8 | 20 | 22 |
| Normodivergent (n = 97) | 60 | 61 | 67 | 64 |
| Hyperdivergent (n = 46) | 14 | 19 | 18 | 11 |
| Males (n = 114) | ||||
| Hypodivergent (n = 24) | 14 | 9 | 10 | 11 |
| Normodivergent (n = 69) | 32 | 37 | 44 | 41 |
| Hyperdivergent (n = 21) | 7 | 9 | 6 | 4 |
| Matches | Kappa (κ) | p-value (Kappa) | Kendall’s tau (τᵦ) | p-value (Kendall) |
| Steiner × Downs | 0.656 | <0.001** | 0.207 | <0.001** |
| Steiner × Tweed | 0.544 | <0.001** | 0.035 | 0.001** |
| Steiner × Arnett | 0.494 | <0.001** | 0.002 | 0.458 |
| Steiner × Ricketts | 0.17 | <0.001** | 0.019 | 0.018* |
| Downs × Tweed | 0.51 | <0.001** | 0.044 | <0.001** |
| Downs × Arnett | 0.393 | <0.001** | 0.091 | <0.001** |
| Downs × Ricketts | 0.11 | 0.016* | 0.013 | 0.046* |
| Tweed × Arnett | 0.521 | <0.001** | 0.017 | 0.025* |
| Tweed × Ricketts | 0.222 | <0.001** | 0 | 0.796 |
| Arnett × Ricketts | 0.15 | <0.001** | 0.01 | 0.083 |
| Group | Kappa (κ) | p-value (Kappa) | Kendall’s tau (τᵦ) | p-value (Kendall) |
| Overall | 0.375 | <0.001** | 0.034 | <0.001** |
| Hypodivergent | 0.456 | <0.001** | - | - |
| Normodivergent | 0.29 | <0.001** | - | - |
| Hyperdivergent | 0.415 | <0.001** | - | - |
| MP/SN | FMA | PP/MP | FAA | |
| SN/GoGn | 0.996** | 0.861** | 0.799** | -0.377** |
| MP/SN | 0.866** | 0.804** | -0.369** | |
| FMA | 0.827** | -0.421** | ||
| PP/MP | -0.396** |
Peer Reviews
No public reviews on file for this paper yet. If you reviewed it on a platform where reviews are public (OpenReview, ICLR, NeurIPS, ICML), you can paste yours below so the community can read it here.
Videos
No videos yet. Explain this paper in a talk, walkthrough, or lecture? Add one.
Taxonomy
TopicsOrthodontics and Dentofacial Orthopedics · Dental Radiography and Imaging · Temporomandibular Joint Disorders
Introduction
Vertical facial divergence is a crucial aspect of craniofacial morphology and plays a significant role in orthodontic diagnosis, treatment planning, and long-term stability. This dimension is commonly assessed by relating the mandibular plane to cranial or palatal reference planes, classifying patients as hypo-, normo-, or hyperdivergent.
Various cephalometric analyses have been developed to classify facial divergence, each using different landmarks and reference planes: Steiner’s Mandibular Plane Angle (MPA) [1], Downs’ Mandibular Plane to SN angle (MP/SN) [2], Tweed’s Mandibular and Frankfort horizontal planes (Go-Me/Po-Or) [3], Arnett’s Palatal Plane to Mandibular Plane angle (PP/MP) [4], and Ricketts’ Facial Axis Angle (FAA) [5].
Previous studies have reported varying levels of agreement between these analyses, ranging from slight to moderate: Aguilar-Perez FJ et al. [6] found a fair agreement between the Björk-Jarabak and Ricketts analyses, and Herreros del Pozo A et al. [7] reported a similar level of agreement between the Steiner and Ricketts analyses. However, Claro CA et al. [8] demonstrated only a slight concordance between the Jarabak and Ricketts analyses, unlike Benedicto EN et al. [9], who showed a fair agreement between the same methods. Plaza SP et al. [10] reported a strong association between sagittal and vertical skeletal patterns across the three sagittal classification systems evaluated: Class II malocclusion showed a higher prevalence of hyperdivergence, whereas Class III showed a higher prevalence of hypodivergence.
Given this inconsistency in the literature, this study aimed to evaluate the agreement between five widely used cephalometric methods in categorizing facial divergence among skeletal Class I adults.
The objectives of this research were to compare the concordance between these methods in classifying individuals as hypodivergent, normodivergent, or hyperdivergent; to identify discrepancies and potential biases arising from variations in reference planes, landmark identification, and sample characteristics; and to highlight the clinical implications of cephalometric classification discrepancies for orthodontic diagnosis, treatment planning, and long-term stability.
Materials and methods
Study design and population
This cross-sectional study analyzed lateral cephalometric radiographs of 300 adults (114 males and 186 females; mean age, 26.4 ± 9.9 years) selected from the Lebanese University Faculty of Dental Medicine database.
The inclusion criteria were defined as females aged ≥ 16 years and males aged ≥ 18 years, skeletal Class I (0° < ANB < 4°), Class I canine and molar relationships, and full permanent dentition.
Excluded were individuals with systemic disease, craniofacial anomalies, a history of orthodontic and/or surgical treatment involving the head and neck, missing posterior teeth (except third molars), or prostheses that could alter the vertical dimension.
Anonymized retrospective data were used, minimizing any potential risk to patient privacy. Ethical approval was obtained from the Institutional Review Board at the Lebanese University (CUEMB 35/AA).
Radiographic analysis
All lateral cephalograms were acquired in the natural head position using the same unit (Kodak 8000C, Carestream Health, Rochester, NY, USA). One examiner digitized the images in Viewbox 4.0.1.6 using standard landmark definitions (Figure 1) to generate angular cephalometric measurements (Figure 2). Facial divergence was then classified according to established criteria for each analysis, as shown in Table 1.
Cephalometric hard tissue landmarks used in the study.N: Nasion; S: Sella; Po: Porion; Pt: Pterygoid; Or: Orbitale; Ar: Articulare; Ba: Basion; ANS: Anterior Nasal Spine; PNS: Posterior Nasal Spine; Go: Gonion; Me: Menton; Gn: Gnathion.Original illustration created by the author.
Angular parameters of facial divergence.1: Steiner; 2: Downs; 3: Tweed; 4: Arnett; 5: Ricketts.Original illustration created by the author.
Reliability
To assess intra-examiner reproducibility, the same examiner re-digitized 30 randomly selected radiographs after three weeks. For inter-examiner reproducibility, a second examiner independently digitized another set of 30 blinded radiographs.
Statistical analysis
An a priori power analysis (80%, effect size = 0.50, α = 0.05) indicated a minimum sample size of n ≥ 128; the final n = 300 exceeded this requirement. Agreement between methods for the three-level divergence classification (hypo-/normo-/hyperdivergent) was quantified using Cohen’s kappa (κ) and interpreted following Landis & Koch benchmarks (slight < 0.20; fair 0.21-0.40; moderate 0.41-0.60; substantial 0.61-0.80; almost perfect 0.81-1.00) [11]. Kendall’s tau-b (τ_b) assessed ordinal associations across the ordered categories. Linear associations among continuous angles were evaluated using the Pearson correlation coefficient (r).
For reliability, intra- and inter-examiner reproducibility of continuous angles (SN/GoGn, MP/SN, FMA, PP/MP, FAA) were evaluated using ICC(2,1) (two-way random effects, absolute agreement, single measures). For the three-level divergence categories, weighted Cohen’s κ was calculated.
Descriptive statistics (mean ± SD, range) were reported for age and all angular measurements, and cross-tabulations of classifications by method were provided.
As a sensitivity analysis, agreement (weighted κ) and ordinal association (τ_b) were re-evaluated after stratifying by age (<21, 21-29, 30-39, ≥ 40 years).
Statistical significance was set at α = 0.05. All analyses were performed using SPSS® v24.0 (IBM®) and Stata/SE™ 11.1.
Results
Descriptive statistics
The sample included n = 300 adults (mean age: 26.41 ± 9.93 years; range: 16-61.58). Summary measures for all angles are presented in Table 2.
Reliability
Intra-examiner reproducibility for the angular measurements was excellent across all variables (ICC(2,1) range: 0.94-0.99; 95% CI: 0.91-1.00). Inter-examiner reproducibility was likewise excellent (ICC(2,1) range: 0.92-0.98; 95% CI: 0.88-0.99). For the three-category divergence classification (hypo-/normo-/hyperdivergent), test-retest agreement was substantial to almost perfect (weighted κ: intra = 0.99, inter = 0.98), indicating that both landmark digitization and derived classifications were stable and reproducible.
Prevalence of divergence patterns by method
The prevalence varied by method: hypodivergent prevalence ranged from 16% (MP/SN) to 30% (SN/GoGn); normodivergent from 51.7% (SN/GoGn) to 60.7% (PP/MP); and hyperdivergent from 15.3% (PP/MP) to 25% (MP/SN) (Table 3).
Sex-stratified distributions
Patterns in females and males mirrored the overall sample. In females, hypodivergence had the highest prevalence with SN/GoGn (26.9%) and the lowest with MP/SN (12.9%); normodivergence was most prevalent with MP/SN (64%) and least with FAA (52.2%); hyperdivergence was most prevalent with FAA (24.7%) and least with PP/MP (12.4%).
In males, hypodivergence was most prevalent with SN/GoGn (35.1%) and least with MP/SN, PP/MP, and FAA (21.1%); normodivergence was most prevalent with FMA/FAA (60.5%) and least with SN/GoGn (43%); hyperdivergence was most prevalent with MP/SN (28.1%) and least with FMA (16.7%) (Table 3).
Concordance by prevalence
Concordance by category was highest between SN/GoGn and MP/SN. All 55/55 subjects classified as hyperdivergent by SN/GoGn were likewise hyperdivergent by MP/SN; among SN/GoGn-normodivergent individuals (n = 155), 135/155 were MP/SN-normodivergent; and 55/90 SN/GoGn-hypodivergent were also hypodivergent by both FMA and PP/MP. The same trend held by sex, with the only difference observed in males within hypodivergence, where MP/SN showed the highest concordance (Table 4).
All 48/48 MP/SN-hypodivergent cases were SN/GoGn-hypodivergent. Among MP/SN-normodivergent (n = 177), 137/177 were FMA-normodivergent (highest concordance for this stratum). Of MP/SN-hyperdivergent (n = 75), 55/75 were SN/GoGn-hyperdivergent. By sex, the only difference was in females within normodivergence, where SN/GoGn showed the highest concordance (Table 5).
Among FMA-hypodivergent (n = 63), 55/63 were SN/GoGn-hypodivergent. Of FMA-normodivergent (n = 180), 141/180 were PP/MP-normodivergent. Among FMA-hyperdivergent (n = 57), 44/57 were MP/SN-hyperdivergent. In females, MP/SN provided the highest concordance within normodivergence (Table 6).
Among PP/MP-hypodivergent (n = 72), 55/72 were SN/GoGn-hypodivergent. Of PP/MP-normodivergent (n = 182), 141/182 were FMA-normodivergent. Among PP/MP-hyperdivergent (n = 46), 35/46 were MP/SN-hyperdivergent. In females, FMA showed the highest concordance within hyperdivergence (Table 7).
Among FAA-hypodivergent (n = 67), 36/67 were SN/GoGn-hypodivergent. Of FAA-normodivergent (n = 166), 111/166 were FMA-normodivergent. Among FAA-hyperdivergent (n = 67), 28/67 were MP/SN-hyperdivergent. No sex differences in concordance were observed for FAA-based strata (Table 8).
Agreement and ordinal association
Age-stratified analyses yielded the same qualitative conclusions; for parsimony, only unstratified results are reported.
Pairwise Cohen’s kappa (κ) indicated substantial agreement between Steiner (SN/GoGn) and Downs (MP/SN) (κ = 0.656, p < 0.001), and moderate agreement for Steiner × Tweed (FMA) (κ = 0.544), Tweed × Arnett (PP/MP) (κ = 0.521), Downs × Tweed (κ = 0.510), and Steiner × Arnett (κ = 0.494) (all p < 0.001). The lowest κ was observed for Downs × Ricketts (FAA) (κ = 0.110, p = 0.016).
Kendall’s tau-b (τ_b) values were small overall, ranging from 0.000-0.207, with the largest for Steiner × Downs (τ_b = 0.207, p < 0.001); some pairs (e.g., Steiner × Arnett) even showed non-significant τ_b despite significant κ (Table 9).
**Table 9: Strength of agreement for cephalometric measurements.*Statistically significant at p < 0.05; Statistically significant at p < 0.01.Kappa = Cohen’s kappa (κ); Kendall’s tau = Kendall’s tau-b (τ_b).
Overall and group-specific agreement
Across all methods, the overall agreement scored κ = 0.375 (p < 0.001). Agreement by category was moderate for the hypodivergent (κ = 0.456) and hyperdivergent (κ = 0.415) groups, and fair for the normodivergent group (κ = 0.290). The overall ordinal association was τ_b = 0.034 (p < 0.001) (Table 10).
**Table 10: Strength of agreement in each group.Statistically significant at p < 0.01.Kappa: Cohen’s kappa (κ); Kendall’s tau: Kendall’s tau-b (τ_b).
Correlation among angular measures
A strong, statistically significant correlation was observed between SN/GoGn and MP/SN (r = 0.996), MP/SN and FMA (r = 0.866), and FMA and PP/MP (r = 0.827). By contrast, FAA showed weaker and often negative correlations with these angles (e.g., SN/GoGn × FAA: r = -0.377; MP/SN × FAA: r = -0.369; FMA × FAA: r = -0.421) (Table 11).
**Table 11: Correlation coefficients among various vertical skeletal measurements.Pearson correlation coefficients (r).Statistically significant at p < 0.01.SN/GoGn: Sella-Nasion to Gonion-Gnathion angle (Steiner’s Mandibular Plane Angle); MP/SN: Mandibular Plane to Sella-Nasion angle (Downs’ Mandibular Plane Angle); FMA: Frankfort-Mandibular Plane Angle (Tweed’s FMA); PP/MP: Palatal Plane to Mandibular Plane angle (Arnett’s Analysis); FAA: Facial Axis Angle (Ricketts’ Analysis).
Discussion
Orthodontists routinely assess the vertical skeletal pattern; however, different reference planes can classify the same patient differently. In addition, the scarcity of comparative studies in the literature makes it challenging for clinicians to select the most appropriate analysis for accurate judgment.
The present study aimed to evaluate the strength of agreement among five commonly used methods for assessing facial divergence in skeletal Class I individuals. To our knowledge, this is the first study to include these five vertical pattern assessment angles in a large sample of Class I individuals.
The main finding of this study was that the choice of analysis affected both the prevalence of divergence categories and the degree of concordance between indices. Agreement was substantial between SN/GoGn and MP/SN (κ = 0.656, p < 0.001), moderate for several other pairs, and lowest when FAA was involved. Overall agreement across all methods was fair. Correlations were strongest among SN/GoGn, MP/SN, and FMA, whereas FAA correlated weakly, and often negatively, with these measures.
Hypodivergence was most frequently recorded using Steiner’s SN/GoGn, normodivergence with Arnett’s PP/MP, and hyperdivergence with Downs’ MP/SN. The findings differ from those of Mourgues T et al. [12], where Steiner’s values tended more toward hyperdivergence compared with Ricketts, Björk-Jarabak, and McNamara. This discrepancy is likely due to methodological differences between the studies. In fact, there is variation in the definition of the MP among the above-mentioned authors. Steiner CC [1] and Arnett GW [4] both use Gonion and Gnathion to draw the MP, whereas Downs [2] defines MP as the line passing through Gonion and Menton. The Go-Me line reflects mandibular body inclination and uses an extreme inferior point [13], while Go-Gn provides a measure of mandibular rotation and chin position [14].
Our study found the strongest agreement (Cohen’s Kappa) and the highest correlation coefficient between Downs’ and Steiner’s angular measurements. Both measurements include the anterior cranial base length (SN) and the MP in their definition, differing only in the landmarks defining the MP. Although Menton may be easier to identify consistently than Gnathion, Go-Gn is considered more stable and less affected by vertical growth than Go-Me [15,16]. Our findings align with those of Ahmed M et al. [16] and Türker G et al. [17-18], who reported robust associations for these indices.
The weakest correlation coefficients were found between Ricketts’ FAA and all other measurements, which also showed the lowest agreement scores. This may be explained by the fact that the facial axis angle diverges from other vertical pattern measurements, as it is not solely an angular indicator of the vertical dimension between the jaws. It also reflects sagittal direction, overall growth direction, and cranial base inclination, which is directly influenced by cranial base morphology. In a recent study [18], Ricketts’ FAA was found useful for growth pattern evaluation, though not always in agreement or strongly correlated with other vertical skeletal measurements. In our sample, composed entirely of adult patients where growth is no longer a variable, the weak correlation observed can thus be interpreted as a true disagreement between Ricketts’ and other analyses.
Steiner’s vertical pattern angle (SN/GoGn) was also found to be moderately correlated (r = 0.86) and in agreement (κ = 0.544) with Tweed’s FMA angle in the present study. Our results concur with previous research [13,14,19], indicating that SN/GoGn is systematically larger than FMA by approximately 6°-7°, reflecting the average angular relationship between FH and SN. Similarly, Roy P et al. [15] and Ahmed M et al. [16] reported that these two measurements are reliable indicators for vertical pattern assessment.
Arnett’s PP/MP angle directly relates the jaws and is less influenced by the cranial base. It is believed to be among the most reliable planes [20,21], maintaining a stable angular relationship with the cranial base throughout life [21,22]. In the present study, its strongest correlation and agreement were with Tweed’s FMA angle. Several studies have shown that the palatal plane is roughly parallel to the Frankfort horizontal [13,14], yet it is easier to identify.
When genders were analyzed separately, the classifications largely mirrored those of the overall sample. Given that this study included more females (n = 186) than males (n = 114), and since no prior study with balanced gender distribution exists for comparison, this observation warrants confirmation in future research with equal male-female representation.
Limitations of the study
Using two-dimensional lateral cephalograms could be considered a limitation; nevertheless, cephalometric measurements remain relevant and reliable [23,24] and expose patients to lower radiation than cone-beam computed tomography (CBCT). Moreover, despite the close interrelationship between sagittal and vertical dimensions, especially considering the various scenarios of mandibular rotation [13], the selection of skeletal Class I individuals was intentional. This approach minimized the confounding influence of sagittal discrepancies on vertical analysis and reduced interpretive variability.
Residual age-related variation cannot be entirely excluded; however, age-stratified sensitivity analyses did not alter the study’s conclusions.
Clinical implications
Because these indices are not interchangeable, relying on a single method may lead to misclassification, particularly near category boundaries. Pairing SN/GoGn with MP/SN or FMA provides a more stable categorization, while FAA should be used cautiously as a standalone diagnostic measure. Recording two complementary indices and reconciling discordant results may enhance diagnostic accuracy, facilitate appropriate biomechanical planning, and improve long-term treatment stability.
Conclusions
Cephalometric methods for assessing vertical divergence do not fully concord, with agreement ranging from fair overall to substantial between SN/GoGn and MP/SN. Because the choice of method affects classification, clinicians should report at least two complementary indices, for example, SN/GoGn with MP/SN or FMA, and avoid relying solely on FAA for divergence categorization. Adopting standardized thresholds or a multi-index confirmation approach may enhance diagnostic consistency and support more reliable treatment planning.
The reference list from the paper itself. Each links out to its DOI / PubMed record.
- 1Cephalometrics in clinical practice Angle Orthod Steiner CC 829291959
- 2Variations in facial relationships; their significance in treatment and prognosis Am J Orthod Downs WB 8128403419481888255810.1016/0002-9416(48)90015-3 · doi ↗ · pubmed ↗
- 3The Frankfort-mandibular plane angle in orthodontic diagnosis, classification, treatment planning, and prognosis Am J Orthod Oral Surg Tweed CH 17523032194610.1016/0096-6347(46)90001-421022281 · doi ↗ · pubmed ↗
- 4Soft-tissue cephalometric analysis: diagnosis and treatment planning of dentofacial deformity Am J Orthod Dentofacial Orthop Arnett GW Jelic JS Kim J 23925311619991047409510.1016/s 0889-5406(99)70234-9 · doi ↗ · pubmed ↗
- 5Bioprogressive technique of Ricketts B Aires Panam Ricketts RM Roth RH Chaconas SJ Schulhof RJ Engel GA 1101983
- 6Agreement between two cephalometric analysis of facial growth direction and biotype Odovtos - Int J Dent Sci Aguilar-Perez FJ Bataller-Mendez EB Colome-Ruiz GE Chuc-Gamboa MG Aguilar-Perez DA Herrera-Atoche JR 167176262024
- 7Agreement between skeletal class and facial biotype between different cephalometric analysis Rev Española Ortod Herreros del PA Jiménez VI Domingo CM Nieto SI Aneiros FL 146151472017
- 8Association between overbite and craniofacial growth pattern Braz Oral Res Claro CA Abrão J Reis SA 4254322420102118096310.1590/s 1806-83242010000400009 · doi ↗ · pubmed ↗