Comparison of quantitative lung ultrasound scores with automated quantitative CT: to overcome the ultrasound limitations
Davide Mohammad Reza Beigi, Greta Pellegrino, Nicholas Landini, Marco Emanuele Diana, Gregorino Paone, Ilaria Bisconti, Francesca Romana Di Ciommo, Marius Cadar, Elena Platania, Jacopo Landro, Simona Truglia, Valeria Panebianco, Fabrizio Conti, Valeria Riccieri

TL;DR
This study compares lung ultrasound scores with CT scans to assess interstitial lung disease in systemic sclerosis patients, finding strong correlations that suggest ultrasound can evaluate deeper lung regions.
Contribution
The study introduces a novel pleural line irregularity score that correlates with deeper lung disease volume, overcoming traditional ultrasound limitations.
Findings
Quantitative LUS scores correlated strongly with CT-measured ILD extent, including surface and core volumes.
The novel PLI score showed significant correlations with basal and mid-lung ILD changes.
Multivariate analysis confirmed the associations between LUS scores and CT-defined ILD volumes.
Abstract
Lung ultrasound (LUS) is emerging as a valuable tool for assessing systemic sclerosis-associated interstitial lung disease (SSc-ILD), although it traditionally explores only superficial lung regions. Building upon our preliminary findings, this study investigated correlations between quantitative LUS scores and automated quantitative computed tomography (qCT) measurement of ILD extent, including both superficial and deeper lung involvement. Between 2021 and 2023, 82 consecutive SSc patients underwent concurrent LUS and CT scans. Total B-lines (BL) count (range 0–140) and our novel pleural line irregularity (PLI) score (range 0–28) were obtained using a 14-intercostal space scanning protocol. CT scans were analysed by automated texture analysis software, quantifying volumes of ILD, ground-glass opacities (GGO) and reticulations (RET), segmented in three levels (apices, midfields, bases)…
Genes, proteins, chemicals, diseases, species, mutations and cell lines named across the full text — each resolved to its canonical identifier and authoritative record.
Click any figure to enlarge with its caption.
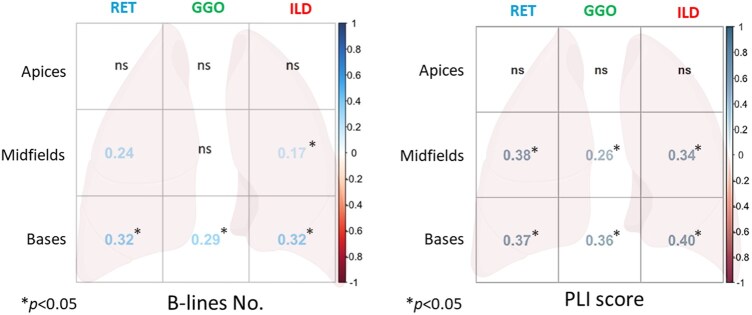 Figure 1
| Female/male, N (%) | 72/10 (86.2/13.8) |
|---|---|
| Median age, years (quartiles) | 63 (53; 72) |
| Median disease duration, years (quartiles) | 7.5 (3; 14) |
| Diffuse/limited cutaneous disease form, N (%) | 38/44 (46/54) |
| ILD ≥10% on CT, N (%) | 36 (44) |
| Smoking (current or ever), N (%) | 27 (33) |
| Anti-topoisomerase I antibodies positivity, N (%) | 33 (40) |
| Anti-centromere antibodies positivity, N (%) | 24 (29) |
| Digital ulcer presence, N (%) | 23 (28) |
| Puffy fingers, N (%) | 29 (35) |
| Sclerodactyly, N (%) | 46 (56) |
| Median ILD duration, years (quartiles) | 4 (2; 8) |
| Diffuse/limited cutaneous disease form, N (%) | 38/34 (46.3/41.4) |
| Immunosuppressant therapy, N (%) | 45 (55) |
| FEV1 %, median (quartiles) | 94 (75; 107) |
| FVC %, median (quartiles) | 96 (77; 110) |
| TLC%, median (quartiles) | 88 (73; 100) |
| DLCO %, median (quartiles) | 72 (58; 84) |
| B-lines no. (0–140), median (quartiles) | 16.5 (6.25; 44.5) |
| PLI score (0–28), median (quartiles) | 11 (5; 19.75) |
| qTC abnormality, cm3/%, median (quartiles) | |
| Healthy lung | 3494/86 (2264/76; 4233/94) |
| Ground-glass (GGO) | 53/2 (5.1/0.12; 180/6.6) |
| Reticulations (RET) | 45/1 (21/0.44; 111/3.6) |
| Honeycombing (HC) | 6.7/0.2 (1.6/0.037; 38/1) |
| Fibrosis (RET + HC) | 67/1.8 (28/0.7; 197/5.7) |
| ILD (GGO + RET + HC) | 232/5 (57/1.3; 478/15) |
| Lung surface ILD | 168 (39; 371) |
| Lung core ILD | 33 (10; 97) |
| Lung apices | Lung midfields | Lung bases | |
|---|---|---|---|
| B-lines no. (0–140) | 1 (0; 4) | 6.5 (1; 16) | 11 (3.26) |
| PLI score (0–28) | 1 (0; 2) | 5 (2; 8) | 6 (2; 11) |
| qTC abnormality, cm3, median (quartiles) | Lung apices | Lung midfields | Lung bases |
| Ground-glass | 0.2 (0.00; 5.4) | 5.7 (0.67; 50) | 31 (2.3; 117) |
| Reticulations | 1.2 (0.1; 7.5) | 10 (3.9; 32) | 30 (8.9; 66) |
| Fibrosis | 1.6 (0.15; 9) | 4.6 (0.85; 13) | 11 (2.4; 43) |
| ILD | 12 (1.9; 45) | 38 (9.9; 139) | 148 (34; 284) |
| Lung core ILD | 1.4 (0.04; 8.2) | 13 (2.5; 39) | 16 (2.2; 44) |
| Lung surface ILD | 8.7 (1–6; 31) | 27 (3.6; 86) | 109 (20; 210) |
| B-lines no. | Lung apices | Lung midfields | Lung bases |
|---|---|---|---|
| Core lung ILD | ns | ns | 0.36 (0.12; 0.55), |
| Surface lung ILD | ns | ns | 0.44 (0.22; 0.62), |
| B-lines no. | β coefficient | SE |
|
|---|---|---|---|
| Intercept | 18.10 | 4.25 |
|
| Surface ILD | 0.04 | 0.02 |
|
| Core ILD | −0.02 | 0.03 | 0.5030 |
| Basal ILD volume | β coefficient | SE |
|
|---|---|---|---|
| Intercept | 1.00 | 1.00 |
|
| Basal lung B-lines | 2.71 | 1.00 |
|
| Immunosuppressant therapy | 1.00 | 1.00 |
|
- —University of Milan10.13039/100012352
- —Italian Ministry of Health, ‘Ricerca Corrente’
Peer Reviews
No public reviews on file for this paper yet. If you reviewed it on a platform where reviews are public (OpenReview, ICLR, NeurIPS, ICML), you can paste yours below so the community can read it here.
Videos
No videos yet. Explain this paper in a talk, walkthrough, or lecture? Add one.
Taxonomy
TopicsUltrasound in Clinical Applications · Radiomics and Machine Learning in Medical Imaging · Ultrasound and Hyperthermia Applications
Introduction
Systemic sclerosis (SSc) is a chronic complex disease characterized by immune system disturbances, vascular changes and fibrosis [1]. Interstitial lung disease (ILD) is one of the most frequent organ manifestations of the disease, with a high impact on patient morbidity and mortality [2, 3]. Interest in this condition has soared in recent years, with the development of dedicated international guidelines for diagnosis and management [4, 5]. The cornerstones for diagnosis and monitoring of SSc-ILD are represented by chest computed tomography (CT) in combination with pulmonary function tests (PFTs) [6], although the variability of onset, severity and progression of the disease make the management of SSc-ILD challenging [7]. Moreover, CT implies a radiation exposure with a biological risk for patients, especially if lifelong follow-up are needed: in this context, complementary radiation-free tools such as lung ultrasound (LUS) and magnetic resonance imaging are gaining ground [8, 9].
LUS has emerged in recent years as an easy accessible and valuable method for the investigation of SSc-ILD [10, 11]. It showed high accuracy in identifying SSc-ILD compared with the gold standard of CT as well as significant association with PFT parameters [12–15]. Lately, the role of LUS has also emerged in the assessment of disease progression and treatment response [10, 16]. Key LUS findings are represented by the sonographic artifacts of B-lines (BLs) and pleural line irregularity (PLI), the definition of which has recently undergone standardization by the Outcome Measures in Rheumatology (OMERACT) Ultrasound Working Group [17]. Several scanning approaches have been proposed over the years. The 14 lung intercostal spaces assessments (LIS) proposed by Gutierrez et al. were shown to be reliable compared with more time-consuming approaches evaluating a wider number of LIS [18, 19]. This method has been used in the development of SSc-ILD interpretation criteria based on PLI [20] and for detection and monitoring of subclinical SSc-ILD [21]. However, most published LUS scoring systems for SSc-ILD diagnosis and severity assessment focus on BLs [14, 16, 22]. Recently, our group developed a quantitative PLI score using a 14-LIS protocol. In a preliminary work, this score showed an anatomical correlation with SSc-ILD extent on three-levels automated quantitative chest tomography (qCT) [23]. Despite increasingly solidifying evidence, a defining role of LUS in SSc-ILD is still lacking, also due to the intrinsic limitations of the US method compared with CT, including the possibility to explore only superficial areas of the lung parenchyma [24].
Based on previous assumptions, the purpose of the present study was to confirm the results of our preliminary study [23] and investigate a possible association of quantitative LUS scores with ILD of the lung surface and core assessed by qCT. Hence, the primary outcomes were to assess the correlation between the total number of BLs and the total PLI score with the volume of ILD, as well as with the ILD of surface and core lung as detected by qCT. As secondary outcomes, the correlation of number of BLs and PLI score with the volume of different qCT findings at three-levels qCT (lung apices, midfields and bases) analysis was evaluated.
Materials and methods
During 2021–2023, consecutive adult patients affected by SSc according to 2013 ACR/EULAR classification criteria referring to the Scleroderma Clinic of ‘Policlinico Umberto I’ (Rome, Italy) who underwent CT were evaluated for enrolment. Exclusion criteria were the presence of pulmonary arterial hypertension (either known in history or detected by echo signs), lower airway infections in the previous six months, history of chest radiotherapy and inadequate CT image quality (movement artifacts, pleural effusion, alterations other than ILD). Selected patients underwent LUS on the same day of CT. PFTs were carried out within a month. LUS was performed by two certified operators (G.P. and D.M.R.B.), blinded to each other and to CT, using an Esaote^®^ Mylab™ Gamma (Genoa, Italy) equipped with a 3–13 MHz linear probe. The 14-LIS scanning method was used and LIS were divided for each lung into apices (II parasternal), midfields (IV mid-clavear, IV anterior and median axillary) and lung bases (VIII posterior axillary, sub-scapular and paravertebral) as previously described [23]. Total BLs number was collected (from 0 to 140) and the PLI score proposed by our centre was applied (from 0 to 28) [23]. CT scans were performed with adequate parameters, reconstruction and windowing to be visually and automatically assessed. Two thoracic radiologists, by consensus, determined the presence of ≥10% ILD in included images, as well as the pattern [e.g. usual interstitial pneumonia (UIP), non-specific interstitial pneumonia (NSIP) or organizing pneumonia (OP)] [25]. All included CT were analysed by Imbio^®^ Lung Texture Analysis™ software based on Computer-Aided Lung Informatics for Pathology Evaluation and Rating (CALIPER) technology, in order to identify and quantify the volume (cm^3^) of healthy lung, ground-glass (GGO), reticulations (RET), honeycombing (HC), total fibrosis (RET + HC) and total ILD (GGO + RET + HC). The software further divided lung parenchyma into ‘surface’ and ‘core’, each representing about 50% of lung volume. Clinical laboratory data were also collected.
Written informed consent was obtained from every patient enrolled in the study. The ethics committee of Policlinico Umberto I hospital (Comitato Etico Territoriale Lazio Area 1) approved the study (Rif. 7284 Prot. 0681/2023).
Statistical analysis
Continuous variables were expressed as means and standard deviations (SD) or medians and interquartile ranges (IQR) for non-normally distributed data. The distribution of continuous variables was evaluated with the Shapiro Wilks test. Comparisons between continuous variables were performed with the Mann–Whitney U test or the t test where appropriate. Categorical variables were expressed as numbers and percentages and compared using the χ^2^ test or Fisher test, where appropriate. To assess the correlation between continuous variables, we used Kendall’s tau-b (τ) correlation coefficient. This non-parametric test was chosen for the distribution characteristics and low sample size of variables, other than its robustness in handling ties [26].
A multivariate linear regression analysis was performed to assess the independent association between the BLs and PLI scores and the volume of different pathological tissue at qCT, adjusted for multiple covariates. Covariates included in the model were selected when they emerged as confounder at the univariate comparison analysis. Prior to analysis, assumption of linearity, homoscedasticity, multicollinearity and normality of residuals were assessed to ensure the validity of the model. When the linearity assumption was not confirmed, a log-transformation of variable values was performed. The results of final models were reported as regression coefficient (β) with standard error (SE) and corresponding P-values. All statistical analyses were performed using R Studio graphical interface version 2023.12.1 + 402 for R software environment v. 4.3.0. All tests were two-sided with a significance level set at P < 0.05.
Results
Patients’ characteristics
In total, 82 patients were enrolled (72 females, 10 males), with a median age (quartiles) of 63 years (53; 72) and a median disease duration of 7.5 years (3; 14). Median ILD duration from CT diagnosis was 4 (2; 8) years. Forty-five patients (55%) were on immunosuppressant therapy. Median predicted FVC% and DLCO% values were, respectively, 96 (77; 110) and 72 (58; 84).
Characteristics of the study population are reported in Table 1.
LUS assessment
Total median BLs were 16.5 (6.25; 44.5) and median PLI score was 11 (5; 19.75) (Table 1). Apices, midfields and lung bases BLs medians were 1 (0; 4), 6.5 (1; 16) and 11 (3.26), respectively, whereas median PLI score was 1 (0; 2), 5 (2; 8) and 6 (2; 11) (Table 2).
CT and qCT analysis
Thirty-six patients (44%) had ILD ≥10% on CT, two of which had a UIP pattern and the rest a NSIP pattern.
At qCT analysis, GGO volume (cm^3^) was 53 (5.1; 180), RET was 45 (21; 111), HC 6.7 (1.6; 38), total fibrosis 67 (28; 197) and total ILD 232 (57; 478) (Table 1). Median lung surface ILD was (cm^3^) 168 (39; 371) and core ILD was 33 (10; 97) (Table 1). Apices, midfields and lung bases GGO, RET, total fibrosis and total ILD volumes, as well as surface and core lung division are reported in Table 2.
Surface lung ILD volume was significantly greater than that of core lung [median (IQR) 169 (37; 372) cm^3^ vs 33 (10; 85) cm^3^, P < 0.001]. The same emerged for GGO [60 (4.8; 236) vs 5 (0.4; 27), P < 0.001] and for RET 17 [(6.4; 51) vs 7.9 (1.3; 23), P < 0.004)] volumes.
Correlations between LUS and qCT
Overall lung correlations
Both total BLs and PLI score were found to correlate negatively with healthy lung volume (respectively, τ −0.36, P < 0.014 and τ −0.5, P < 0.0001) and positively with total ILD volumes (τ 0.43, P < 0.0001 and τ 0.58, P < 0.0001), GGO (τ 0.35, P < 0.017 and τ 0.45, P < 0.0001), RET (τ 0.44, P < 0.0001 and τ 0.56, P < 0.0001) and total fibrosis (τ 0.44, P < 0.0001 and τ 0.51, P < 0.0001).
Both total BLs and PLI score were found to correlate with whole lung surface and core ILD (respectively, τ 0.46, P < 0.0001 and τ 0.29, P < 0.011 for BLs and τ 0.59, P < 0.0001 and τ 0.45, P < 0.0001 for PLI score).
Three-levels qCT analysis
At 3-levels qCT analysis, BLs correlated at lung bases with both surface and core ILD (respectively, τ 0.44, P < 0.0002 and τ 0.36, P < 0.0031). PLI showed a correlation with surface ILD of apices (τ 0.25, P < 0.039), midfields (τ 0.46, P < 0.0001) and lung bases (τ 0.51, *P < *0.0001) and with core ILD of midfields (τ 0.38, P < 0.0015) and lung bases (τ 0.42, P < 0.0003) (Table 3).
When a multivariate linear regression model was implemented to assess the association between LUS scores and core or surface ILD, an increase in BLs and PLI was independently associated with total surface ILD (Table 4).
BLs of lung bases showed a correlation with ILD (τ 0.32, *P < *0.0001), GGO (τ 0.29, P < 0.002) and RET (τ 0.32, *P < *0.0001) volumes of lung bases at qCT. At lung midfields, BLs correlated with ILD (τ 0.17, P < 0.039) and RET volumes (τ 0.24, P < 0.0029) (Fig. 1A).
Correlogram showing the Kendall’s correlation with reported τ coefficient and P-values of B-lines and PLI score with three-levels qCT analysis. GGO: ground-glass opacities; PLI: pleural line irregularity; qCT: automated quantitative computed tomography; RET: reticulations
PLI score of both lung bases and midfields correlated with ILD (respectively, τ 0.4, *P < *0.0001 and τ 0.34, *P < *0.0001), GGO (τ 0.36, *P < *0.0001 and τ 0.26, P < 0.0015) and RET (τ 0.36, *P < *0.0001 and τ 0.37, *P < *0.0001) volumes of the same fields on qCT (Fig. 1B).
In multiple linear regression analysis, both basal lung BLs and PLI score were associated with basal ILD, and basal PLI score was also associated with basal GGO in a model that accounted for immunosuppressant use as a confounding factor. This association persisted even after adjusting for covariates such as age, disease duration, ILD duration and smoking (Table 5).
Regarding PFTs values, both total BLs and PLI negatively correlated with predicted FEV1% (τ −0.27, *P < *0.0184 and τ −0.3, *P < *0.0063), FVC% (τ −0.33, *P < *0.0027 and τ −0.4, *P < *0.0003), DLCO% (τ −0.27, *P < *0.0159 and τ −0.4, *P < *0.0002) and TLC% (τ −0.35, *P < *0.0016 and τ −0.48, *P < *0.0001).
Additionally, comparing PFTs witch qCT, FVC% negatively correlated with ILD, GGO and RET volumes of both whole lung (*P < *0.0005) and apices, midfields and bases (*P < *0.05). On the other hand, DLCO% negatively correlated only with total ILD volume, but at three-levels analysis a negative correlation with ILD, GGO and RET volumes of apices, midfields and bases emerged (*P < *0.05). Finally, FVC% showed a negative correlation with overall surface and core ILD, GGO and RET volumes, whereas DLCO% negatively correlated with surface ILD, GGO and RET (*P < *0.05), but only with core lung GGO (*P < *0.0088).
Discussion
The present study showed that quantitative LUS BLs and PLI score correlate with total ILD, GGO, RET and fibrosis volumes as identified by automated qCT. These results are consistent with our preliminary study and underscore the potential of LUS as a non-invasive tool for SSc-ILD assessment [23]. Moreover, as a novel finding, LUS scores were found to correlate with ILD of both the lung surface and core. In addition, these US scores were found to be associated with ILD and ILD-related changes volume on three-levels qCT, confirming again our preliminary results [23].
Our data showed that ILD, GGO and RET were prevalent at the periphery than in the core, in line with NSIP characteristics [25]. Both LUS scores correlated with total lung surface and core ILD. This finding is particularly relevant, as one of the known limitations of LUS in ILD evaluation is its restricted ability to assess deeper parenchymal areas. However, in the context of SSc-ILD, which often presents with NSIP pattern predominantly affecting subpleural regions, this limitation may be less impactful [25].
However, at three-levels qCT analysis, basal BLs were found to correlate with basal lung surface and core ILD, whereas PLI score at three-levels qCT correlated with the whole-lung surface ILD volume and with core ILD of lung bases and midfields. These results are open to several considerations. Firstly, it seems that both LUS scores, even if affected by the presence of surface ILD, are associated to the ILD of the lung core, and this aspect in our study is more evident at the level of lung bases, which are also the area most frequently affected by SSc-ILD. Beyond the periphery, SSc-ILD presenting as NSIP is usually predominant at lung bases [25], and accordingly, LUS scores focusing on lung bases assessment have been proposed [22]. Therefore, following the natural course of ILD, an increase of the extent of ILD would lead to an increase in the severity at lung bases, which correspond to a wider involvement of the core. Hence, both BLs and PLI LUS scores at lung bases could also be used as a surrogate for core ILD detection. This would somehow allow for the traditional limitation of LUS to explore only the superficial parenchyma to be overcome and give more opportunities for LUS use in the assessment of SSc-ILD. Additionally, these results further appraise the utility of PLI for a comprehensive LUS assessment of SSc-ILD. As mentioned above, in fact, most of the current ultrasound scores are based on B-line evaluation. On the other hand, the role of PLI in the assessment of LUS is becoming more established [17]. Indeed, a reduction of PLI score was found to occur during nintedanib therapy in SSc-ILD patients [16].
Moreover, a negative correlation with PFTs values and both LUS score emerged, in agreement with literature data [12]. These data further reinforce the role of the PLI score we proposed in the LUS assessment of SSc-ILD [23], and the utility of the simplified 14-scans assessment method proposed by Gutierrez and colleagues [18]: this confirms that LUS could be a valid instrument to justify functional worsening with lung parenchymal abnormalities, adding useful and alternative data to address patients’ management.
Finally, our results show a correlation of qCT analysis with PFTs values, particularly FVC%, confirming the reliability of qCT in reflecting lung function [27, 28]. In addition, FVC% values were found to be associated with ILD and ILD-related changes volume in the lung core, suggesting that these structural changes may have an influence on functional aspect.
Limitations of this study are the relatively small sample size and it single-centre design. Moreover, although the percentage of patients with ILD is representative of the prevalence of the complication, some selection bias is present, as patients who had to have CT scans were selected, a proportion of whom did so for follow-up of ILD, thus increasing the pre-test probability of ILD presence. Our results should certainly be confirmed by other independent scenarios. The present study did not evaluate the sensitivity of LUS scores to temporal changes in ILD progression or treatment response over time, which remains to be established in future longitudinal studies. Furthermore, a valuable topic for future research would be the comparison of operator time and resource utilization between the two diagnostic tools used, which could not be assessed within the scope of the present study.
In conclusion, this study shows a correlation between LUS findings with ILD and lung fields ILD at qCT analysis, confirming and expanding our preliminary results. Additionally, for the first time, LUS findings (especially the PLI score proposed by our group) were found to correlate also with core lung ILD volume, suggesting the possibility of overcoming the traditional LUS limits to explore only superficial lung parenchyma.
The reference list from the paper itself. Each links out to its DOI / PubMed record.
- 1Volkmann ER , Andréasson K, Smith V. Systemic sclerosis. Lancet 2023;401:304–18.36442487 10.1016/S 0140-6736(22)01692-0PMC 9892343 · doi ↗ · pubmed ↗
- 2Perelas A , Silver RM, Arrossi AV, Highland KB. Systemic sclerosis-associated interstitial lung disease. Lancet Respir Med 2020;8:304–20.10.1016/S 2213-2600(19)30480-132113575 · doi ↗ · pubmed ↗
- 3Mismetti V , Si-Mohamed S, Cottin V. Interstitial lung disease associated with systemic sclerosis. Semin Respir Crit Care Med 2024;45:342–64.38714203 10.1055/s-0044-1786698 · doi ↗ · pubmed ↗
- 4Raghu G , Montesi SB, Silver RM et al Treatment of systemic sclerosis-associated interstitial lung disease: evidence-based recommendations. An Official American Thoracic Society Clinical Practice Guideline. Am J Respir Crit Care Med 2024;209:137–52.37772985 10.1164/rccm.202306-1113 STPMC 10806429 · doi ↗ · pubmed ↗
- 5Johnson SR , Bernstein EJ, Bolster MB et al 2023 American College of Rheumatology (ACR)/American College of Chest Physicians (CHEST) Guideline for the Screening and Monitoring of Interstitial Lung Disease in People with Systemic Autoimmune Rheumatic Diseases. Arthritis Care Res 2024;76:1070–82.10.1002/acr.25347 PMC 1264646038973729 · doi ↗ · pubmed ↗
- 6Khanna SA , Nance JW, Suliman SA. Detection and monitoring of interstitial lung disease in patients with systemic sclerosis. Curr Rheumatol Rep 2022;24:166–73.10.1007/s 11926-022-01067-5PMC 939907035499699 · doi ↗ · pubmed ↗
- 7Makol A , Nagaraja V, Amadi C et al Recent innovations in the screening and diagnosis of systemic sclerosis-associated interstitial lung disease. Expert Rev Clin Immunol 2023;19:613–26.10.1080/1744666 X.2023.2198212 PMC 1069851436999788 · doi ↗ · pubmed ↗
- 8Landini N , Orlandi M, Calistri L et al Advanced and traditional chest MRI sequence for the clinical assessment of systemic sclerosis related interstitial lung disease, compared to CT: disease extent analysis and correlations with pulmonary function tests. Eur J Radiol 2024;170:111239.38056347 10.1016/j.ejrad.2023.111239 · doi ↗ · pubmed ↗