The Biological and Prognostic Implications of the Nicotinic Acetylcholine Receptor α3, α5, and α7 Subunits in Oral Squamous Cell Carcinoma
Chi‐Maw Lin, Long‐Wei Lin, Tseng‐Cheng Chen, Yi‐Ling Ye, Bor‐Luen Chiang

TL;DR
This study explores how nicotinic acetylcholine receptor subunits CHRNA3, CHRNA5, and CHRNA7 affect oral squamous cell carcinoma, linking their expression to cancer progression and treatment response.
Contribution
The paper identifies distinct roles for CHRNA3, CHRNA5, and CHRNA7 in epithelial-mesenchymal transition and treatment resistance in oral and head and neck cancers.
Findings
CHRNA3 promotes epithelial-mesenchymal transition and mesenchymal traits in oral cancer.
CHRNA5 is associated with poor prognosis and tumor dissemination in head and neck cancer.
CHRNA7 maintains a hybrid epithelial-mesenchymal state and influences treatment response.
Abstract
The divergent loop structures of nicotinic acetylcholine receptor (nAChR) α3, α5, and α7 subunits (encoded by CHRNA3, CHRNA5, and CHRNA7) are involved in kinase phosphorylation and signal transduction, potentially affecting oral squamous cell carcinoma (OSCC), the most common head and neck cancer (HNC). However, their specific roles in OSCC remain unclear. We integrated analyses of SCC‐4 tongue cancer cells with CHRNA overexpression, immunohistochemistry of OSCC pathological specimens, and data from the cancer genome atlas (TCGA), DepMap, and Puram 2017 to assess CHRNA3, CHRNA5, and CHRNA7 in OSCC/HNC. In OSCC, CHRNA3, CHRNA5, and CHRNA7 expression interacted with epithelial–mesenchymal transition (EMT) markers and correlated with invasive patterns. CHRNA3 reduced epithelial and enhanced mesenchymal traits, supporting EMT. CHRNA5 further promoted mesenchymal features, was linked to…
Genes, proteins, chemicals, diseases, species, mutations and cell lines named across the full text — each resolved to its canonical identifier and authoritative record.
Click any figure to enlarge with its caption.
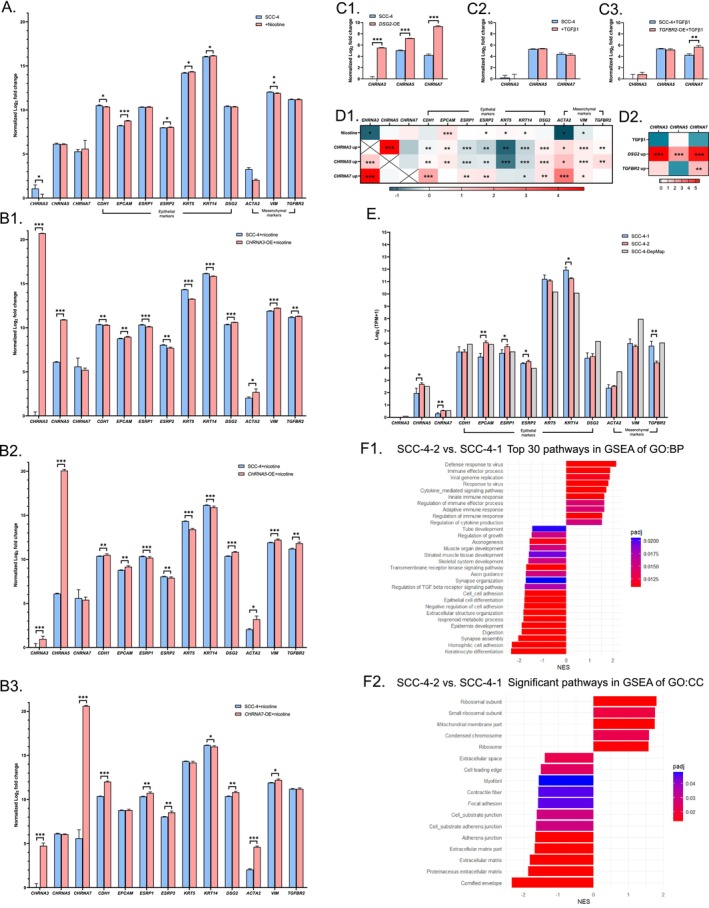 FIGURE 1
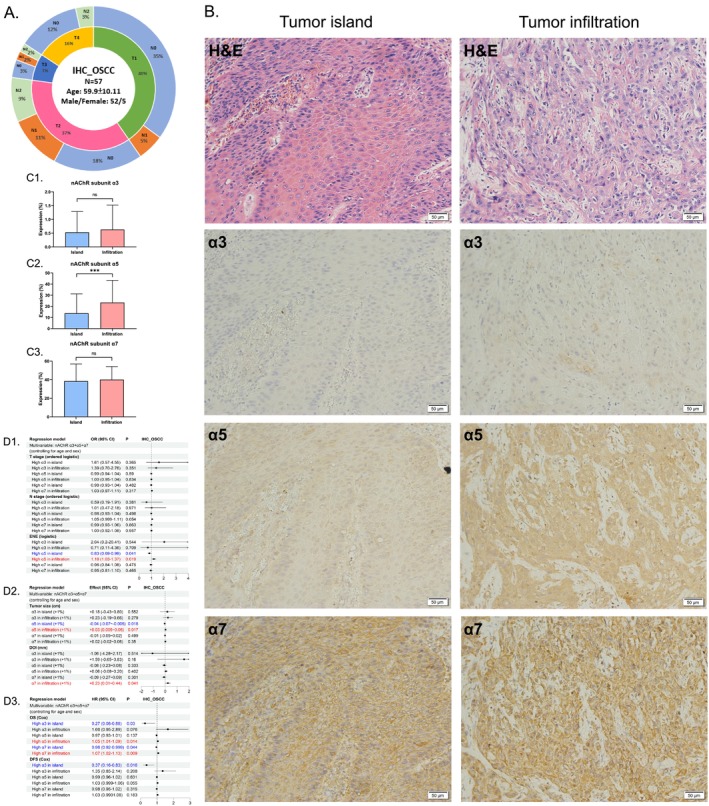 FIGURE 2
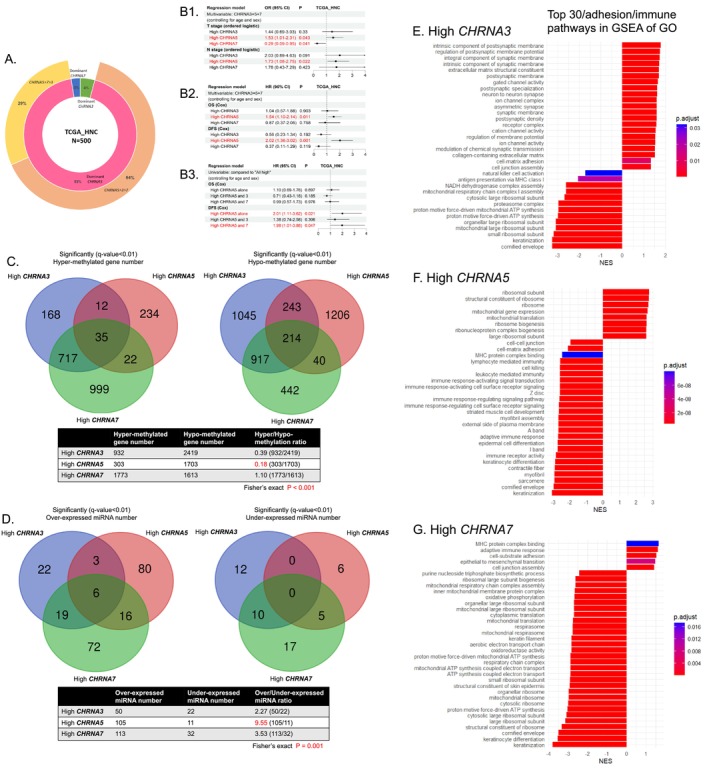 FIGURE 3
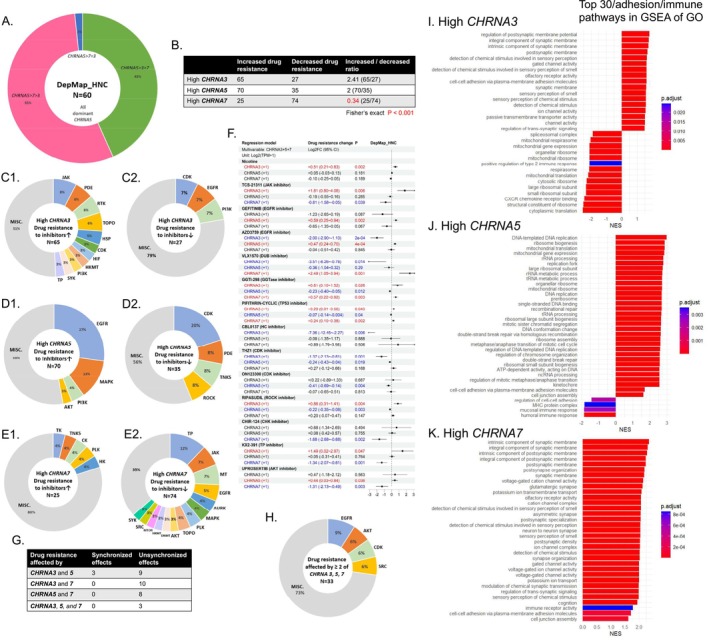 FIGURE 4
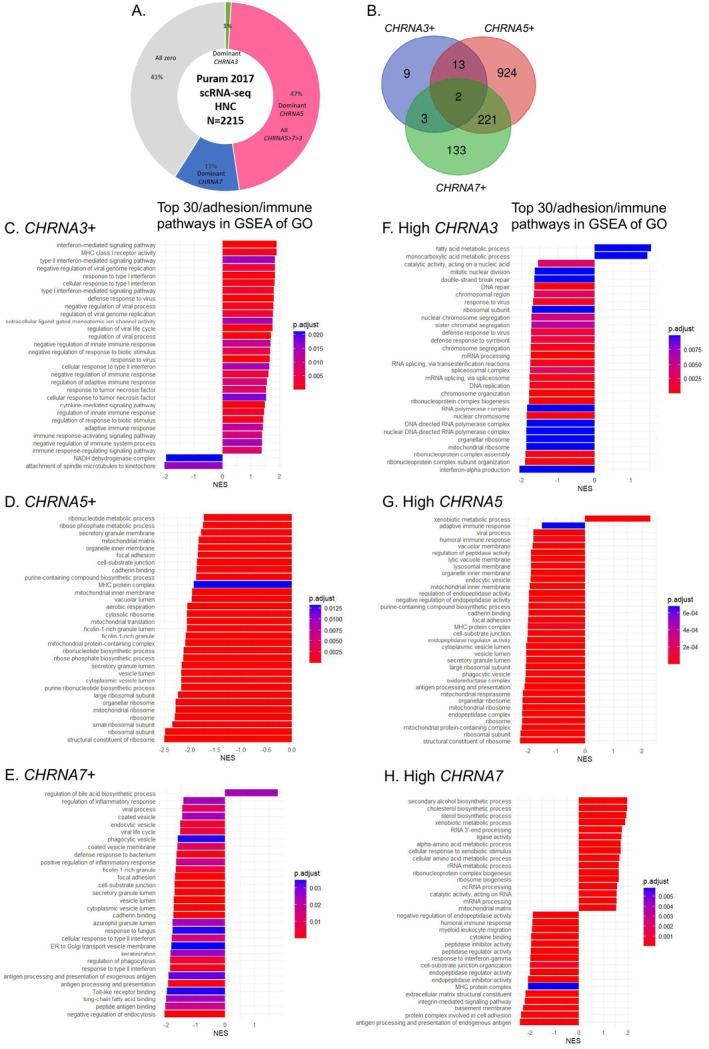 FIGURE 5
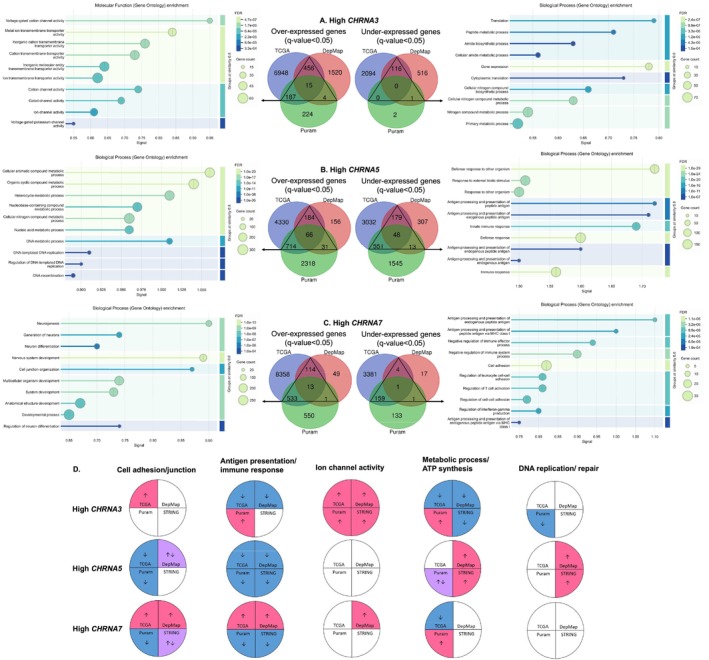 FIGURE 6
- —National Science and Technology Council10.13039/501100020950
- —National Taiwan University Hospital Yunlin Branch10.13039/501100022294
Peer Reviews
No public reviews on file for this paper yet. If you reviewed it on a platform where reviews are public (OpenReview, ICLR, NeurIPS, ICML), you can paste yours below so the community can read it here.
Videos
No videos yet. Explain this paper in a talk, walkthrough, or lecture? Add one.
Taxonomy
TopicsNicotinic Acetylcholine Receptors Study · Vagus Nerve Stimulation Research · Ion channel regulation and function
Introduction
1
Smoking and its major ingredient nicotine are responsible for the development and deterioration of head and neck cancer (HNC), which accounted for more than 744,000 new cases and 364,000 deaths in 2020, the majority of which were oral squamous cell carcinoma (OSCC) [1, 2, 3, 4]. The nicotinic acetylcholine receptors (nAChRs), which are activated by exogenous nicotine in cigarettes or by endogenous acetylcholine (ACh) in cancer cells, are expressed on both neuronal and nonneuronal tissues and are involved in tobacco dependence as well as multiple tumorigenic signaling pathways, facilitating HNC growth and metastasis [5, 6]. The nAChRs are ligand‐gated ion channels that consist of five homomeric or heteromeric subunits (α, β, γ, ε, and δ) with different isoforms of the α and β subunits (α1‐α10, β1‐β4) [5, 6]. The α subunit, which is encoded by the CHRNA gene, harbors a disulfide bond that is essential for the ligand‐binding orthosteric site, and a functional nAChR requires at least two α subunits [5, 7].
In our previous work, we explored the expression of different nAChR subunits in OSCC and found that the α3, α5, and α7 subunits were related to unchanged, decreased, and increased epithelial features, respectively [8]. An increase in subunit α5 was also associated with a decrease in local immune cells and a worse prognosis, while increases in subunit α3 and α7 were related to increased local immune cells in OSCC [8]. The α7 subunits commonly form the homomeric nAChR, whereas the α3 and α5 subunits could only join in the heteromeric nAChR (Figure S1) [6, 9]. Subunit α5 is generally thought to assemble only in the accessory subunit of the nAChR (there was at most one accessory subunit among a total of five subunits of the nAChR), which did not directly participate in the formation of orthosteric binding sites [9]. The main polypeptide chains of subunit α3, α5, and α7 are highly similar but the large cytoplasmic M3–M4 loops of them differ greatly in the AlphaFold protein structure database (Figure S1) [10, 11, 12]. This loop contains the phosphorylation sites for various tyrosine and serine/threonine kinases, which are involved in downstream nonionic signal transduction [6, 9]. The divergent loop composition and structure of the α3, α5, and α7 subunits could influence tumor cells to exhibit different biological behaviors. Nevertheless, there is still limited knowledge about the effects of different nAChR subunits on OSCC/HNC. Therefore, we conducted this study using the SCC‐4 tongue cancer cell line, immunohistochemistry (IHC) of OSCC pathological specimens, tissue buck sequencing database (The Cancer Genome Atlas; TCGA), cell line sequencing database (DepMap), and single‐cell RNA sequencing (scRNA‐seq) database (Puram 2017) [13]. Further gene set enrichment analysis (GSEA) and protein–protein interaction (PPI) network functional enrichment analysis were also adopted to interpret the influences of CHRNA3, CHRNA5, and CHRNA7 in HNC.
Materials and Methods
2
Cell Culture, Transfection, and Stimulants
2.1
The SCC‐4 tongue cancer cell line was purchased from the Bioresource Collection and Research Center in Taiwan and cultured in Dulbecco's modified Eagle's medium/Ham's F12 (Gibco) supplemented with 10% fetal bovine serum (Gibco), 1% penicillin–streptomycin–amphotericin B (Gibco), and 400 ng/mL hydrocortisone (TargetMol). The cells were maintained at 37°C in a humidified 5% CO_2_ incubator.
Before transfection, the SCC‐4 cells were seeded in six‐well plates at a density of 2.5 × 10^5^ cells/2 mL and cultured for 24 h. Plasmid DNA expression vectors targeting CHRNA3, CHRNA5, CHRNA7, DSG2, and TGFBR2 (costum synthesis by GeneDireX) (2.5 μg of each expression vector) were successively transfected into the SCC‐4 cells using Lipofectamine 2000. Nicotine (1 μM) (TargetMol) and TGFβ1 (2.5 ng/mL) (Gibco) were used as stimulants for nAChRs and TGFBRs, respectively.
Quantitative Reverse Transcription Polymerase Chain Reaction (qRT‐PCR)
2.2
The transfected SCC‐4 cells were cultured for 48 h, and total RNA was extracted from the cells using a Total RNA Isolation Kit (GeneDireX). Afterward, total RNA was reverse‐transcribed to complementary DNA (cDNA) using a GScript First‐Strand Synthesis Kit (GeneDireX). Quantitative PCR of cDNA was subsequently performed with MorreSYBR qPCR Master Mix (MORREBIO) using paired primers for CHRNA3, CHRNA5, CHRNA7, CDH1, EPCAM, ESRP1, ESRP2, KRT5, KRT14, DSG2, ACTA2, VIM, TGFBR2, and GAPDH (designed by GeneDireX). GAPDH was used as the endogenous control. The normalized fold change in the expression of each gene between different groups was calculated using the 2^−∆∆Ct^ method based on the gene with the highest Ct value.
RNA Extraction and RNA Sequencing (RNA‐Seq)
2.3
The seeded SCC‐4 cells were collected after 48 h of incubation, and their total RNA was extracted by Trizol (Invitrogen). The RNA concentration was determined by the NanoDrop One spectrophotometer (Thermo Fisher), and the RNA integrity was assessed by the 2100 Bioanalyzer instrument (Agilent). Total RNA was sent for library preparation utilizing the Illumina Stranded mRNA Prep, Ligation kit, and RNA‐seq was performed with paired‐end 150 base pairs by Illumina NovaSeq 6000.
The processes of upstream data analyses included the adapter trimming (BBDuk), the quality control (FastQC), and the quantification of gene expression (Salmon) [14]. The downstream data analyses were performed on the platform of ExpressAnalyst, in which the differentially expressed genes (DEGs) were explored using the DESeq2 method [15, 16].
Patient Collections and IHC Staining
2.4
OSCC patients diagnosed during 2014–2016 at National Taiwan University Hospital, Yun‐Lin Branch were retrospectively enrolled, and their clinical follow‐up data were recorded up to July 2021. The ICD‐10 codes for these OSCC patients are C00, C02–C06, and C14. Patients lacking pathological reports or lost to follow‐up after treatment were excluded. The TNM (tumor, node, and metastases) status of OSCC was classified according to the 2018 criteria of the American Joint Committee on Cancer (AJCC) [17].
The IHC staining of nAChR α3, α5, and α7 subunits was performed using formalin‐fixed, paraffin‐embedded (FFPE) primary tumor sections according to a standard protocol [8]. The antibody–antigen complex was visualized using diaminobenzidine tetrachloride (DAB) as the chromogen. Primary antibodies specific to the nAChR α3, α5, and α7 subunits were obtained from Abcam (ab183097), Thermo Fisher Scientific (PA5‐79046), and Abcam (ab216485), respectively.
Images of the stained slides were captured at 200× magnification. The expression levels of nAChR α3, α5, and α7 subunits were quantified using ImageJ (version 1.53 k) with the plugin IHC‐toolbox [18]. The detection threshold was set at 170 for the 8‐bit grayscale images, and the percentage of stained areas in the entire image was used to represent IHC expression levels.
Database Processing
2.5
Clinical and bulk RNA‐seq data from the TCGA OSCC and HNC cohorts were assessed via cBioPortal (Firehose Legacy) and UCSC Xena (GDC TCGA Head and Neck Cancer) [19, 20, 21, 22]. RNA‐seq and drug sensitivity data for HNC cell lines were retrieved from DepMap [23, 24]. scRNA‐seq data of the HNC cohort (Puram 2017) were acquired from UCSC Xena [13]. The functional enrichment analysis of PPI networks was implemented using the STRING database [25]. The Gene Ontology (GO) term was adopted for pathway enrichment analysis [26, 27, 28, 29, 30, 31].
Statistical Analyses
2.6
The statistical calculations and graphical delineations of the comparative studies were executed using GraphPad Prism (version 9), Stata (version 13), and R (version 4.2.2). For RNA‐seq data, normalized counts were utilized in the differential expression gene (DEG) analyses. Fragments per kilobase of transcript per million mapped reads (FPKM) or transcripts per million (TPM) were log_2_(FPKM + 1) or log_2_(TPM + 1) transformed and utilized in the comparison of specific gene expression levels. DEG analysis was performed using the ExpressAnalyst platform (for our RNA‐seq data), the cBioPortal platform (for TCGA), the DESeq2 package in R (for DepMap), and the multiple T tests (for Puram 2017 because normalized counts were unavailable). GSEA was performed using the clusterProfiler package in R [32]. Donut charts, pie charts, forest plots, and Venn diagrams were created using Excel (Microsoft 365), PowerPoint (Microsoft 365), the forestploter package in R, and an online tool (https://bioinformatics.psb.ugent.be/webtools/Venn/), respectively. A q value or adjusted p value less than 0.05 was considered statistically significant in the multiple T tests, DEGs, and enrichment analyses. Otherwise, a p value below 0.05 indicated a statistically significant result.
Results
3
CHRNA3
, CHRNA5 , CHRNA7 , as well as Epithelial and Mesenchymal Markers Mutually Influenced Each Other in SCC‐4 Cells
3.1
The qRT‐PCR analysis revealed that CHRNA5 expression was highest, followed by CHRNA7 and then CHRNA3, in SCC‐4 tongue cancer cells (Figure 1A). Nicotine (1 μM) increased the expression of epithelial markers (EPCAM, ESRP2, and KRT5/14) but decreased the levels of CHRNA3 and mesenchymal markers (ACTA2 and VIM) (Figure 1A,D1). Overexpression of CHRNA3, CHRNA5, and CHRNA7 via plasmid‐mediated transient transfection significantly increased the levels of CHRNA5, CHRNA3, and CHRNA3, respectively (Figure 1B,D1). Overexpression of CHRNA3 and CHRNA5 both increased the levels of all mesenchymal markers and decreased that of most epithelial markers, while overexpression of CHRNA7 increased the expression of most epithelial and mesenchymal markers. On the other hand, overexpression of DSG2 increased the expression of CHRNA3, CHRNA5, and CHRNA7 (Figure 1,C1,D2). Although TGFβ1 (2.5 ng/mL) did not significantly alter the expression of CHRNA3, CHRA5, or CHRNA7, overexpression of TGFBR2 significantly increased the expression of CHRNA7 (Figure 1,C2,C3,D2). These findings suggested that CHRNA3, CHRNA5, CHRNA7, as well as epithelial and mesenchymal markers mutually influenced each other. The effects of CHRNA3 and CHRNA5 on epithelial markers were similar but differed from those of CHRNA7. CHRNA3 and CHRNA5 appeared to promote the epithelial–mesenchymal transition (EMT) process, while CHRNA7 likely facilitated the maintenance of a hybrid EMT state.
*Influences of CHRNA3, CHRNA5, and CHRNA7 expression in SCC‐4 tongue cancer cells. (A) The effects of nicotine (1 μM) treatment (qRT‐PCR). (B1–B3) The effects of overexpressed CHRNA3, CHRNA5, and CHRNA7, respectively (qRT‐PCR). (C1–C3) The effects of overexpressed DSG2, TGFβ1 treatment (2.5 ng/mL), and overexpressed TGFBR2, respectively (qRT‐PCR). (D1–D2) Summary of the qRT‐PCR results. (E) The expression patterns of our SCC‐4 cells at two different time points (SCC‐4‐1 and SCC‐4‐2) and the DepMap SCC‐4 cells (RNA‐seq). (F1–F2) GSEA results comparing SCC‐4‐2 cells to SCC‐4‐1 cells. qRT‐PCR, quantitative reverse transcription polymerase chain reaction. RNA‐seq, RNA sequencing. TPM, transcripts per million. GO, gene ontology. BP, biological process. CC, cellular component. *, p < 0.05. **, p < 0.01. **, p < 0.001.
The Expression of
CHRNA5 and CHRNA7 Were Related to Cell Adhesion and Immune Responses in SCC‐4 Cells
3.2
SCC‐4 cells used in our experiments were collected at two different time points (SCC‐4‐1 and SCC‐4‐2) and subjected to RNA‐seq analysis. Our SCC‐4 cells and the SCC‐4 cells in the DepMap database shared similarities in the expression patterns of CHRNA3, CHRNA5, CHRNA7, as well as epithelial and mesenchymal markers, which were compatible with our qRT‐PCR results (Figure 1E). The bench effects on gene expression in our SCC‐4 cells were further analyzed, and revealed that SCC‐4‐2 cells had higher expression of CHRNA5, CHRNA7, EPCAM, and ESRP1/2, and lower expression of KRT14 and TGFBR2 than SCC‐4‐1 cells. The GSEA revealed that SCC‐4‐2 cells had increased immune responses and decreased cell adhesion/junction compared to SCC‐4‐1 cells (Figure 1F). These findings suggested that the expression of CHRNA5 and CHRNA7 might be related to cell adhesion and immune responses, which warrants further verification.
Clinical Characteristics of Patients in Our Series and in the TCGA Database
3.3
We analyzed three patient cohorts: 57 OSCC patients from our series (IHC_OSCC) and two cohorts from the TCGA database, including 500 HNC patients (TCGA_HNC) and 308 OSCC patients (TCGA_OSCC) (Table S1). Compared with the TCGA cohorts, our series had a lower mean age (59.9 vs. 61.08–61.8 years), a higher proportion of male patients (91.23% vs. 67.53%–73.4%), a lower proportion of advanced T‐stage cases (22.81% vs. 53.4%–53.9%), and fewer node‐positive cases (31.58% vs. 47.2%–48.05%). The cohorts had similar proportions of smokers (54.39% vs. 54.22%–61.4%), while our series had a lower proportion of alcohol users (31.58% vs. 52.6%–56%) and included 45.61% betel nut chewers (data not available in the TCGA database). These differences might contribute to variations in the analysis results.
High Expression of nAChR Subunits α5 and α7 in Tumor‐Infiltrating Areas, and Low Expression of α3, α5, and α7 in Tumor Islands, Were Associated With Worse Pathological Features and Poor Prognosis in OSCC Patients
3.4
Fifty‐seven OSCC patients were enrolled and the IHC staining of primary tumor specimens was performed. This cohort was male‐dominant, with a mean age of 59.9, and had the largest number of T1N0 and T2N0 patients (Figure 2A). The expression levels of nAChR α3, α5, and α7 subunits on the components of tumor islands (clusters of tumor cells with broad pushing margin) and tumor infiltration (clusters of tumor cells with finger‐like projection or diffuse invasion) were measured in the same section (Figure 2B). The tumor infiltration portion had a significantly higher subunit α5 level than the tumor island portion, whereas no significant difference was noted for subunit α3 or α7 (Figure 2C). Multivariable regression models (controlling for age and sex) revealed that a high subunit α3 level in tumor islands was related to better overall survival (OS) and disease‐free survival (DFS) (Figure 2D). A high subunit α5 level in tumor islands was related to smaller tumor size and a lower incidence of extranodal extension (ENE), while a high subunit α5 level in tumor infiltration was related to increased possibilities of ENE and worse OS. A high subunit α7 level in tumor islands was related to better OS, while a high subunit α7 level in tumor infiltration was associated with an increased depth of invasion (DOI) and worse OS. Regression models analyzing α3, α5, and α7 subunits individually in survival analysis, adjusted for age and sex, produced results generally consistent with those from a model including all three subunits simultaneously (Figure S2). These findings suggested that high expression of subunits α5 and α7 in tumor infiltration deteriorated the invasion patterns of OSCC and was related to a poor prognosis. Subunit α5 might facilitate a decrease in cell adhesion.
*Influences of nAChR subunits α3, α5, and α7 expression in OSCC pathological specimens (IHC). (A) Clinical characteristics of the OSCC patients. (B) IHC staining of subunits α3, α5, and α7 in tumor islands and tumor infiltration. (C1–C3) Differences in the IHC levels of subunits α3, α5, and α7 in tumor islands and tumor infiltration, respectively. (D1–D3) The effects of subunits α3, α5, and α7 on pathological features and survival. nAChR, nicotinic acetylcholine receptor. IHC, immunohistochemistry; ENE, extranodal extension; DOI, depth of invasion; OS, overall survival; DFS, disease‐free survival; OR, odds ratio; HR, hazard ratio; CI, confidence interval. **, p < 0.001. ns, nonsignificant.
CHRNA5
Had Greater Prognostic Impacts Than CHRNA3 and CHRNA7 in the TCGA_HNC and TCGA_OSCC Cohorts, and Was Related to Hypomethylation, miRNA Production, and a Decrease in Cell Adhesion and Immune Responses
3.5
Two cohorts of 500 HNC and 308 OSCC patients were identified in the TCGA database, in which most of the primary tumors were *CHRNA5‐*dominant (93%–95%) (Bulk RNA‐seq) (Figures 3A and S3A). In the TCGA_HNC cohort, multivariable regression models (controlling for age and sex) revealed that a high CHRNA5 level was related to an increase in the T and N stages, and worse OS/DFS, while a high CHRNA7 level was related to a decreased T stage (Figure 3B). In the group with a high CHRNA5 level (top half vs. bottom half), the patients with a high CHRNA5 level alone had the worst DFS, followed by the patients with high CHRNA5 and CHRNA7 levels (Figure 3B). In the TCGA_OSCC cohort, high CHRNA5 expression was associated with poorer DFS (Figure S3B). Separate survival regression analyses of CHRNA3, CHRNA5, and CHRNA7, adjusted for age and sex, yielded results largely consistent with a combined model including all three genes in both the TCGA_HNC and TCGA_OSCC cohorts (Figure S4).
Influences of CHRNA3, CHRNA5, and CHRNA7 expression in the TCGA‐HNC cohort. (A) Clinical characteristics of the TCGA‐HNC cohort. (B) The effects of CHRNA3, CHRNA 5, and CHRNA7 expression on pathological features and survival. (C) The effects of CHRNA3, CHRNA5, and CHRNA7 expression on DNA methylation. (D) The effects of CHRNA3, CHRNA5, and CHRNA7 expression on miRNA production. (E–G) The enriched pathways in GSEA, GO for high CHRNA3, CHRNA5, and CHRNA7 expression, respectively. HNC, head and neck cancer; OR, odds ratio; HR, hazard ratio; CI, confidence interval; GSEA, gene set enrichment analysis; GO, Gene ontology.
Regarding the epigenetic data, high CHRNA5 expression was associated with a lower hyper/hypo‐methylation ratio of genes (0.18 and 0.02) and a higher over/under‐expressed miRNA ratio (9.55 and 31) when compared with high CHRNA3 and CHRNA7 expression in both the TCGA_HNC and TCGA_OSCC cohorts (Figure 3C,D). Figure S3C,D, these findings suggested that CHRNA5 facilitated tumor progression via hypomethylation and miRNA production and had a greater prognostic impact on HNC patients than CHRNA3 and CHRNA7.
Further GSEA (the first quarter vs. the last quarter) revealed that high CHRNA3 expression was related to an increase in ion channel activities and cell adhesion/junction, and a decrease in antigen presentation and ATP synthesis (Figure 3E). High CHRNA5 expression was related to a decrease in cell adhesion/junction, immune responses, and major histocompatibility complex (MHC) protein binding (Figure 3F). High CHRNA7 expression was related to an increase in cell adhesion/junction, epithelial‐mesenchymal transition (EMT), immune responses, and MHC protein binding, and a decrease in ATP synthesis and oxidoreductase activities (Figure 3G). GSEA results were similar in both the TCGA_HNC and TCGA_OSCC cohorts (Figure S3E–G). These findings suggested that the differential expression of CHRNA3, 5, and 7 might influence HNC to exhibit different biological behaviors.
High Levels of
CHRNA3 and CHRNA5 and Low Levels of CHRNA7 Were Related to Increased Resistance to the Majority of Inhibitors in DepMap HNC Cell Lines
3.6
Sixty HNC cell lines were recognized in the DepMap database, in which all of them were *CHRNA5‐*dominant (RNA‐seq), including the SCC‐4 cell line (Figure 4A). The drug sensitivity data (log2 fold change method) of nicotine and 3117 inhibitors were then retrieved for these HNC cell lines. Multivariable regression models combining the expression of CHRNA3, CHRNA5, and CHRNA7 revealed that high CHRNA7 expression was related to the least number of drugs showing increased resistance and the greatest number of drugs showing decreased resistance (Figure 4B). High CHRNA3 expression was associated with increased resistance mainly to Janus kinase (JAK) inhibitors and decreased resistance to the inhibitors of cyclin‐dependent kinase (CDK), epidermal growth factor receptor (EGFR), and phosphoinositide 3‐kinase (PI3K) (Figure 4C). High CHRNA5 expression was associated with increased resistance to the inhibitors of EGFR, mitogen‐activated protein kinase (MAPK), PI3K, and protein kinase B (AKT), and decreased resistance primarily to CDK inhibitors (Figure 4D). High CHRNA7 expression was associated with increased resistance to but not limited to tyrosine kinase (TK) inhibitors and decreased resistance chiefly to the inhibitors of tubulin polymerization (TP), JAK, and microtubule (MT) (Figure 4E). More detailed effects of CHRNA3, CHRNA5, and CHRNA7 on drug resistance are shown in Figure 4F. The effects of nicotine were only related to CHRNA3 levels, which were compatible with our qRT‐PCR results. For inhibitors whose drug sensitivities were affected by at least two of CHRNA3, CHRNA5, or CHRNA7, primarily the inhibitors of EGFR, AKT, CDK, and SRC, the effects of CHRNA3, CHRNA5, or CHRNA7 were almost unsynchronized (Figure 4G,H). These findings suggested that high CHRNA3 or CHRNA5 levels with low CHRNA7 levels might indicate increased resistance to the majority of inhibitors. EGFR inhibitors seemed to be effective in treating high CHRNA3 or *CHRNA7‐*expressed HNC cells but not high CHRNA5‐expressed HNC cells, which could be treated effectively by CDK inhibitors.
Influences of CHRNA3, CHRNA5, and CHRNA7 expression in DepMap HNC cell lines. (A) The expression patterns of CHRNA3, CHRNA5, and CHRNA7 in DepMap HNC cell lines. (B) The number of inhibitors whose drug sensitivity was affected by the expression of CHRNA3, CHRNA5, and CHRNA7. (C1–C2, D1–D2, E1–E2) The types of inhibitors whose drug sensitivity was affected by the expression of CHRNA3, CHRNA5, and CHRNA7, respectively. (F) The resistance changes to nicotine and inhibitors affected by the expression of CHRNA3, CHRNA5, and CHRNA7. (G–H) The number and types of inhibitors whose drug sensitivity was affected by at least two of CHRNA3, CHRNA5, and CHRNA7. (I–K) The enriched pathways in GSEA:GO for high CHRNA3, CHRNA5, and CHRNA7 expression, respectively. HNC, head and neck cancer; FC, Fold change; TPM, transcripts per million; CI, confidence interval; GSEA, gene set enrichment analysis; GO, Gene ontology; JAK, Janus kinase; PDE, phosphodiesterase; RTK, receptor tyrosine kinase; TOPO, topoisomerase; HSP, heat shock protein; CDK, cyclin‐dependent kinase; HIF, hypoxia‐inducible factor; HKMT, histone lysine methyltransferase. PI3K, phosphoinositide 3‐kinase. SYK, spleen tyrosine kinase; TP, tubulin polymerization; EGFR, epidermal growth factor receptor; MAPK, mitogen‐activated protein kinase; AKT, protein kinase B; TNKS, Tankyrase ROCK, Rho kinase; TK, Tyrosine kinase; CK, casein kinase; PLK, Polo‐like kinase; HK, hexokinase; MT, microtubule; AURK, aurora kinase; DNMT, DNA methyltransferase; MTOR, mammalian target of rapamycin.
Further GSEA (the first quarter vs. the last quarter) revealed that high CHRNA3 expression was related to an increase in ion channel activities and a decrease in immune responses and mitochondrial respirasome activities (Figure 4I). High CHRNA5 expression was related to an increase in DNA replication and double‐strand break repair (which might increase drug resistance), a decrease in MHC complex presentation and immune responses, and an increase/decrease in cell adhesion/junction (Figure 4J). High CHRNA7 expression was related to an increase in ion channel activities, immune receptor activities, and cell adhesion/junction (Figure 4K). These findings were generally compatible with our TCGA analyses.
The Presence and Expression Levels of
CHRNA3 , CHRNA5 , and CHRNA7 Affected Cell Adhesion and Immune Responses in HNC Cells (Puram 2017)
3.7
The transcriptomes (scRNA‐seq) of 2215 tumor cells from 18 HNC patients (Puram 2017) were analyzed, in which CHRNA5‐dominant cells were the most (47%), followed by the cells lacking expression of CHRNA3, CHRNA5, and CHRNA7 (41%) (Figure 5A). The number of cells that expressed exclusively one of the three genes was 9, 924, and 133 for CHRNA3, CHRNA5, and CHRNA7, respectively (Figure 5B). These cells were compared to the cells without expression of all three genes by GSEA (Figure 5C–E). Another GSEA (the first quarter vs. the last quarter) was performed for CHRNA3+, CHRNA5+, and CHRNA7+ cells, respectively (Figure 5F–H). CHRNA3 presentation was related to an increase in ion channel activities and immune responses (Figure 5C). CHRNA5 presentation was related to a decrease in cell adhesion/junction, metabolic processes, MHC complex presentation, and immune responses (Figure 5D). CHRNA7 presentation was related to a decrease in cell adhesion/junction and antigen presentation (Figure 5E). High CHRNA3 expression was related to an increase in metabolic processes and a decrease in DNA replication and repair (Figure 5F). High CHRNA5 expression was related to an increased metabolic process and a decrease in cell adhesion/junction, MHC complex presentation, and immune responses (Figure 5G). High CHRNA7 expression was related to increased metabolic processes and a decrease in cell adhesion/junction, immune responses, and antigen presentation (Figure 5H). Both the presence and high expression of CHRNA5 and CHRNA7 were related to a decrease in cell adhesion and immune responses.
Influences of CHRNA3, CHRNA5, and CHRNA7 expression in Puram 2017 (scRNA‐seq). (A, B) The expression patterns of CHRNA3, CHRNA5, and CHRNA7 in the tumor cells of HNC patients. (C–E) The enriched pathways in GSEA:GO for the presence of CHRNA3, CHRNA5, and CHRNA7, respectively. (F–H) The enriched pathways in GSEA:GO for high CHRNA3, CHRNA5, and CHRNA7 expression, respectively. GSEA, gene set enrichment analysis; GO, Gene ontology.
The Different Biological Effects of
CHRNA3 , CHRNA5 , and CHRNA7 Were Enriched in the STRING PPI Networks
3.8
The overlapping DEGs from at least two among three databases (TCGA, DepMap, and Puram 2017) associated with high CHRNA3, CHRNA5, or CHRNA7 expression were subjected to STRING PPI analyses, respectively. High CHRNA3 expression was related to increased ion channel activities and decreased metabolic processes (Figure 6A). High CHRNA5 expression was related to increased metabolic processes and decreased antigen presentation/immune responses (Figure 6B). High CHRNA7 expression was related to an increase in cell junction and differentiation, and a decrease in cell adhesion, antigen presentation, and immune responses (Figure 6C). These findings suggested that the core biological effects of CHRNA3, CHRNA5, and CHRNA7 were different in HNC.
Influences of CHRNA3, CHRNA5, and CHRNA7 expression in the STRING PPI networks. (A–C) The enriched pathways of GO for the overlapping DEGs from at least two of three databases, associated with high CHRNA3, CHRNA5, and CHRNA7 expression, respectively. (D) Comparisons of the biological effects of CHRNA3, CHRNA5, and CHRNA7 as revealed by different databases. DEGs, differentially expressed genes.
The biological effects of CHRNA3, CHRNA5, and CHRNA7, as revealed by four different databases, are compared in Figure 6D. The results for CHRNA5 were generally comparable, while discrepancies were observed between the results from different databases for CHRNA3 and CHRNA7, mainly in terms of cell adhesion, immune responses, and metabolic processes. High CHRNA3 for increased ion channel activities and high CHRNA5 for decreased immune responses were the most consistent outcomes across all databases. These findings indicated that the effects of CHRNA5 might be strong enough to ensure consistency, while the effects of CHRNA3 and CHRNA7 might be more prone to being influenced by other factors.
Discussion
4
In this study, we explored the effects of CHRNA3, CHRNA5, and CHRNA7 in OSCC using cell‐based experiments and pathological IHC, and further investigated their biological functions in HNC through bioinformatics analyses. The expression of CHRNA3, CHRNA5, CHRNA7, along with epithelial and mesenchymal markers mutually influenced each other. Their protein expression in tumor infiltration was associated with deteriorated invasion patterns. CHRNA3 maintained ion channel activity (bioinformatics analyses), decreased epithelial features, and increased mesenchymal features, thereby supporting the EMT process. CHRNA5 promoted DNA replication, reduced cell adhesion, suppressed antigen presentation, and induced hypomethylation and miRNA overexpression (bioinformatics analyses), and also attenuated epithelial features and enhanced mesenchymal traits, ultimately leading to a disseminated tumor pattern, a worse clinical stage, and a poor prognosis. CHRNA7 promoted cell differentiation and exhibited variable effects on cell adhesion and antigen presentation (bioinformatics analyses), while also enhancing both epithelial and mesenchymal characteristics, thus facilitating the maintenance of a hybrid EMT state. Analysis of the DepMap database revealed that high levels of CHRNA3 and CHRNA5 and low levels of CHRNA7 were related to increased resistance to the majority of inhibitors. EGFR inhibitors were effective in treating high CHRNA3‐ or CHRNA7‐expressing HNC, while CDK inhibitors were effective in treating high CHRNA5‐expressing HNC. Accordingly, the proposed contributions of CHRNA3, CHRNA5, and CHRNA7 to the EMT process are illustrated in Figure S5.
Docetaxel (a microtubule inhibitor) and Cetuximab (an EGFR inhibitor) are commonly used in chemotherapy regimens to treat HNC today [33]. According to our DepMap analysis, these two drugs should be effective in treating HNC exhibiting high CHRNA3 or CHRNA7 expression, but not those with high CHRNA5 expression. This is consistent with our TCGA_HNC findings in which the patients with high CHRNA5 expression alone had a worse DFS than the patients with high CHRNA3, CHRNA5, and CHRNA7 expression. Our DepMap findings also suggested that CDK inhibitors seemed to be beneficial in treating HNC exhibiting high CHRNA5 expression. The Food and Drug Administration (FDA) has approved several CDK inhibitors for treating metastatic hormone receptor‐positive breast cancer, but not yet for HNC [34]. CDK inhibitors interfere with the cell cycle, leading to decreased DNA replication, which might counteract the DNA replication‐promoting effects of high CHRNA5 expression observed in our analysis. Ongoing clinical trials are investigating the use of CDK inhibitors for treating HNC patients [35].
Cancer cells have been found to be inclined to maintain a hybrid EMT state, with strong capacities for proliferation, invasion, and metastasis [36]. To achieve this, cancer cells of epithelial origin (such as HNC) are expected to keep increasing mesenchymal features and modifying epithelial characteristics. This is consistent with our findings, where CHRNA3, CHRNA5, and CHRNA7 all increased mesenchymal features, while CHRNA3 and CHRNA5, as well as CHRNA7 had counteracting effects on epithelial characteristics. In addition, a hybrid EMT state is also characterized by decreased, but not completely lost, cell adhesion [36]. Our analysis suggested that CHRNA3 was related to increased or unchanged cell adhesion, CHRNA5 was primarily related to decreased cell adhesion, and CHRNA7 was related to both increased and decreased cell adhesion. This is consistent with our IHC findings, where tumor infiltrations had higher CHRNA5 levels than tumor islands, which was not the case for CHRNA3 and CHRNA7. Although the gene expression and prognostic impacts of CHRNA5 are usually stronger than those of CHRNA3 and CHRNA7, all three appear to be involved in the establishment of hybrid EMT states. Previous studies revealed that CHRNA3 knockout mice exhibited cell–cell detachment, while CHRNA7 knockout mice featured decreased extracellular matrix proteins in the epidermis [37, 38]. Silencing CHRNA5 was found to exert opposite effects compared to silencing CHRNA7 on cell migration in lung cancer cells [39]. CHRNA5 and CHRNA7 were found to be upregulated in lung cancer, with CHRNA5 mediating nicotine‐ and chronic stress–induced tumor progression, promoting cancer cell proliferation, migration, invasion, stemness, EMT, radio‐ and cisplatin resistance, and immune evasion, and CHRNA7 mediating nicotine‐induced PD‐L1 expression via the STAT3 pathway, collectively contributing to tumor progression, immune evasion, and poor patient survival [40, 41, 42, 43, 44]. In colorectal cancer, high CHRNA3 expression was found to be associated with poor prognosis and to exhibit a strong physical interaction with CHRNA5 [45]. In laryngeal and hypopharyngeal cancers, nAChR subunit α5 expression was found to increase with tumor progression [46]. In OSCC, CHRNA5 upregulation was found to drive radioresistance through E2F pathway activation, whereas α7‐nAChR was found to promote nicotine‐induced malignancy, enhance cell survival, and confer cisplatin resistance as well as Bcl‐2–mediated anti‐apoptotic signaling, together contributing to tumor progression and therapeutic resistance [47, 48, 49]. In HNC, CHRNA5 was found to mediate nicotine‐induced proliferation, migration, and invasion by regulating CES1 via the MEK/ERK pathway, contributing to tumor recurrence and metastasis [50]. A database analysis revealed that among nAChR subunits, CHRNA5 was the most frequently upregulated in cancer tissues compared with normal tissues, including bladder, cervical, breast, uterine, lung, stomach, esophageal, colorectal, skin, brain, thyroid cancers, and others [5]. These findings supported our results in HNC.
Regarding immune responses, a former study illustrated that lung metastatic mammary cancer cells in mice with clustered patterns had increased MHC I expression, while those with disseminated patterns had decreased MHC I expression, indicating the relationships between tumor dissemination and immune escape [51]. Previous studies have also acknowledged that cancer hybrid EMT states interact with immune responses and promote immune evasion [52, 53, 54]. In addition, it has been noticed that nicotine and nAChRs are able to result in abnormal miRNA expression to downregulate immune reactions [55]. In our study, decreased cell adhesion was generally associated with decreased antigen presentation, while increased cell adhesion was typically associated with increased antigen presentation, especially for CHRNA5 and CHRNA7. High CHRNA5 was also associated with miRNA overexpression. These were compatible with previous findings.
Numerous nAChR downstream signaling pathways, including the Ras–Raf, Ca^2+^‐PKC‐Raf, PI3K‐Akt, and JAK–STAT pathways, have been reported to facilitate cancer proliferation [5, 6]. Different nAChR subunits appeared to influence the choice of pathway, in which subunit α3 was related to an activated PKC pathway in keratinocytes, subunit α5 was related to an activated JAK–STAT pathway in lung cancer, and subunit α7 was related to an activated PI3K‐Akt pathway in OSCC [5, 6, 40, 47, 56, 57]. These findings supported our results that CHRNA3, CHRNA5, and CHRNA7 exerted different biological effects in HNC. Nevertheless, in our analyses, CHRNA3 and CHRNA7 expression influenced resistance to JAK inhibitors, while CHRNA5 expression had little effect. CHRNA3 and CHRNA5 expression influenced resistance to PI3K inhibitors, while CHRNA7 expression had little effect. These findings suggested that CHRNA3, CHRNA5, and CHRNA7 might collaborate to modulate the biological behaviors of HNC.
As of 2022, the International Agency for Research on Cancer (IARC) has classified a total of 83 substances in unburned tobacco and tobacco smoke as carcinogens, including major groups such as N‐nitrosamines (TSNAs), polycyclic aromatic hydrocarbons (PAHs), aldehydes, volatile hydrocarbons, and aromatic amines [58]. Although nicotine is not classified as a carcinogen, it is the main addictive component of tobacco and promotes the development of cancers such as lung, head and neck, pancreatic, gastric, colon, breast, and bladder by inducing genotoxic DNA damage, activating nAChR signaling to enhance proliferation and metastasis, and suppressing anti‐tumor immunity [5, 6, 59]. Nicotine increases the protein expression of nAChRs and their subunits mainly through posttranscriptional pharmacological chaperoning, which enhances receptor maturation and assembly while reducing degradation [60]. However, nicotine generally has little effect on nAChR subunit mRNA expression, although CHRNA3 transcripts are significantly reduced in smokers' lung tissues, consistent with our qRT‐PCR findings [60, 61]. Smoking cessation is the most effective strategy to prevent lung and head and neck cancers, reducing lung cancer incidence by up to 77% and HNC risk by about 60% in long‐term abstinent individuals compared with current smokers [62, 63]. Regarding the treatment of smoking‐induced cancers, selective nAChR antagonists may hold potential by precisely targeting overexpressed nAChR subunits in cancer cells and minimizing adverse effects on healthy tissues, with α7‐nAChR antagonists having been shown to inhibit lung cancer [5]. According to our results, α5‐nAChR antagonists, which are not currently available, might represent a superior option to α7‐nAChR antagonists for cancer treatment and therefore warrant further investigation.
The main limitation of our study was that in vivo experiments were not performed to explore the biological influence of nAChR subunits on OSCC. Another limitation was that only one cell line was used in our in vitro experiments. Although bioinformatic analyses across multiple databases in our study provided significant insights into the molecular and prognostic influence of different nAChR subunits in HNC, further functional validation experiments are required. In addition to overexpression, qRT‐PCR, and RNA‐seq in OSCC cells, and IHC in OSCC pathological specimens, our findings need to be further validated by multiple experimental approaches such as protein functional assays, Western blotting, and gene silencing in different HNC cancer cell lines as well as in vivo animal models. Inhibitors targeting different nAChR subunits should also be screened, with their antitumor efficacy and toxicity further evaluated in vivo. In summary, the differential expression of CHRNA3, CHRNA5, and CHRNA7 exerted prognostic and biological impacts on OSCC/HNC. CHRNA3 maintained the ion channel activities of nAChRs and frequently contributed to increased drug resistance. CHRNA5 promoted DNA replication, decreased cell adhesion and antigen presentation, commonly contributed to increased drug resistance, and worsened survival. CHRNA7 promoted differentiation, exhibited variable effects on cell adhesion and antigen presentation, and usually contributed to decreased drug resistance. The findings might shed light on future exploring potential therapeutic approaches for OSCC/HNC.
Author Contributions
Chi‐Maw Lin: conceptualization, writing – original draft, funding acquisition, formal analysis, methodology, data curation. Long‐Wei Lin: methodology, visualization. Tseng‐Cheng Chen: validation, investigation, supervision. Yi‐Ling Ye: funding acquisition, investigation, validation, supervision. Bor‐Luen Chiang: writing – original draft, writing – review and editing, supervision, data curation.
Ethics Statement
Approval of the research protocol by an Institutional Review Board: The Research Ethics Committee of the National Taiwan University Hospital approved this study (NTUH IRB‐201910107RINC).
Consent
The authors have nothing to report.
Conflicts of Interest
The authors declare no conflicts of interest.
Supporting information
Table S1: Clinical characteristics of patients in our series and in the TCGA database.
Figure S1: Schematic representation of nAChRs and predicted protein structures of the α3, α5, and α7 subunits (AlphaFold Protein Structure Database). nAChR, nicotinic acetylcholine receptor; pLDDT, predicted local distance difference test. Figure S2: The effects of nAChR α3, α5, and α7 subunit expression on survival in OSCC pathological specimens assessed by IHC, with each subunit analyzed separately and adjusted for age and sex. (A) nAChR α3 alone. (B) nAChR α5 alone. (C) nAChR α7 alone. nAChR, nicotinic acetylcholine receptor. OSCC, oral squamous cell carcinoma; IHC, immunohistochemistry; HR, hazard ratio; CI, confidence interval; OS, overall survival; DFS, disease‐free survival. Figure S3: Influences of CHRNA3, CHRNA5, and CHRNA7 expression in the TCGA‐OSCC cohort. (A) Clinical characteristics of the TCGA‐OSCC cohort. (B) 1‐3, The effects of CHRNA3, CHRNA5, and CHRNA7 expression on pathological features and survival. (C) The effects of CHRNA3, CHRNA5, and CHRNA7 expression on DNA methylation. (D) The effects of CHRNA3, CHRNA5, and CHRNA7 expression on miRNA production. (E‐G) The enriched pathways in GSEA:GO for high CHRNA3, CHRNA5, and CHRNA7 expression, respectively. OSCC, oral squamous cell carcinoma; OR, odds ratio; HR, hazard ratio; CI, confidence interval; GSEA, gene set enrichment analysis; GO: gene ontology. Figure S4: The effects of CHRNA3, CHRNA5, and CHRNA7 expression on survival in the TCGA_HNC (A1‐A3) and TCGA_OSCC (B1‐B3) cohorts, with each subunit analyzed individually and adjusted for age and sex. TCGA, The Cancer Genome Atlas. HNC, head and neck cancer; OSCC, oral squamous cell carcinoma; HR, hazard ratio; CI, confidence interval; OS, overall survival; DFS, disease‐free survival. Figure S5: Proposed contributions of CHRNA3, CHRNA5, and CHRNA7 to the EMT process. EMT, epithelial mesenchymal transition; EGFR, epidermal growth factor receptor; CDK, cyclin‐dependent kinase. ⊣, effective suppression.
The reference list from the paper itself. Each links out to its DOI / PubMed record.
- 1M. Gormley , G. Creaney , A. Schache , K. Ingarfield , and D. I. Conway , “Reviewing the Epidemiology of Head and Neck Cancer: Definitions, Trends and Risk Factors,” British Dental Journal 233, no. 9 (2022): 780–786.36369568 10.1038/s 41415-022-5166-x PMC 9652141 · doi ↗ · pubmed ↗
- 2D. E. Johnson , B. Burtness , C. R. Leemans , V. W. Y. Lui , J. E. Bauman , and J. R. Grandis , “Head and Neck Squamous Cell Carcinoma,” Nature Reviews. Disease Primers 6, no. 1 (2020): 92.10.1038/s 41572-020-00224-3PMC 794499833243986 · doi ↗ · pubmed ↗
- 3M. Sharma , S. S. Shetty , and R. Radhakrishnan , “Novel Pathways and Mechanism of Nicotine‐Induced Oral Carcinogenesis,” Recent Patents on Anti‐Cancer Drug Discovery 17, no. 1 (2021): 66–79.10.2174/157489281666621080616131234365933 · doi ↗ · pubmed ↗
- 4H. Sung , J. Ferlay , R. L. Siegel , et al., “Global Cancer Statistics 2020: GLOBOCAN Estimates of Incidence and Mortality Worldwide for 36 Cancers in 185 Countries,” CA: a Cancer Journal for Clinicians 71, no. 3 (2021): 209–249.33538338 10.3322/caac.21660 · doi ↗ · pubmed ↗
- 5T. Bele , T. Turk , and I. Krizaj , “Nicotinic Acetylcholine Receptors in Cancer: Limitations and Prospects,” Biochimica et Biophysica Acta ‐ Molecular Basis of Disease 1870, no. 1 (2024): 166875.37673358 10.1016/j.bbadis.2023.166875 · doi ↗ · pubmed ↗
- 6S. A. Grando , “Connections of Nicotine to Cancer,” Nature Reviews. Cancer 14, no. 6 (2014): 419–429.24827506 10.1038/nrc 3725 · doi ↗ · pubmed ↗
- 7L. Sansone , F. Milani , R. Fabrizi , et al., “Nicotine: From Discovery to Biological Effects,” International Journal of Molecular Sciences 24, no. 19 (2023): 14570.37834017 10.3390/ijms 241914570 PMC 10572882 · doi ↗ · pubmed ↗
- 8C. M. Lin , L. W. Lin , T. C. Chen , Y. L. Ye , and B. L. Chiang , “The Expression of Nicotinic Acetylcholine Receptor Subunits and Their Associations With Local Immune Cells and Prognosis in Oral Squamous Cell Carcinoma,” Cancer Medicine 12, no. 18 (2023): 18918–18930.37654227 10.1002/cam 4.6482 PMC 10557882 · doi ↗ · pubmed ↗