Cord Blood Appetite Hormones and Early-Life Growth and Childhood Adiposity in the ENVIRONAGE Cohort
Thaïs De Ruyter, Nathalie Michels, Rossella Alfano, Paolo Vineis, Gary Frost, Stefaan De Henauw, Michelle Plusquin, Dries S. Martens, Tim S. Nawrot

TL;DR
The study found that hormone levels in newborns' blood are linked to early growth patterns and childhood obesity risk.
Contribution
This study identifies associations between cord blood appetite hormones and early-life growth and adiposity in children.
Findings
Higher cord blood PYY and PP levels were linked to rapid early growth and higher BMI at 4-6 years.
Leptin levels were inversely associated with rapid growth in early life.
PYY and PP levels were associated with increased adiposity peak and BMI z scores in childhood.
Abstract
Are cord blood levels of appetite hormones associated with early-life growth patterns and childhood adiposity? In this birth cohort study of 325 children, cord blood peptide YY and pancreatic polypeptide levels were associated with rapid growth in early life and a higher body mass index z score at 4 to 6 years of age, whereas leptin levels were inversely associated with rapid growth. These results suggest that cord blood appetite hormone levels may contribute to early childhood growth and adiposity, potentially influencing the development of obesity. This cohort study of children in the ENVIRONAGE birth cohort explores the associations of a set of anorexigenic cord blood appetite hormone levels with postnatal growth, body mass index growth trajectories, and childhood adiposity measures. Understanding early-life origins of increased body mass is crucial because childhood obesity…
Genes, proteins, chemicals, diseases, species, mutations and cell lines named across the full text — each resolved to its canonical identifier and authoritative record.
Click any figure to enlarge with its caption.
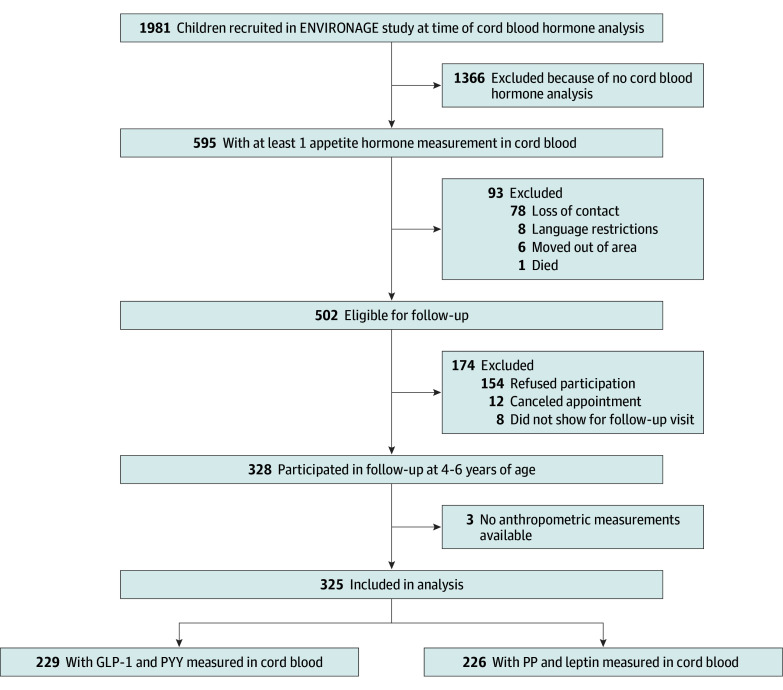 Figure 1
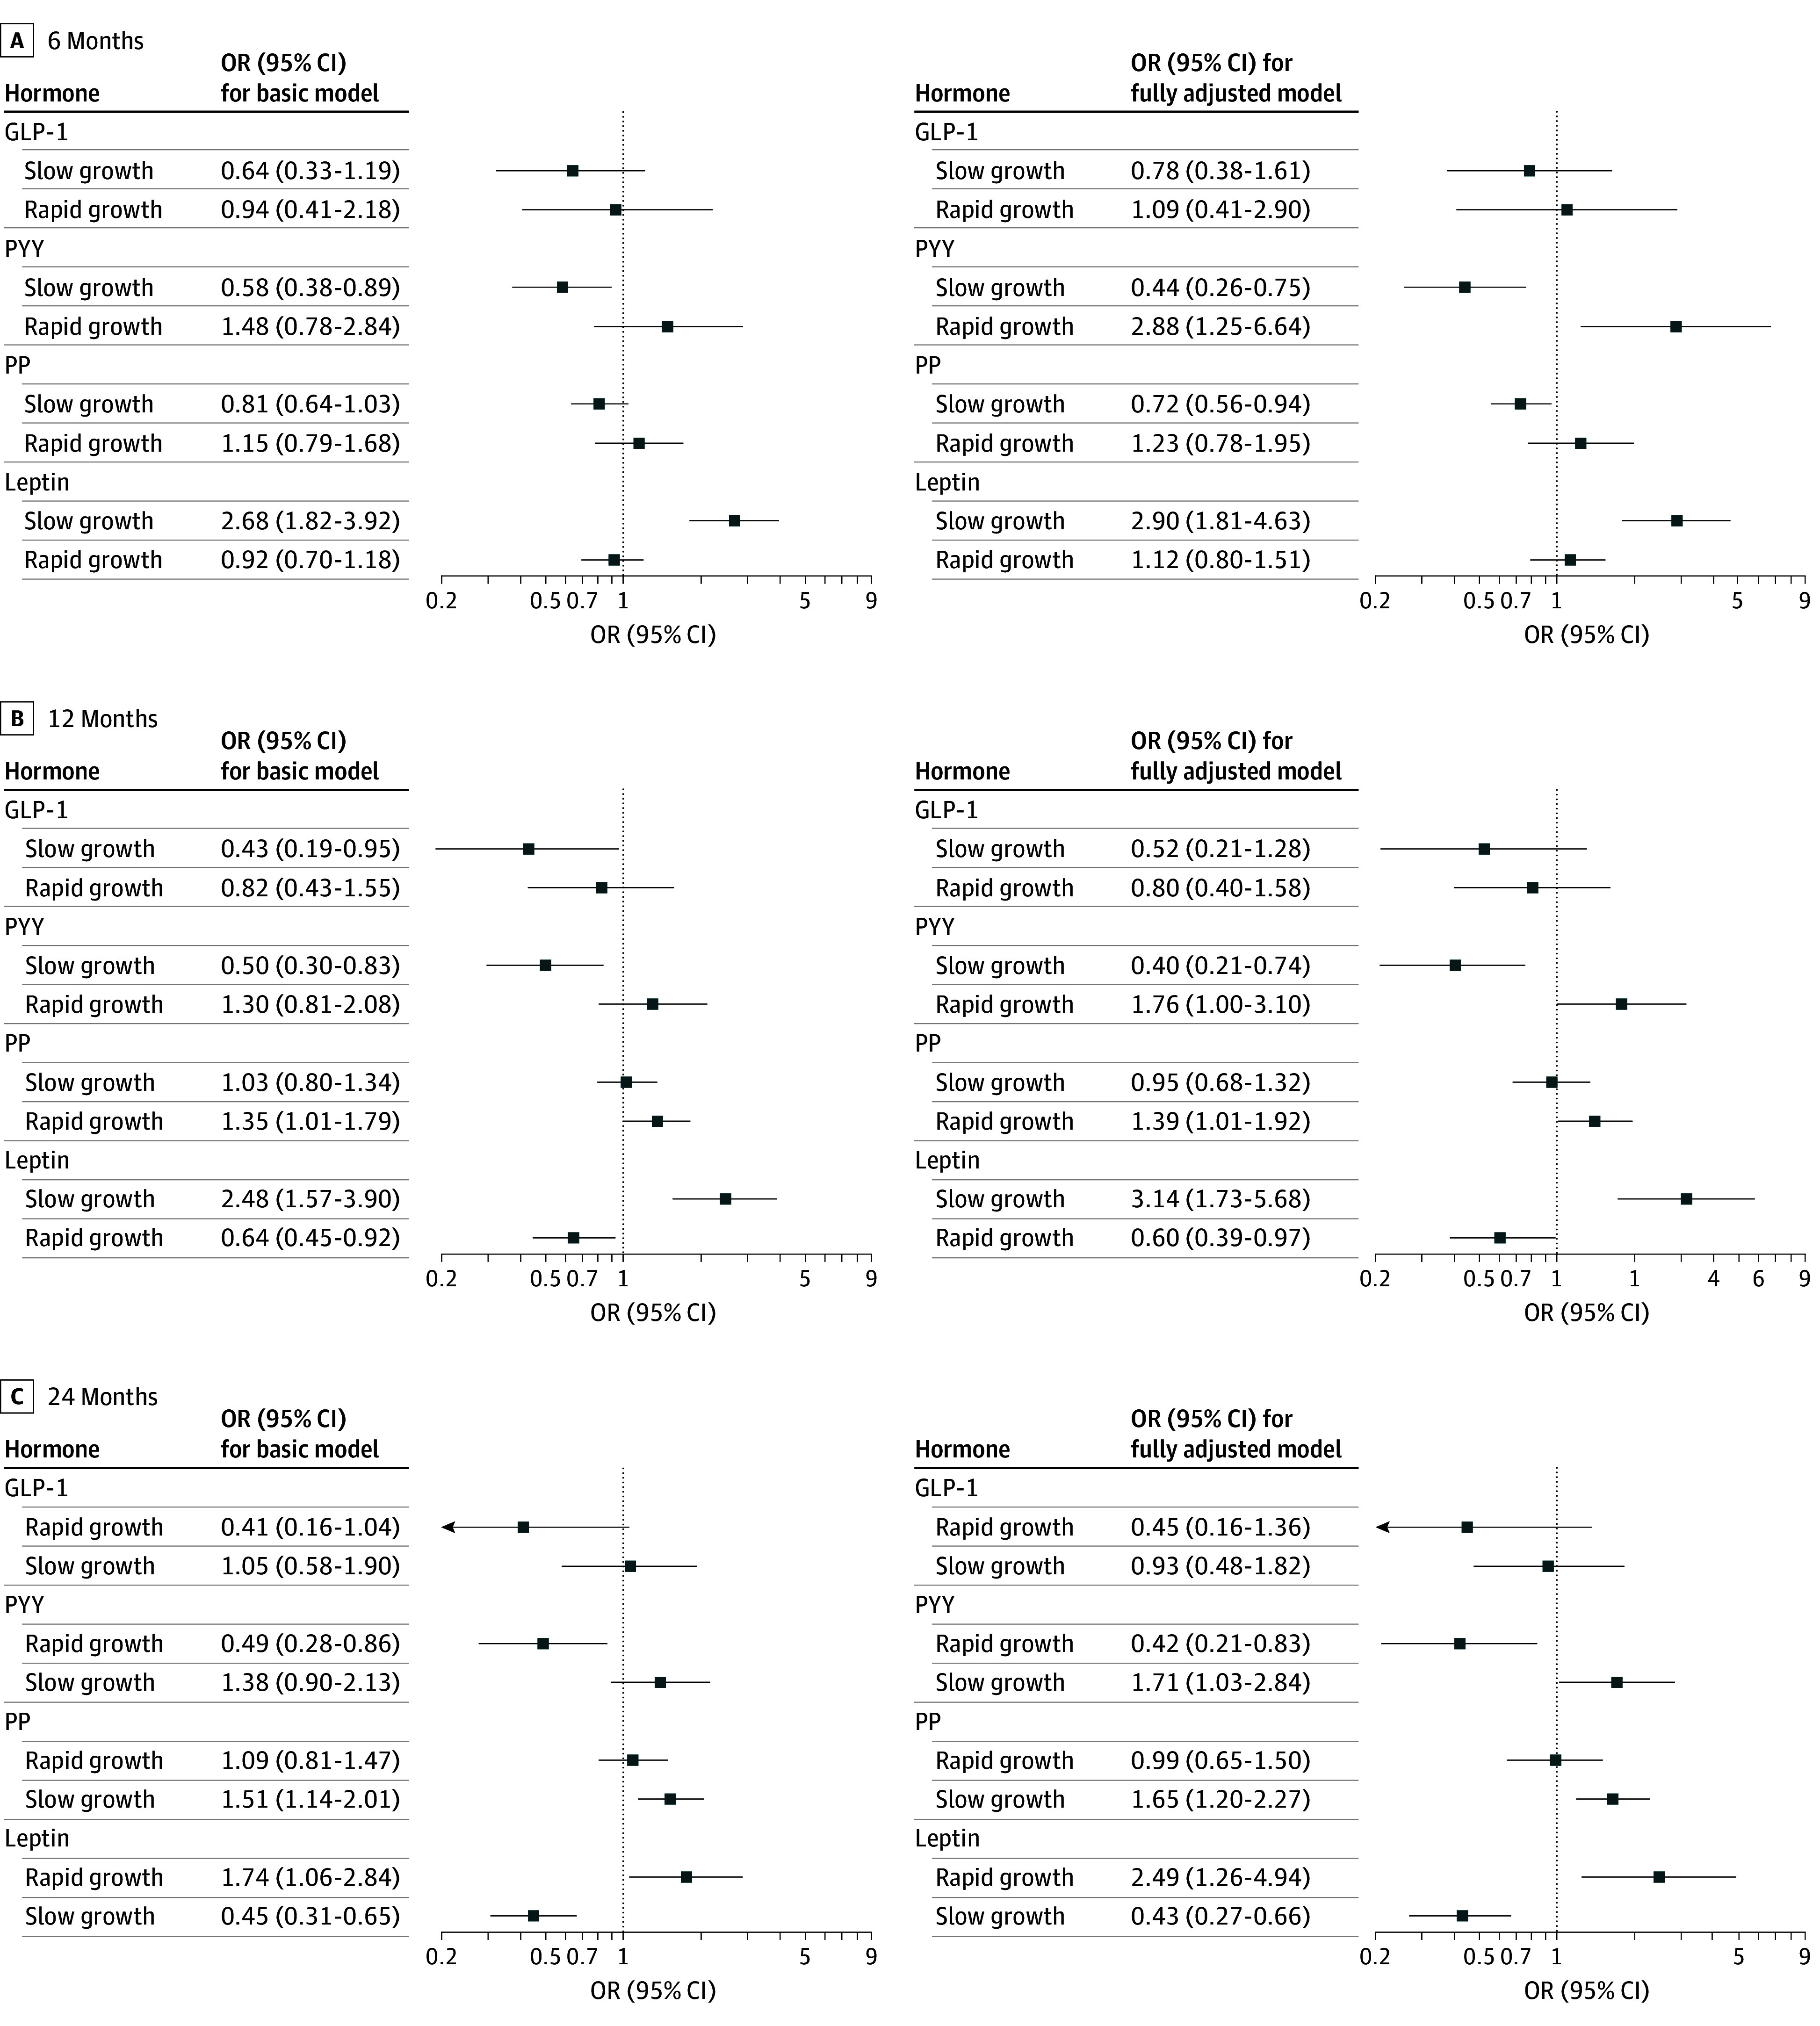 Figure 2
| Characteristic | Participants, No. (%) | ||
|---|---|---|---|
| PP and leptin (n = 226) | PYY and GLP-1 (n = 229) | ||
| Newborn | |||
| Sex | |||
| Male | 108 (47.8) | 98 (42.8) | .33 |
| Female | 118 (52.2) | 131 (57.2) | |
| Birth weight, median (IQR), g | 3360 (3030 to 3718) | 3395 (3090 to 3660) | .65 |
| Gestation duration, median (IQR), wk | 39 (38 to 40) | 39 (38 to 40) | .90 |
| Preterm | 15 (6.6) | 13 (5.7) | .81 |
| Maternal | |||
| Age at delivery, median (IQR), y | 30 (27 to 33) | 30.0 (27.0 to 32.0) | .44 |
| Gestational weight gain, median (IQR), kg | 13.0 (10.0 to 16.7) | 14.0 (11.0 to 17.5) | .30 |
| Prepregnancy BMI | 23.8 (21.4 to 26.4) | 23.9 (21.5 to 26.6) | |
| Prepregnancy weight | |||
| Underweight | 6 (2.7) | 7 (3.1) | .77 |
| Normal weight | 142 (62.8) | 141 (61.6) | |
| Overweight | 52 (23) | 54 (23.6) | |
| Obesity | 26 (11.5) | 27 (11.8) | |
| Parity | |||
| 1 | 125 (55.3) | 123 (53.7) | .82 |
| 2 | 80 (35.4) | 87 (38.0) | |
| ≥3 | 21 (9.3) | 19 (8.3) | |
| Education level | |||
| Low | 20 (8.8) | 14 (6.1) | .46 |
| Middle | 59 (26.1) | 67 (29.3) | |
| High | 147 (65.0) | 148 (64.6) | |
| Gestational diabetes | 11 (4.9) | 8 (3.5) | .62 |
| Preeclampsia | 2 (0.9) | 2 (0.9) | >.99 |
| Alcohol use during pregnancy | 48 (21.6) | 42 (18.3) | .45 |
| Smoking during pregnancy | 26 (11.5) | 27 (11.8) | >.99 |
| Breastfeeding | 150 (73.9) | 152 (74.9) | .91 |
| Cord blood appetite hormone levels | |||
| PYY, median (IQR), pmol/L | 118.56 (80.12 to 154.14) | 115.03 (81.28 to 152.71) | .91 |
| GLP-1, median (IQR), pmol/L | 34.62 (28.50 to 42.01) | 35.55 (27.99 to 42.68) | .88 |
| Leptin, median (IQR), pg/mL | 13 060.75 (7222.81 to 24 145.74) | 11 863.73 (5571.09 to 23 569.16) | .31 |
| PP, median (IQR), pg/mL | 24.09 (16.47 to 44.86) | 23.67 (17.01 to 36.41) | .84 |
| Child at follow-up visit | |||
| Age, median (IQR), y | 4.50 (4.28 to 4.74) | 4.50 (4.29 to 4.78) | .92 |
| Estimated BMI at 9 months, median (IQR) | 17.21 (16.46 to 18.14) | 17.16 (16.44 to 18.06) | .82 |
| Growth the first 6 months | |||
| Slow growth | 73 (32.3) | 70 (30.6) | .88 |
| Normal growth | 122 (54.0) | 129 (56.3) | |
| Rapid growth | 31 (13.7) | 30 (13.1) | |
| Growth the first year | |||
| Slow growth | 46 (20.4) | 41 (17.9) | .50 |
| Normal growth | 108 (47.8) | 122 (53.3) | |
| Rapid growth | 72 (31.9) | 66 (28.8) | |
| Growth the first 2 years | |||
| Slow growth | 37 (16.4) | 31 (13.5) | .65 |
| Normal growth | 86 (38.1) | 94 (41.0) | |
| Rapid growth | 103 (45.6) | 104 (45.4) | |
| BMI | 0.43 (−0.08 to 1.03) | 0.52 (−0.09 to 1.05) | .65 |
| Waist to height ratio, median (IQR) | 0.49 (0.47 to 0.51) | 0.49 (0.48 to 0.51) | .40 |
| Overweight | 33 (14.6) | 34 (14.8) | >.99 |
| Obesity | 6 (2.7) | 4 (1.7) | .73 |
| Hormone | Basic model | Fully adjusted model | ||
|---|---|---|---|---|
| β (95% CI) | β (95% CI) | |||
|
| ||||
| GLP-1 | −0.08 (−0.22 to 0.05) | .25 | −0.08 (−0.22 to 0.06) | .24 |
| PYY | 0.05 (−0.07 to 0.18) | .40 | 0.06 (−0.08 to 0.21) | .36 |
| PP | 0.16 (0.04 to 0.28) | .008 | 0.13 (−0.007 to 0.27) | .06 |
| Leptin | −0.0241 (−0.14 to 0.12) | .72 | 0.009 (−0.14 to 0.16) | .91 |
|
| ||||
| GLP-1 | −0.008 (−0.14 to 0.12) | .90 | −0.005 (−0.18 to 0.17) | .95 |
| PYY | 0.11 (−0.03 to 0.25) | .13 | 0.16 (0.04 to 0.30) | .01 |
| PP | 0.12 (−0.04 to 0.28) | .13 | 0.17 (−0.004 to 0.34) | .06 |
| Leptin | −0.05 (−0.19 to 0.08) | .43 | −0.004 (−0.18 to 0.18) | .96 |
| Hormone | Basic model | Fully adjusted model | ||
|---|---|---|---|---|
| β (95% CI) | β (95% CI) | |||
| GLP-1 | 0.02 (−0.15 to 0.11) | .79 | 0.01 (−0.12 to 0.14) | .87 |
| PYY | 0.06 (−0.07 to 0.19) | .40 | 0.14 (0.01 to 0.27) | .03 |
| PP | 0.07 (−0.08 to 0.22) | .38 | 0.10 (−0.05 to 0.25) | .18 |
| Leptin | 0.03 (−0.10 to 0.16) | .67 | −0.06 (−0.08 to 0.20) | .39 |
Peer Reviews
No public reviews on file for this paper yet. If you reviewed it on a platform where reviews are public (OpenReview, ICLR, NeurIPS, ICML), you can paste yours below so the community can read it here.
Videos
No videos yet. Explain this paper in a talk, walkthrough, or lecture? Add one.
Taxonomy
TopicsRegulation of Appetite and Obesity · Obesity, Physical Activity, Diet · Adipose Tissue and Metabolism
Introduction
Obesity represents a substantial global health burden, with its prevalence increasing from early childhood onward, contributing to an increased risk of noncommunicable diseases.^1^ Appetite-regulating hormones have emerged as potential molecular mechanisms underlying the development of obesity, given their critical roles in energy homeostasis and appetite control.^2^ Most appetite-regulating hormones function as satiety hormones, primarily released in the gastrointestinal tract in response to food intake to promote satiation. Their circulating levels fluctuate throughout the day in response to the body’s nutritional state, aligning energy intake with energy needs.^3^ In individuals with obesity, however, these dynamic patterns are frequently dysregulated, potentially contributing to a disrupted energy balance.^2,4,5,6^ In contrast to the episodic signals of gastrointestinal appetite hormones, leptin functions as a long-term, tonic signal of energy balance. Secreted by adipocytes, leptin reflects the body’s fat stores and provides a continuous indication of energy reserves, playing a critical role in regulating appetite and energy homeostasis.^7^
Appetite-regulating hormone levels are already detectable in cord blood of the neonate.^8,9,10,11^ Despite this, limited research has explored the functions and health implications of these hormones during early life. Notably, the circulating levels of most appetite hormones at birth and during the first postnatal weeks are much higher than those observed in adults.^8,9,10^ This finding might suggest a potential role in developmental processes, which may potentially have long-lasting effects.
Cord blood leptin levels have been associated with postnatal growth patterns and childhood body composition, with birth weight potentially acting as a mediator in this association.^12,13,14,15,16,17^ However, the findings are inconclusive.^12,13^ Similar associations for other appetite hormones remain unexplored.
Nevertheless, evidence suggests that the trajectory toward obesity is set in early life.^13,18^ The prenatal environment in particular has emerged as a key determinant of diseases in later life, potentially shaping the developmental trajectories of body composition and metabolic regulation.^19,20^ Research indicates that early growth patterns, specifically rapid infant growth and the magnitude of the adiposity peak, may be predictive of later obesity and noncommunicable diseases risk.^21,22^ These outcomes reflect critical developmental windows in body composition and metabolic regulation and are more proximal indicators of obesity in later life.
Therefore, the aim of this study was to explore the associations of a set of anorexigenic cord blood appetite hormone levels (glucagon-like peptide 1 [GLP-1], peptide tyrosine tyrosine [PYY], pancreatic polypeptide [PP], and leptin) with postnatal growth, body mass index (BMI; calculated as weight in kilograms divided by height in meters squared) growth trajectories, and childhood adiposity measures in the Environmental Influence on Early Aging (ENVIRONAGE) birth cohort. We hypothesize that higher cord blood concentrations of anorexigenic appetite-regulating hormones (GLP-1, PYY, PP, and leptin) are prospectively associated with slower postnatal growth, more favorable BMI trajectories, and lower adiposity in early childhood.
Methods
Study Design and Population
Participants were recruited from the ongoing ENVIRONAGE birth cohort,^23^ initiated in 2010 at East-Limburg Hospital in Genk, Belgium. The study enrolls mother-newborn pairs at delivery, excluding those with planned cesarean sections or an inability to complete questionnaires in Dutch. After 4 to 6 years, follow-up visits are conducted at the university’s examination center. The study complies with the Declaration of Helsinki^24^ and was approved by the Ethical Committees of Hasselt University and East-Limburg Hospital. Written informed consent was obtained. This study followed the Strengthening the Reporting of Observational Studies in Epidemiology (STROBE) reporting guideline for cohort studies .
This study included 325 participants (recruited from 2010 to 2016) for whom cord blood appetite hormone levels were available and participated in the follow-up visit. Based on the availability of hormone measurements, the study population can be divided into 2 subgroups: 229 children having GLP-1 and PYY measurements and 226 children having PP and leptin measurements in cord blood. A total of 130 children had all 4 hormones measured. A detailed flow diagram is presented in Figure 1. The analyzed ENVIRONAGE population is demographically similar to the nonanalyzed participants of the cohort, with slight differences in maternal education and reported alcohol use during pregnancy (eTable 1 in Supplement 1).
Flowchart of the ENVIRONAGE Study Participants GLP-1 indicates glucagon-like peptide 1; PP, pancreatic polypeptide; PYY, peptide tyrosine tyrosine.
Clinical Measures, Anthropometrics, and Sample Collection
After delivery, the mothers completed questionnaires, providing detailed lifestyle and sociodemographic information about the mother (eg, maternal age, race, educational level, and smoking and alcohol use during pregnancy). Race categories included Eastern European, Morocco, Southern European, Turkish, Western European, and other (any other race). Further information on the delivery and health status of the mother and newborn was derived from medical records of the hospital (eg, newborn sex, mode of delivery, and gestational age) More information is available in eMethods 1 in Supplement 1.
Appetite Hormone Analysis
Appetite hormone levels were measured in cord blood plasma. PYY and GLP-1 levels were measured using previously described radioimmunoassays.^25,26^ Leptin and PP levels were measured using a magnetic bead panel (EMD Millipore MILLIPLEX Human Metabolic Hormone Magnetic Bead Panel HMH3-34K, Millipore Merck). More information is provided in eMethods 2 in Supplement 1.
Postnatal Growth and Adiposity Measurements
Given the limited prior research on cord blood appetite-regulating hormones other than leptin, no single outcome was designated as primary. Instead, an exploratory approach was adopted examining several early-life growth and adiposity measures that are established risk factors for later obesity risk. Results should therefore be interpreted as hypothesis-generating. To monitor the children’s postnatal growth between birth and 29 months of age, mothers provided copies of the medical records from Kind en Gezin (Child and Family), the Flemish agency responsible for the health, childcare, and well-being of children up to school age. Using these data, growth patterns were characterized with 3 indicators: rapid growth, adiposity peak, and BMI growth trajectories.
Rapid growth was defined as a World Health Organization z score increase of more than 0.67 in weight for age between 2 time points, following the work of Ong et al.^27^ Conversely, slow growth was defined as a World Health Organization z score decrease of more than 0.67.^27^ Growth rates were calculated for 3 periods, birth to 6 months, birth to 12 months, and birth to 24 months, to assess time-based differences in associations. A 2-step prediction approach was used to estimate sex- and age-specific weight at 6, 12, and 24 months of follow-up, using fractional polynomials of age by gender in the ENVIRONAGE cohort, as previously described.^28^
The adiposity peak is the peak observed in a child’s BMI growth curve. Based on the predicted BMI trajectories in our cohort, using the aforementioned 2-step prediction model, the adiposity peak in the ENVIRONAGE cohort was estimated to occur at 13 months (eFigure 1 in the Supplement). Therefore, the predicted BMI at 13 months was used as a proxy for the adiposity peak, which serves as an early-life predictor for obesity later in life.^28,29,30^ BMI growth trajectories from birth up to 29 months were modeled using natural cubic splines (eMethods 3 in Supplement 1). Childhood adiposity was measured at the follow-up visit around the age of 4 years using anthropometric measures: BMI (z score) and waist to height ratio (eMethods 4 in Supplement 1).
Statistical Analysis
Statistical analyses were conducted with R software, version 4.3.1 (R Project for Statistical Computing). Appetite hormone values were natural log–transformed to improve normality. Correlations between the appetite hormones were evaluated using Spearman rank correlations. Continuous data were compared with the Wilcoxon test and proportions with the χ^2^ test. A 2-sided P < .05 was considered statistically significant. Unless stated otherwise, all statistical analyses were performed using 2 models adjusted for a priori chosen variables. The basic model was adjusted for sex.^31,32^ The fully adjusted model further included potential confounders, including maternal age at delivery,^16^ maternal education level as a proxy for socioeconomic status,^33^ prepregnancy BMI,^34^ gestational weight gain,^35^ maternal smoking and alcohol use during pregnancy,^36,37^ and parity^38^; and additional covariates to increase model precision: mode of delivery,^39^ gestational age at delivery,^40,41^ and breastfeeding.^42,43^ Missing variables (breastfeeding, n = 34; alcohol consumption during pregnancy, n = 4; and maternal weight gain during pregnancy, n = 5) were imputed via multiple imputation, using the mice package with 13 imputations.
The associations of cord blood appetite hormone levels with adiposity peak and anthropometric measurements at the follow-up visit (waist to height ratio and BMI z score) were assessed using robust linear regression models (robust R package) to account for influential points identified using Cook’s distance.^44^ The models for BMI z score and waist to height ratio at the follow-up visit were additionally adjusted for age at follow-up visit (in months) and the quadratic term of age to allow for nonlinearity. Associations between cord blood appetite hormone levels and postnatal growth were assessed based on a categorical growth outcome (rapid, normal, and slow growth), using multinomial logistic regression models (with normal growth as the reference category).
Several sensitivity analyses were performed. First, birth weight was not included in the primary models because it could act as potential mediator, but age- and sex-standardized birth weight z scores were included in sensitivity analyses for all outcomes because they could also theoretically act as a confounder.^45^ Second, to examine the potential associations of gestational diabetes^46^ and preeclampsia^47,48,49^ with the results, we excluded samples of neonates born to mothers with gestational diabetes or preeclampsia. Third, interaction terms between hormone levels and sex were included in the fully adjusted models to investigate whether associations differed by sex. Associations between cord blood appetite hormone levels and BMI growth trajectories were analyzed using linear mixed-effects models (eMethods 3 in Supplement 1).
Results
Descriptive Statistics
A total of 325 children (median [IQR] age, 4.49 [4.04-4.95] years; 151 [46.5%] male and 174 [53.5%] female; 3 [0.9%] Eastern European, 3 [0.9%] Morocco, 9 [2.8%] Southern European, 13 [4.0%] Turkish, 294 [90.7%] Western European, 2 [0.6%] other) were studied. The characteristics of the participants included in this study stratified per group of available appetite hormones (n = 226 for leptin and PP and n = 229 for GLP-1 and PYY)^24^ are given in Table 1. There were no significant differences in characteristics between both subpopulations. Spearman rank correlations among the concentrations of the 4 cord blood hormones are shown in eFigure 2 in Supplement 1. Moderate correlations were found between PYY and GLP-1 (r = 0.42; P < .001), and PYY and PP (r = 0.24; P = .007). Unadjusted regression results of associations among study outcomes, included confounders, and cord blood appetite hormones are shown in eTable 2 in Supplement 1.
Adiposity at 4 to 6 Years of Age
Table 2 shows the associations between the cord blood appetite hormone levels and adiposity measurements obtained at the follow-up visit. In the basic models, PP levels were positively associated with waist-to-height ratio (β = 0.16; 95% CI, 0.03-0.28; P = .008). In the fully adjusted models, a positive association was observed for PYY and BMI z score (β = 0.16; 95% CI, 0.04-0.27; P = .01). Excluding children born to mothers with gestational diabetes or preeclampsia revealed a positive association for PP and BMI z score in the fully adjusted models, which was also observed when correcting for birth weight (eTables 3 and 4 in Supplement 1). Interaction terms between sex and hormone levels were not significant.
Adiposity Peak
Cord blood PYY levels were positively associated with the adiposity peak, although only in the fully adjusted model (β = 0.14; 95% CI, 0.01-0.27; P = .03) (Table 3). This association remained similar when adjusting for birth weight or exclusion of children born to mothers with preeclampsia or gestational diabetes (eTables 5 and 6 in Supplement 1). Interaction terms between sex and hormone levels were not significant in any of the models.
Postnatal Growth
Figure 2 and eTable 7 in Supplement 1 detail the associations between the cord blood hormones and postnatal growth. In general, PYY and PP levels were positively associated with rapid growth and negatively with slow growth, whereas leptin levels showed opposite associations. The basic and fully adjusted models provided similar results, except for the association between rapid growth and PYY for which the basic models were not significant. When considering the shortest time frame (birth to 6 months), only slow growth seems to be significantly associated with cord blood hormone levels, whereas in longer time frames rapid growth is associated as well, although in the opposite direction from the cord blood hormone levels. Comparable results were obtained after excluding participants with gestational diabetes or preeclampsia (eTable 8 in Supplement 1). When models were additionally adjusted for birth weight, GLP-1 was also positively associated with slow growth and negatively with rapid growth in all 3 time frames (eTable 9 in Supplement 1). Most of the associations with rapid growth were moderated by sex; sex-specific odds ratios are shown in eTable 10 in Supplement 1. Although the associations pointed in the same direction for both sexes, variations in effect size were observed.
Associations Between Cord Blood Appetite Hormones and Rapid Growth Between Birth and 6 Months, 12 Months, and 24 Months Using Multinomial Regression ModelsRelative odds ratios (ORs; normal growth as the reference category) are represented for a doubling in cord blood hormone level. Basic models were adjusted for sex. Fully adjusted models were further adjusted for maternal age at delivery, maternal educational level, prepregnancy body mass index, gestational weight gain, maternal smoking during pregnancy, alcohol use during pregnancy, parity, gestational age at delivery, delivery method, and breastfeeding. GLP-1indicates glucagon-like-peptide-1; PP, pancreatic polypeptide; PYY, peptide tyrosine tyrosine.
In the spline-based mixed models, cord blood leptin was positively associated with mean BMI across childhood (β = 0.65; P < .001) and showed significant age interactions, indicating differences in BMI trajectory shape (eTable 11 in Supplement 1). Although PYY and PP showed no significant main associations, PYY and PP displayed age-dependent interactions (eTable 11 in Supplement 1). Predicted BMI trajectories in function of hormone levels are displayed in eFigure 3 in Supplement 1.
Discussion
This study examined the associations of cord blood appetite hormones levels with childhood adiposity and early-life growth, both of which are known to be associated with obesity in later life. To our knowledge, this is the first study to report positive associations of cord blood PYY and PP with adiposity and rapid growth: PYY was positively associated with rapid growth, BMI z scores at 4 to 6 years of age, and the adiposity peak, whereas PP was associated with rapid growth and both BMI z scores and waist-to-height ratio at 4 to 6 years of age. Consistent with previous literature,^12,13,15,16^ we observed associations of cord blood leptin with childhood BMI trajectory and rapid growth.
Biological and Public Health Relevance
Our findings can be contextualized within the Developmental Origins of Health and Disease hypothesis, which posits that the environment during early life, and in particular during fetal development, can have lasting impacts on health outcomes in later life.^20^ The associations observed between cord blood appetite hormones and early growth and adiposity measures suggest that hormonal environments in utero may predispose individuals to certain growth patterns, ultimately influencing their risk for obesity and related conditions in adulthood.
The findings of this study might have substantial public health implications, particularly in the context of childhood obesity and its long-term health effects. The observed results suggest that cord blood appetite hormones (PP, PYY, and leptin) might play a role in the early-life development of obesity. The positive associations of cord blood PYY and PP with BMI z scores at 4 to 6 years of age, when a doubling in PYY and PP levels corresponds to a 0.21 and 0.13 SD increase, respectively, are clinically relevant because previous research^50^ shows that even a 0.20 reduction in BMI z scores can lower cardiovascular risk factors in children. Moreover, a doubling of cord blood leptin levels was associated with a reduced likelihood of rapid growth in the first year of life, comparable to the beneficial effect of mixed breastfeeding vs formula feeding on rapid growth in the same period.^51^ These associations, although modest, indicate that even small changes in hormone levels during critical developmental windows could have substantial long-term health consequences.
Leptin
Although negative associations between cord blood leptin levels and childhood body composition have been reported,^12,13,16,17,52^ this was not confirmed in this study. This discrepancy might arise from differences in sample size, methods, and age of the population. Previous studies suggest age-related shifts in the association between cord blood leptin and adiposity: strongly positive at birth,^53^ reversing to weaker negative associations by 3 years of age,^17,52^ and diminishing thereafter,^12,13,17^ which is in line with the current findings (4 to 6 years of age). Nevertheless, in this study, we observed significant associations with rapid growth, consistent with previous literature.^15,54^ Although previous studies^15,16,54^ limited rapid growth measures to the first months of life and performed unadjusted correlations, this study shows associations with rapid growth in larger time frames, up to 2 years adjusting for multiple potential confounders, highlighting the robustness of these results.
The underlying mechanisms of these associations remain unclear. However, it has been speculated that the leptin surge at the end of the third trimester in humans might play a role in the development of neuronal circuits of appetite regulation.^12^ Rodent studies^55,56,57^ suggest that an early-life surge in leptin levels is crucial for the development of neural circuits in the hypothalamus, particularly the arcuate nucleus, which regulates energy balance and appetite. Although it is challenging to directly extrapolate these findings to humans due to different timing of neuronal development^58^ (occurring in the last trimester of pregnancy in humans vs the first weeks post partum in rodents^55,59^), it is notable that human leptin levels also increase during the last trimester, analogous to the postnatal leptin surge in rodents.^58,60^ If similar leptin-induced hypothalamic innervation occurs in humans, it could be speculated that elevated cord blood leptin levels are needed for the adequate development of hypothalamic neural circuits involved in energy regulation, potentially predisposing individuals with lower cord blood levels to altered metabolic programming and a higher obesity risk later in life. This theory aligns with observed negative associations between cord blood leptin levels and rapid growth. However, further research in humans is needed to verify this hypothesis.
PYY, PP, and GLP-1
Besides leptin, this study also investigated cord blood PYY, PP, and GLP-1. Although both cord blood PYY and PP were positively associated with BMI z scores, only PP showed a significant association with waist to height ratio. Interestingly, in contrast to leptin, both PP and PYY levels were positively associated with rapid growth and inversely related to slow growth, despite all 3 hormones promoting satiety in adults. Exploring the precise biological mechanisms behind these associations might elucidate this unexpected finding.
The interpretation of these findings is challenging due to the limited research available on these hormones in cord blood. Previous work^10^ has suggested that high PYY levels in early postnatal life may play a role in the adaptation to enteral feeding by slowing gastric emptying and increasing small bowel transit time. This mechanism could extend the time for nutrient absorption,^10^ potentially contributing to faster growth. Unlike cord blood PYY levels, which are relatively high, cord blood PP levels are generally low compared with adult levels, although they also experience a postnatal surge in the days after birth.^9^ Unlike PYY, this postnatal increase seems not to be due to the switch to enteral feeding because PP levels also increased in preterm neonates who did not receive enteral feeds.^9^ Further research on early-life gut hormone levels is essential to uncover the molecular mechanisms underlying these observed associations.
Strengths and Limitations
This study has several strengths. The study explored associations between a set of cord blood appetite-regulating hormones and postnatal child growth and childhood adiposity measures. The study combined multiple anthropometric measurements, including rapid growth measurements assessed over different time frames. The robustness of the findings is reinforced by their persistence after adjusting for various potential confounders and covariates.
Some study limitations should also be acknowledged. First, maternal characteristics (eg, appetite hormone levels and diet during pregnancy) and paternal BMI were not available; these factors could act as residual confounders in the observed associations. In contrast, other missing early-life factors, such as breastfeeding duration and early feeding practices, could act as effect modifiers, potentially influencing the strength or direction of associations. A second limitation of this study is the exclusion of elective cesarean sections at baseline, which may potentially have introduced collider bias. Third, our population’s low prevalence of overweight and obesity may have underestimated the strength of associations. Fourth, the study population varied slightly per hormone because not all hormones could be measured in the cord blood of all participants. Fifth, although our follow-up sample is generally representative of the ENVIRONAGE cohort, mothers with higher education levels are slightly overrepresented. Because maternal education influences child growth through socioeconomic and environmental factors, this may lead to somewhat more favorable growth trajectories in our sample, limiting generalizability to more diverse populations.
Conclusions
In this prospective cohort study of 325 children, cord blood levels of PYY, PP, and leptin were associated with early-life growth trajectories and childhood anthropometric measurements. These results suggest that cord blood appetite hormone levels might play a role in the early-life development of overweight and obesity.
The reference list from the paper itself. Each links out to its DOI / PubMed record.
- 1World Health Organization. Obesity and overweight. March 1, 2024. Accessed December 24, 2024. https://www.who.int/news-room/fact-sheets/detail/obesity-and-overweight
- 2Montégut L, Lopez-Otin C, Magnan C, Kroemer G. Old paradoxes and new opportunities for appetite control in obesity. Trends Endocrinol Metab. 2021;32(5):264-294. doi:10.1016/j.tem.2021.02.00533707095 · doi ↗ · pubmed ↗
- 3Segers A, Depoortere I. Circadian clocks in the digestive system. Nat Rev Gastroenterol Hepatol. 2021;18(4):239-251. doi:10.1038/s 41575-020-00401-533531700 · doi ↗ · pubmed ↗
- 4Yildiz BO, Suchard MA, Wong ML, Mccann SM, Licinio J. Alterations in the dynamics of circulating ghrelin, adiponectin, and leptin in human obesity. Proc Natl Acad Sci U S A. 2004;101(28):10434-104349. doi:10.1073/pnas.040346510115231997 PMC 478601 · doi ↗ · pubmed ↗
- 5Galindo Muñoz JS, Jiménez Rodríguez D, Hernández Morante JJ. Diurnal rhythms of plasma GLP-1 levels in normal and overweight/obese subjects: lack of effect of weight loss. J Physiol Biochem. 2015;71(1):17-28. doi:10.1007/s 13105-014-0375-725543251 · doi ↗ · pubmed ↗
- 6Saad MF, Riad-Gabriel MG, Khan A, . Diurnal and ultradian rhythmicity of plasma leptin: effects of gender and adiposity. J Clin Endocrinol Metab. 1998;83(2):453-459. doi:10.1210/jcem.83.2.45329467557 · doi ↗ · pubmed ↗
- 7Ahima RS, Flier JS. Leptin. Annu Rev Physiol. 2000;62:413-437. doi:10.1146/annurev.physiol.62.1.41310845097 · doi ↗ · pubmed ↗
- 8Padidela R, Patterson M, Sharief N, Ghatei M, Hussain K. Elevated basal and post-feed glucagon-like peptide 1 (GLP-1) concentrations in the neonatal period. Eur J Endocrinol. 2009;160(1):53-58. doi:10.1530/EJE-08-080718952761 · doi ↗ · pubmed ↗