Kinetic Investigation of Tobermorite Synthesis for the Recovery of Carcinogenic Respirable Crystalline Silica (RCS)
Daniele Malferrari, Giulio Galamini, Maddalena Bernini, Riccardo Fantini, Giulia Malvolti, Alessandro F. Gualtieri

TL;DR
This study explores converting harmful respirable crystalline silica into tobermorite using mild conditions, offering a detoxification and waste valorization solution with potential CO2 sequestration benefits.
Contribution
A novel low-energy method for converting RCS into tobermorite is developed, demonstrating detoxification and CO2 sequestration potential under mild hydrothermal conditions.
Findings
Quartz dissolution is the primary silica source for tobermorite crystallization, following first-order kinetics.
Using CaO as a calcium source favors direct quartz-to-tobermorite conversion with higher yields at 140 °C.
The process effectively consumes respirable silica fractions and forms carbonate phases, suggesting CO2 sequestration potential.
Abstract
Respirable crystalline silica (RCS), a hazardous byproduct of quartzite processing, poses severe occupational and environmental health risks. To address both waste valorization and health concerns, this study developed an end-of-waste strategy for converting quartz-rich quarry dust (QD) into substituted tobermorite under mild hydrothermal conditions. A systematic series of syntheses was carried out at 120, 130, and 140 °C under dynamic conditions using controlled mixtures composed of QD together with KRY·AS (a material derived from the thermal inertization of cement asbestos) or CaO as calcium sources and a small amount (2.5 wt %) of phillipsite-rich zeolitic tuff as a catalytic additive. Crystallization pathways and reaction kinetics were analyzed through X-ray diffraction, scanning electron microscopy, and thermogravimetric/thermodifferential methods. Results showed that quartz…
Genes, proteins, chemicals, diseases, species, mutations and cell lines named across the full text — each resolved to its canonical identifier and authoritative record.
Click any figure to enlarge with its caption.
 1
1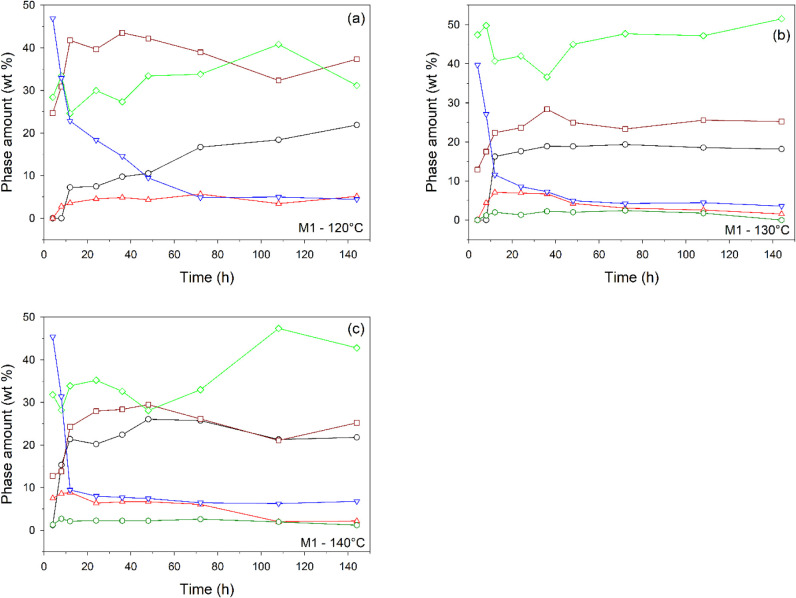 2
2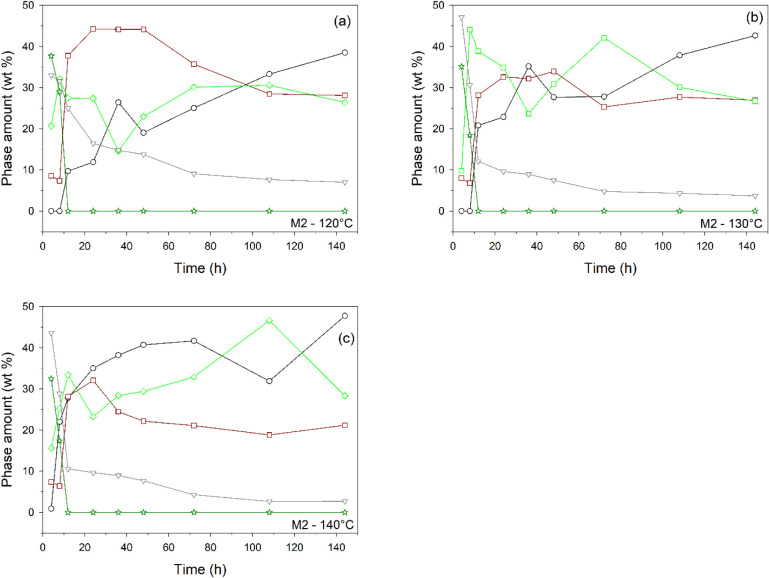 3
3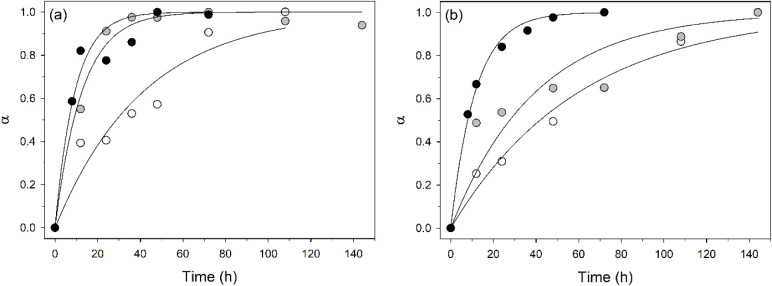 4
4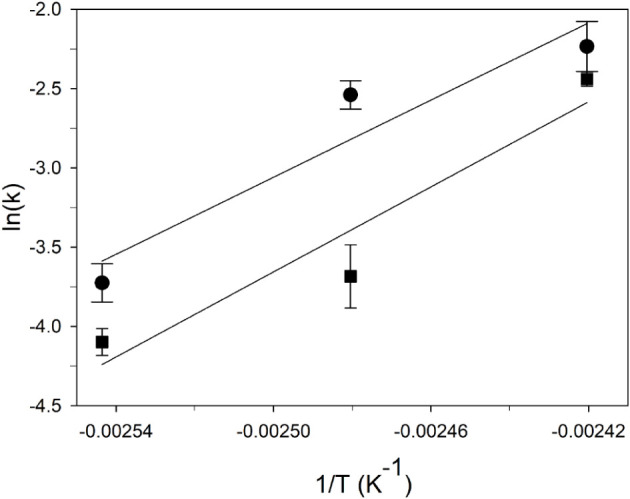 5
5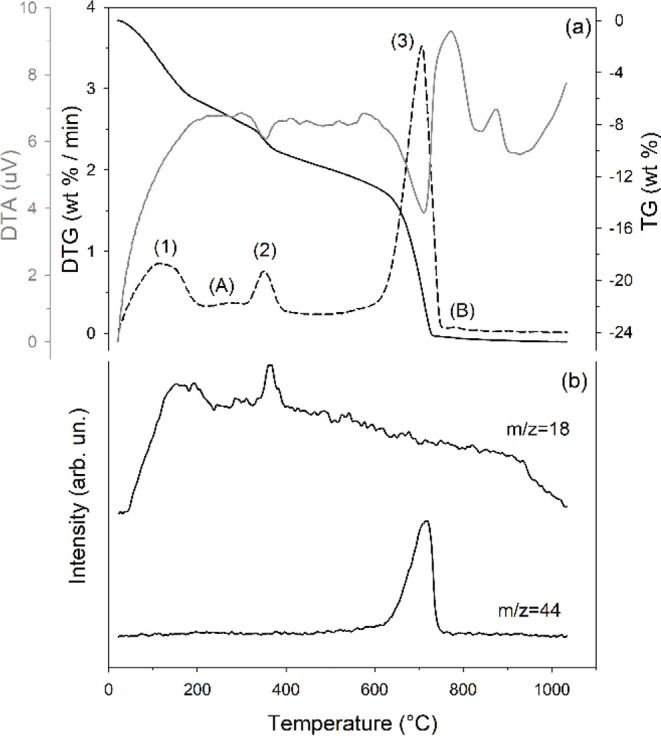 6
6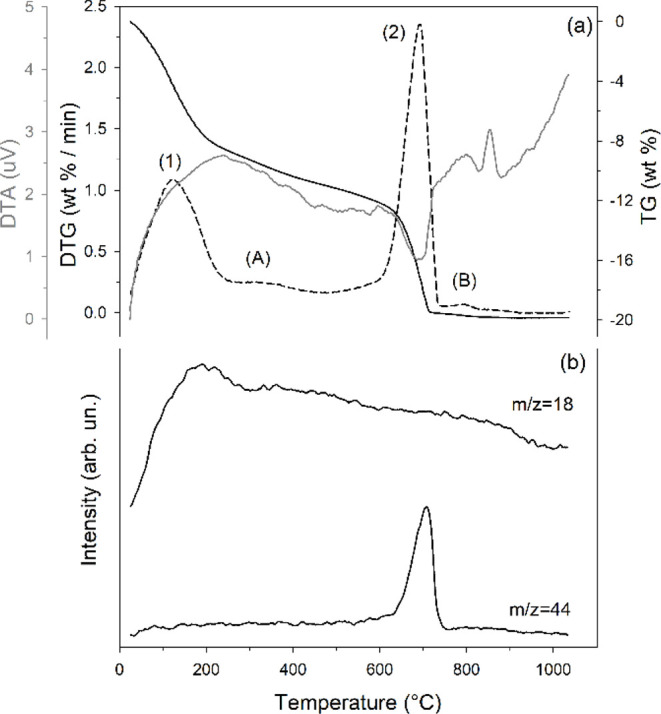 7
7| QD | KRY·AS | ZT | M1 | M2 | QD | KRY·AS | ZT | M1 | M2 | ||
|---|---|---|---|---|---|---|---|---|---|---|---|
|
| 1.4075 | 0.4139 | 0.8778 | 0.6490 | 0.8031 | Analcime | - | - | 3.4(2) | 0.1 | 0.1 |
|
| 0.1748 | 0.0798 | 0.3238 | 0.1073 | 0.1051 | Augite | - | - | 3.9(4) | 0.1 | 0.1 |
|
| 0.0088 | 0.0341 | 0.0482 | 0.0288 | 0.0061 | Brownmillerite | - | 6.4(1) | - | 4.8 | - |
|
| 0.0015 | 0.0026 | 0.0054 | 0.0024 | 0.0010 | Calcite | trace | 5.8(1) | - | 4.4 | - |
|
| 0.0020 | 0.0000 | 0.0008 | 0.0005 | 0.0011 | Chabazite | - | - | 21.1(4) | 0.5 | 0.5 |
|
| 0.0002 | 0.0010 | 0.0021 | 0.0008 | 0.0001 | Larnite | - | 44.6(5) | - | 33.5 | - |
|
| 0.0107 | 0.2363 | 0.0270 | 0.1803 | 0.0066 | Microcline | 3.3(1) | - | - | 0.7 | 1.8 |
|
| 0.0020 | 0.8622 | 0.0794 | 0.6491 | 0.7519 | Muscovite | 18.2(3) | - | 3.3(3) | 4.2 | 10.2 |
|
| 0.0023 | 0.0083 | 0.0323 | 0.0075 | 0.0021 | Periclase | - | 6.4(1) | - | 4.8 | - |
|
| 0.0625 | 0.0062 | 0.1232 | 0.0218 | 0.0377 | Phillipsite | - | - | 32.4(6) | 0.8 | 0.8 |
|
| 1.99 | 9.65 | 13.94 | 7.88 | 1.45 | Plagioclase | - | - | 9.7(5) | 0.2 | 0.2 |
| Quartz | 78.3(9) | - | - | 17.6 | 43.5 | ||||||
|
| 0.8268 | 0.8224 | Sanidine | - | - | 13.1(6) | 0.3 | 0.3 | |||
|
| 0.1732 | 0.1216 | Vaterite | - | 2.4(2) | - | 1.8 | - | |||
| Amorphous | 0.2(1) | 34.5(6) | 13.1(9) | 26.2 | 0.4 | ||||||
| CaO (addition) | - | - | - | - | 42.0 | ||||||
| χ2 | 12.77 | 1.827 | 6.016 | - | - | ||||||
|
| 0.0889 | 0.0787 | 0.0605 | - | - | ||||||
|
| 0.1195 | 0.0602 | 0.0716 | - | - | ||||||
| Sample | Isothermal run 120 (°C) | Isothermal run 130 (°C) | Isothermal run 140 (°C) |
|---|---|---|---|
|
| |||
|
| 0.024(3) | 0.079(7) | 0.11(2) |
|
| 0.928 | 0.984 | 0.937 |
|
| |||
|
| |||
|
| |||
|
| 0.017(1) | 0.025(5) | 0.087(4) |
|
| 0.973 | 0.843 | 0.995 |
|
| |||
|
| |||
- —NextGenerationEU10.13039/100031478
- —NextGenerationEU10.13039/100031478
- —NextGenerationEU10.13039/100031478
Peer Reviews
No public reviews on file for this paper yet. If you reviewed it on a platform where reviews are public (OpenReview, ICLR, NeurIPS, ICML), you can paste yours below so the community can read it here.
Videos
No videos yet. Explain this paper in a talk, walkthrough, or lecture? Add one.
Taxonomy
TopicsRecycling and utilization of industrial and municipal waste in materials production · Chemical Synthesis and Characterization · Zeolite Catalysis and Synthesis
Introduction
1
Crystalline silica (SiO_2_), most commonly occurring as quartz, is a widespread mineral present in various rocks, as well as in byproducts of materials processing and/or disposal. Humans are routinely exposed to silica nanoparticles from a variety of backgrounds, both environmental and occupational. While silica is not chemically hazardous, chronic inhalation of fine crystalline silica particles can pose significant health risks, including increased incidence risk of chronic obstructive pulmonary disease, tuberculosis, cancer, and pulmonary fibrosis, clinically referred to as silicosis. ?−? ? ? The primary hazard is associated with the generation of respirable crystalline silica (RCS), defined as crystalline silica particles with an aerodynamic diameter smaller than 10 μm.? These fine dust particles are typically produced during activities involving the mechanical breakdown of crystalline silica-containing materials (e.g., concrete, stone, sand) through processes such as cutting, grinding, drilling, or crushing. The risk is significant when airborne RCS concentrations exceed the threshold of 0.1 mg/m. ?,?−? ? ? ? ?
To circumscribe the damages from RCS, regulatory agencies and occupational health bodies instituted measures such as personal protective equipment requirements and exposure limits. ?−? ? Nevertheless, there is an additional issue that must necessarily be addressed: the disposal of large quantities of waste containing RCS, as landfill storage is an option that is no longer sustainable. Therefore, one of the main challenges facing scientific research is the development of technologies and production processes, named end-of-waste, ?,? that involve the use, and thus recovery, of waste or byproducts, thereby transforming them into resources.
While various silica-containing waste streams, including spent solar panels,? fly and bottom ash, ?−? ? construction scrap,? and lake and river sediments, ?−? ? ? ? ? ? have been explored for reuse, their potential RCS content and, crucially, its postreuse residue were often overlooked. Moreover, byproducts from natural stone processing (e.g., grinding, cutting, or drilling residues), which likely contain the highest RCS concentrations, have largely been disregarded. This oversight is probably due to the heterogeneous distribution of these materials (often processed at quarry sites) and a significant lack of knowledge regarding their mineralogical composition and associated hazards. ?,?−? ? ? ? Some of these materials, as in the case presented, are largely composed of quartz with particle sizes under 10 μm, warranting their classification as hazardous waste. Despite this, they show potential for synthesizing nanoporous materials, with tobermorite ranking as a strong candidate due to its favorable properties, such as medium to high surface area,? high adsorption and cation exchange capacity, ?,?−? ? ? ? ? ? ? ? and low synthesis energy requirements. ?,?,?
Tobermorite is a member of a group of calcium silicate hydrate minerals that closely resemble 2:1 swelling layer silicates. Within the tobermorite group, each member belongs to a family of polytypic compounds, which can be described using order/disorder theory. ?,? Although a new nomenclature has recently been introduced that proposes a tobermorite supergroup, ?,? most of the existing literature mainly focuses on three main polytypes, namely plombierite, tobermorite, and riversideite. These polytypes, also known as 14 Å-, 11 Å-, and 9 Å-tobermorite, respectively, are defined by their interlayer spacing (about 14.0, 11.3, and 9.30 Å), which is mainly influenced by the water content.? Simplifying, without considering polytypism and disorder, the structure of tobermorite consists of a series of Ca–Si layers stacked along the c-axis. The layers consist of a central sheet of CaO-like polyhedra paired with wollastonite-like tetrahedral chains running along the b-axis. Water, solvating, and exchangeable cationsmostly Ca^2+^ in natural samplesare intercalated between the Ca–Si units in an amount depending on the Al^3+^ and/or Fe^3+^ for Si^4+^ substitutions in the so-called Al-substituted tobermorites (see below).
Tobermorite is rare in nature, but, as mentioned above, it can be easily synthesized under mild hydrothermal conditions. In particular, Al-substituted tobermorites, an 11 Å polytype also known as substituted tobermorite, can be synthesized from materials containing silicon, calcium, iron, and aluminum.? Iron and aluminum act as possible isomorphic and heterovalent substituents for silicon, ?,?,?−? ? resulting in a charge deficit that enhances the mineral’s reactivity (adsorption and cation exchange capacity). These materials mostly include fly and bottom ash, ?,?,?−? ? ? ? ? paper recycling residues, ?,?,?,? glass, ?,?,? ash, and residue from organic material combustion. ?,?,? Nevertheless, other paths were explored using cement bypass dust,? blast furnace slags, ?,? and mixtures of various materials. ?,?,? Mixing different materials turns out to be an advantageous strategy because it allows for optimizing the chemical conditions required for the synthesis of substituted tobermorite (Section) while simultaneously recovering different types of waste or scrap. As will be discussed in Section, several studies investigated how synthesis conditions influence tobermorite formation. These conditions include the Ca/Si molar ratio, aluminum content, agitation, water-to-solid ratio, temperature, time, and particle size of the source materials.
With these premises, an end-of-waste process was developed to recover fine rock dust (QD) resulting from quartzite processing and containing quartz in the form of RCS, to synthesize a substituted tobermorite-rich material. The process involves using not only QD but also KRY·AS, ?−? ? an end-of-waste material that has already proven useful in the synthesis of substituted tobermorite as Ca source.? Yield maximization was investigated by analyzing crystallization kinetics under various experimental conditions. Crucially, each synthesis test was performed in parallel, substituting KRY·AS with CaO as the Ca source; this comparative approach made it possible to determine the effect of deviation from optimal synthesis conditions on process yield.
Unlike previous studies, this research targets crystalline quartz as the silica source, thus probing the kinetics and mechanisms of its dissolution and conversion under low-temperature hydrothermal conditions. A key question addressed in this work is therefore whether RCS-containing material can not only be reused but also detoxified through complete mineralogical transformation. Furthermore, by determining activation energies and reaction orders, this work provides mechanistic insights into the rate-limiting steps that control the transformation of crystalline silica into safe tobermorite, evaluating also the role of competing phases, such as amorphous calcium silicate hydrates, katoite, and carbonates, in influencing tobermorite yield and stability.
Analytical Methods and Materials
2
Materials
2.1
QD comes from the processing site of quarries located in northwest Italy. It is mainly generated from rock block cutting operations, and the amount produced is several thousand tons per year. KRY·AS derives from the thermal inertization of cement asbestos and is a material with cytotoxic effects comparable to commercial clinker. ?,?,? KRY·AS is therefore a safe material derived from an end-of-waste process that already finds use in some applications, such as porcelain stoneware slabs and foam glass; ?−? ? furthermore, it also has a chemical and mineralogical composition with limited variability.? KRY·AS is particularly suitable for tobermorite synthesis because of its high CaO content formed during the treatment of cement asbestos. Besides QD and KRY·AS, a zeolitized tuff rich in phillipsite (ZT) was included, as phillipsite is known to catalyze tobermorite synthesis. ?,? ZT comes from a quarry near Grosseto (central Italy) and has a limited cost because it can be sourced as a byproduct. In fact, in the past, and to a large extent today, zeolitized tuffs were used to obtain natural stone for construction; over the years, significant amounts of zeolite-rich scrap have accumulated that can be profitably used in such applications.
Synthesis Procedure
2.2
Al-substituted tobermorite (hereafter referred to as tobermorite) can be easily synthesized in a simulated hydrothermal environment, provided that the molar ratios 0.80 < Ca/[Si + Al + Fe] < 0.85 and 0.00 < [Al + Fe]/[Al
- Si + Fe] < 0.17 are approximately met. ?,?,?,?,? Tobermorite can also form with a different Ca/Si ratio; however, as the Ca/Si ratio increases, along with a greater presence of Al, the crystal morphology of tobermorite changes, an aspect that must necessarily be taken into account in applications. ?,? Based on the results described in the literature and mentioned above, a mixture (M1) was prepared by dosing 75, 22.5, and 2.5 wt % of KRY·AS (used as the main source of calcium), QD, and ZT, respectively (Table). A second mixture (M2) was prepared using pure CaO from Sigma-Aldrich as a source of Ca, replacing KRY·AS, by dosing 42.0, 55.5, and 2.5 wt % of CaO, QD, and ZT, respectively (Table). These mixtures were selected to meet the molar ratio described earlier and to maximize the recovery of QD. These materials, after equilibrating at room temperature for 24 h, were mixed in the amounts indicated using an agate mortar. The syntheses were carried out in Teflon-lined Parr autoclaves by adding 15 mL of 1 M NaOH (pure-grade reagent) solution to 1 g of each mixture; this ratio was found to perform best for fine particle starting materials. ?,? Although small particle sizes, particularly of quartz, can favor reaction kinetics,? the starting material did not undergo further grinding processes as it was already small in size (see Section). The autoclaves were placed in an incubator on a tilting table (60 oscillations/min) to facilitate interaction between the solid and the solution, as agitation was found to improve tobermorite formation. ?,? The temperatures and interaction times were 120, 130, and 140 °C and 4, 8, 12, 24, 36, 48, 72, 108, and 144 h. Although the formation of tobermorite and other phases depends on a combination of multiple factors (e.g., reaction time, composition of the starting mixture, interaction mode, etc.), the temperature values of 120, 130, and 140 °C were chosen because they represent the range in which the formation of tobermorite is most favored. ?−? ? ? ? ? ? ? ? Below 120 and above 140 °C, tobermorite can form; nevertheless, below 120 °C (as well as at the beginning of the reaction), amorphous CSH (calcium silicate hydrate) phases are favored, whereas increasing temperature (or later in the reaction) leads to the formation of crystalline tobermorite or xonotlite, with xonotlite being favored above 140 °C. ?,? Moreover, above 150 °C, Al^3+^ for Si^4+^ substitutions, which drive the cation exchange capacity of the material, are more limited.? Also, with a view to possible industrial scale-up, lower temperatures mean greater energy savings. Once the autoclaves were removed from the incubator and cooled, the solid was separated from the solution by centrifuging for 5 min at 6000 rpm and then washed with distilled water until a pH close to neutrality was obtained and air-dried. Each sample was then named by indicating the starting mixture (M1 or M2), temperature, and synthesis time in the label. For example, sample M1-72H-120 indicates a synthesis obtained at 120 °C starting from the M1 mixture after 72 h of interaction.
1: Chemical (mol/100g) and Mineralogical (Weight %) Composition of QD, KRY·AS, and ZT (Experimental) and of M1 and M2 (Calculated; See above)
Analytical Methods
2.3
A consolidated protocol of analysis, based on X-ray diffraction, scanning electron microscopy, chemical analysis, particle size analysis, and thermogravimetric analysis, was applied. Details about the methods, instruments, and experimental conditions are provided in Supporting Information.
Crystallization Kinetics
of Tobermorite
2.4
To investigate the reaction kinetics, the weight fractions of tobermorite vs time (h) were normalized by their respective maximum values and taken as the end of the reaction. This allowed for their conversion into α-time plots. Outliers were manually removed. Each α-time plot was fitted using the nonlinear regression approach,? assuming that the reaction is single-step, and the data were fitted with a first-order kinetic equation:
where k = rate constant (in h^–1^ here); t = time (h). The rate constants k calculated from the analysis of the isothermal α-time plots were successively used in the Arrhenius equation:?
where A = frequency factor; E a = apparent activation energy; R = gas constant = 0.00831446261815324 kJK^–1^ mol^–1^; T = temperature in K. By plotting ln(k) versus 1/T, E a can be calculated from the slope of the first-order curve. The data analyses were performed using SigmaPlot for Windows version 12.0 (Systat Software, Inc.).
Results and Discussion
3
Material
Characterization and Mixture Composition
3.1
Chemical and quantitative mineralogical phase analyses (QPA) of the pristine materials, as well as the compositions of M1 and M2, are shown in Table.
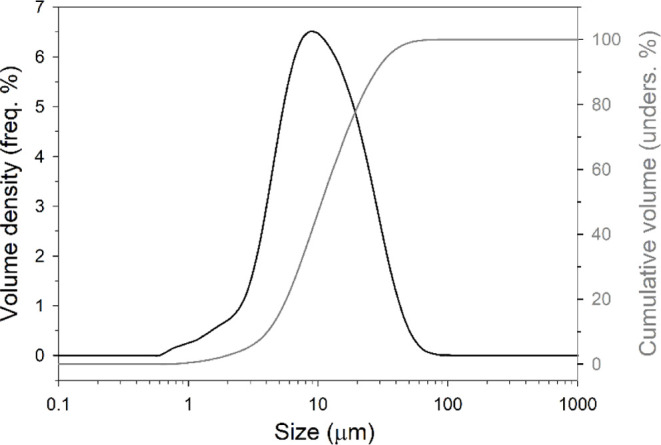
QPA evidence indicates a high quartz content for QD; this feature, accompanied by the results of particle size analyses (Figure) suggested that some of the quartz might be present in respirable form, a finding later confirmed by scanning electron microscopy with energy-dispersive X-ray spectroscopy (SEM-EDX) measurements (Figure S1). Moreover, the grain size analysis (Figure) shows that QD is predominantly composed of silt-sized particles, with 96.24% of the material falling within the 2–50 μm range (USDA classification) and 90.52% within the 3.9–63 μm range (Udden-Wentworth classification). The sample exhibits a poorly sorted distribution with a D v(50) of 10.6 μm and a span of 2.222 μm, suggesting a relatively broad size distribution. Notably, a fraction (2.73–9.23%) of the material consists of clay-sized particles (<2–3.9 μm), which could be relevant when considering the potential for RCS exposure, as particles <4 μm in size can easily travel deeper into the lungs, reaching the alveoli and leading to potential long-term health issues. ?−? ? ?
Frequency (black line) and undersize (gray line) size distribution for sample QD.
Chemically, QD contains the silicon and aluminum needed for tobermorite synthesis, but it is relatively poor in calcium and must therefore be supplemented with KRY·AS (M1) or CaO (M2).
Synthesis and Characterization of Tobermorite-Rich
Materials
3.2
Crystallization test data provide insights into mineralogical phase evolution over time at different temperatures (120, 130, and 140 °C) starting from M1 and M2 mixtures. The numerical values discussed below are given in Table S1.
Synthesis from M1
3.2.1
X-ray powder diffraction (XRPD) patterns of samples obtained after 4 and 8 h show tobermorite-related reflections; however, these are very broad peaks that do not allow for reliable quantitative analysis. At 120 °C (12 h), the amount of tobermorite is 7.2 wt % and gradually increases to 21.9 wt % (144 h) (Figurea). At 130 °C (Figureb), the initial content is higher (16.2 wt %, 12 h) and remains relatively stable around 18–19 wt % after 24 h. At 140 °C (Figurec), the tobermorite reaches a maximum of 26.1 wt % (48 h) before decreasing slightly. Thus, higher temperatures appear to promote faster tobermorite crystallization, peaking earlier at 140 °C. However, prolonged exposure (>108 h) at 140 °C results in a decline, suggesting possible transformation or instability. Brownmillerite, larnite, muscovite, periclase, and, most important for this research, quartz are gradually consumed, the latter more quickly at higher temperatures. Brownmillerite and periclase are no longer observed; it is likely that the former is used as a source of calcium, while the latter becomes amorphous or, as observed at 130 and 140 °C (Figureb,c), contributes to the formation of brucite since magnesium does not enter the structure of tobermorite or that of any of the other minerals detected (excluding brucite).?
Mineralogical phase composition over time for M1 at 120 (a), 130 (b), and 140 °C (c). For clarity, the error is not reported (in most cases, it falls within the symbol size; see Table S1a for numerical values). Legend: black circle, tobermorite; red triangle up, katoite; brown square, sum of aragonite, calcite, and vaterite; blue triangle down, sum of quartz, muscovite, and larnite; dark green hexagon, brucite; light green diamond, amorphous. Curves with all values equal to zero (Table S1a) are not shown.
The synthesis significantly increases the calcium carbonate content over the source material, including the formation of aragonite, consistent with prior studies.? Calcium carbonate crystallization is likely promoted by the presence of calcite and vaterite in M1 (Table) and by interaction with atmospheric carbon dioxide, both inside the autoclave and during subsequent air drying. Furthermore, while calcite exhibits considerable stability across all temperatures, the aragonite content diminishes at 130 and 140 °C, with vaterite no longer detectable at these higher temperatures (Table S1a). It is also observed that katoite, a hydrogarnet with the general formula Ca_3_Al_2_(SiO_4_)_3–x _(OH)_4x _, where x ranges between 1.5 and 3, the latter value in the pure hydroxyl end-member. ?,? The crystallization of katoite, a phenomenon documented in other studies concerning tobermorite formation under various conditions, ?,?,?,?−? ? decreases over time, especially at 130 and 140 °C (Figureb,c). A considerable amount of amorphous material is also formed. At 120 °C, amorphous material remains relatively high, increasing from 24.6 to 40.8 wt % (Figurea); at 130 °C (Figureb) the amorphous phase is the major product, reaching 51.5 wt % at 144 h, while at 140 °C (Figurec), its amount is lower than that at 130 °C. None of the phases present in ZT are observed in the final products, partly due to the low content (2.5 wt %) of this material used as a catalyst (see Section).
The reduction of quartz, muscovite, and larnite suggests their consumption in reaction pathways leading to the formation of tobermorite and an amorphous phase. This reaction pathway is particularly evident at 140 °C (Figuresc and S2). Furthermore, fluctuations in katoite content might point to competitive phase formation. ?,? The absence of a clear temporal correlation between the amounts of tobermorite and katoite formed implies that tobermorite does not crystallize directly from katoite but rather through interdependent transformations. The highest amorphous phase fraction at 130 °C indicates incomplete crystallization or phase stabilization issues. This proves that synthesis at 140 °C allows for better crystallization compared to lower temperature values. Overall, after prolonged reaction (>108 h), the amount of crystalline tobermorite decreases, partially transforming into denser, thermodynamically more stable phases like aragonite and, mostly, amorphous.
Synthesis
from M2
3.2.2
Even when using the M2 mixture, for syntheses at 120 and 130 °C, tobermorite starts to be well-detected through XRPD after about 12 h (Table S1b). At 120 °C (12 h), the amount is 9.7 wt % and increases steadily until it reaches 38.5 wt % at 144 h (Figurea). The initial content at 130 °C (Figureb) is much higher (20.8 wt %, 12 h) and reaches 42.6 wt % (144 h). At 140 °C (Figurec), the tobermorite increases rapidly from 27.8 wt % (12 h) to 47.8 wt % (144 h). Therefore, as with M1, higher temperatures promote faster tobermorite crystallization (at 140 °C, a concentration of tobermorite not far from the maximum is formed already after 48 h). As with M1, the process leads to the crystallization of calcium carbonates, but here with vaterite occurring also at 130 and 140 °C. The decrease in calcite content at higher temperatures after 108 h does not necessarily reflect dissolution but rather a dynamic balance between dissolution, reprecipitation, and transformation among different carbonate polymorphs (e.g., aragonite). Notably, in M2, portlandite forms through CaO hydration during the initial hours at all investigated temperatures. The subsequent disappearance of this phase after 12 h indicates its complete consumption, thereby contributing to the formation of tobermorite or amorphous material. Katoite was not observed in M2. It is well-established that both katoite and tobermorite crystallize under hydrothermal conditions, provided specific chemical compositions and pH values are maintained. ?,?,?,? The experimental conditions employed are expected to favor tobermorite formation. Consequently, its more rapid crystallization may reduce the availability of Ca and Al, thereby inhibiting the nucleation and growth of katoite. The amorphous content is subject to significant variations at all temperatures, with lower values, however, on average at 140 °C (Figurec). Significantly, even in M2, tobermorite forms mostly by consuming quartz, a process enhanced at 140 °C as evidenced by the inverse correlation between the two phases (Figure S3). In general, for both M1 and M2, and irrespective of the temperature, Si required for tobermorite crystallization is sourced from quartz (Figure S4).
Mineralogical phase composition over time for M2 at 120 (a), 130 (b), and 140 °C (c). For clarity, the error is not reported (in most cases, it falls within the symbol size; see Table S1b for numerical values). Legend: black circle, tobermorite; brown square, sum of aragonite, calcite, and vaterite; gray triangle down, sum of quartz and muscovite; dark green star, portlandite; light green diamond, amorphous. Curves with all values equal to zero (see Table S1b) are not shown.
Crystallization Kinetics of Tobermorite
3.2.3
The α-time plots of the M1 and M2 samples during the isothermal runs 120, 130, and 140 °C, along with the line fits obtained using a first-order reaction model, are shown in Figure. In Figure, the logarithmic Arrhenius plot for the calculation of the apparent activation energy E a from the slope of the regression curve is presented. The data points of the Arrhenius plot represent the kinetic constants k calculated from the 120, 130, and 140 °C isothermal runs for samples M1 and M2. The results of the fitting procedure using the first-order kinetic equation are shown in Table, including the fitting statistics and the calculated kinetic parameters with their standard errors.
2: Results of the Fit Procedure Using a First-Order Reaction Equation for the Isothermal Data of M1 and M2 Samples, including the Calculated Rate Constants, Regression Statistics R 2, and Activation Energies for the Arrhenius Plot (See Section for Details)
Tobermorite α-time plots of the M1 (a) and M2 (b) mixtures during the isothermal runs 120 (open circle), 130 (gray circle), and 140 °C (black circle). The line fits using a first-order reaction model are also reported.
Logarithmic Arrhenius plot for the calculation of E a (slope of the regression curve), obtained using kinetic constants k calculated from the 120, 130, and 140 °C isothermal runs for the two samples, M1 (circle) and M2 (square).
Although both are first-order reactions, kinetic data for tobermorite crystallization from M1 (primarily composed of larnite, quartz, and a Ca-rich amorphous phase) and M2 (primarily quartz and lime) revealed differences in the reaction products:
-M1 (120 and 130 °C, Figurea,b): larnite + quartz
- Ca-rich amorphous (likely CSH) → CSH (amorphous to diffraction) + tobermorite;
-M1 (140 °C, Figurec): larnite + quartz + Ca-rich amorphous (likely CSH) → tobermorite + carbonates (with inhibition of the formation of amorphous CSH);
-M2 (120, 130, and 140 °C, Figure): quartz + lime → CSH (amorphous to diffraction) + tobermorite + carbonates.
With few exceptions, the newly formed phases during tobermorite crystallization are comparable to those observed in previous in situ autoclave experiments. ?,? These studies investigated the formation of tobermorite from quartz and cement mixtures within the 100–190 °C thermal range. The authors reported that portlandite became unstable and began to decrease after 70 min; quartz diminished at variable rates, and katoite appeared around 40 min. Subsequently, hydroxylellestadite (Ca_10_(SiO_4_)3(SO_4_)3(OH)2) formed, while tobermorite was first observed around 150 min (60 min after reaching 190 °C) and continued to increase until the end of the autoclave process. Therefore, a two-step crystallization process for tobermorite was proposed:?
CSH → tobermorite (I)
Quartz, katoite, hydroxylellestadite, (CSH) → Si^4+^, Ca^2+^, Al^3+^, OH^–^ → tobermorite (II)
Reaction (I) is a solid-state transformation, while reaction (II) is a solid–liquid reaction in which tobermorite crystallizes from the liquid phase. These two reactions may proceed interdependently, and in a system with a reactive silica source, the early formation of CSH may slow the dissolution of quartz.?
The first-order model used to fit the kinetic curves of the M1 and M2 samples describes a reaction whose rate depends on the concentration of only one reactant. This reactant is thought to be CSH (see the reaction paths described above for the M1 and M2 samples), the precursor of tobermorite. In M1, Ca-rich amorphous phases (CSH) transform into tobermorite, and the crystallization of carbonates appears to inhibit further CSH formation. In M2, the reaction between quartz and lime yields CSH, tobermorite, and carbonates, suggesting that tobermorite likely forms as a secondary product from the CSH phase. Although the reaction pathways observed in this study seem to point to the reaction sequence (I) described by Matsui et al. (2011),? a contribution from the reaction sequence (II) cannot be ruled out, and an interconnection between these two reactions is therefore probable.
Another study? tracked the crystallization of 11 Å-tobermorite from quartz with mean grain sizes of 8 and 16 μm in the 170–210 °C temperature range. This work concluded that the kinetic curves could be described with a slope of either 1 or 0.5, corresponding to an exponent of n = 1 (first order) or n = 2 (second order), respectively. This is interpreted as mechanisms shifting with the reaction progress from a solution-controlled mechanism to a diffusion-controlled mechanism. The initial step of the reaction is controlled by the dissolution of quartz and its reaction with portlandite, leading to the formation of a layer of CSH surrounding the quartz grains. The second part of the reaction is controlled by the diffusion of SiO_2_ through this layer of CSH-phases; portlandite is expended completely, and the Ca/Si ratio decreases. Tobermorite is then formed by the reaction of quartz with the previously formed CSH. The first stage of the model also applies to the results of this research, as suggested by SEM analysis (Figures S5 and S6) showing the formation of tobermorite by consuming quartz. The second stage of the model, occurring at higher temperatures, cannot be applied to our results.
The calculated apparent activation energies E a of 101(33) kJmol^–1^ and 111(34) kJmol^–1^ for samples M1 and M2, respectively (Table) are comparable to each other; nevertheless, they are significantly higher than the activation energy (41.54 kJ mol^–1^) determined for the crystallization kinetics of tobermorite at 140–180 °C from sodium silicate solutions (SSS) and synthetic larnite (C_2_S), using an Avrami crystal growth kinetic model.? The difference is likely due to the different experimental conditions (higher temperature range and use of SSS as the precursor). Indeed, the crystallization of tobermorite from quartz, as investigated within the 170–210 °C temperature range in the aforementioned study,? revealed a nonisokinetic reaction (see above) characterized by E a values ranging from 16.5 to 33.8 kJ/mol^–1^. This indicates that, even with dissimilar experimental parameters and reagent characteristics, the E a values for tobermorite crystallization tend to decrease with increasing temperature.
The larger number of reaction products observed for M1 and, to a lesser extent, M2 compared to the systems described in the literature can be attributed to two main factors: the increased complexity of the starting materials (especially M1) and the dynamic synthesis method (performed on a tilting table; see Section). Despite the higher activation energy required, this nonstatic approach appears to favor substituted tobermorite synthesis at a relatively lower temperature than other systems documented in the literature, ?,? preventing the formation of competing phases. Nevertheless, 120 °C seems to be a minimum threshold temperature for tobermorite formation, as 144 h tests conducted at 110 °C yielded no tobermorite (or even katoite) and left a considerable amount of residual quartz (see, for example, Figure S7).
Thermal
Behavior
3.3
The thermogravimetric and its first derivative analysis (TGA-DTG), thermodifferential analysis (DTA), and mass spectrometry of evolved gas (MSEGA) of the materials with the highest tobermorite content (i.e., M1-48H-140 and M2-144H-140) are shown in Figures and ?, respectively.
Thermal behavior of samples M1-48H-140. (a) TGA (black solid lines), DTG (black dashed lines), and DTA (gray line) curves (the maxima on the DTA curve denote exothermic reactions); (b) MSEGA curves for H2O (m/z = 18) and CO2 (m/z = 44).
Thermal behavior of samples M2-144H-140. TGA/DTG/DTA (a) and MSEGA (b) curves. Legend like that in Figure .
Sample M1-48H-140 (Figurea) shows three primary thermal events: (1) 25–215 °C (maximum reaction rate at 115 °C; mass loss of 6.40 wt %), (2) 305–410 °C (maximum at 351 °C; mass loss of 2.31 wt %), and (3) 507–763 °C (maximum at 706 °C; mass loss of 12.84 wt %). Two additional minor reactions (A and B, respectively) occur between 215 and 305 °C (maximum not defined; mass loss of 1.74 wt %) and between 770 and 821 °C, peaking at 786 °C, with a mass loss of 0.13 wt %. Reaction (1), evidenced by the release of water (m/z = 18, Figureb), corresponds to the removal of zeolitic water from tobermorite. Reaction (2), also coupled with water release, is attributed to the simultaneous dehydroxylation of katoite,? brucite, ?,? and other amorphous hydroxides or the dehydration of amorphous CSH. Reaction (3), as indicated by the release of CO_2_ (m/z = 44, Figureb), results from the decarbonation of calcite; a minor contribution to this reaction is from aragonite, suggested by the small shoulder in the DTG curve at about 590 °C, consistent with the QPA showing an aragonite content of 4.7 wt % (Table S1a). The overall mass loss of reaction (3) allows the calculation of the amount of calcium carbonates, which is 29.2 wt%, in agreement with QPA (29.5 wt %, sum of calcite and aragonite). The minor reaction (A) is attributed to the final thermal decomposition of amorphous hydroxides or the dehydration of amorphous CSH.? Reaction (B), also observed in sample M2-144H-140 and consistent with prior research,? is more difficult to interpret. This difficulty arises because the small amount of material involved in the reaction prevents the detection of any released gases. Beyond the insights provided by TGA, the DTA curve (Figurea) reveals several exothermic effects above 800 °C, indicative of the formation of high-temperature phases such as wollastonite.?
Sample M2-144H-140 shows two main thermal events (Figurea): (1) 25–265 °C (maximum reaction rate at 126 °C; mass loss of 8.84 wt %) and (2) 510–755 °C (maximum at 695 °C; mass loss of 8.41 wt %). As in M1-48H-140, two additional minor reactions (A and B, respectively) occur between 265 and 400 °C (maximum not defined; mass loss of 1.54 wt %) and between 765 and 855 °C, peaking at 805 °C, with a mass loss of 0.20 wt %.
Thermal events (1) and (2) proceed via reaction mechanisms analogous to those previously observed for the preceding sample, involving dehydration and decarbonation, respectively. Evidence of these mechanisms is also provided by evolved gas analyses (Figureb). From the mass change associated with the decarbonation reaction, a total carbonate content (calcite + aragonite) of 19.1 wt % was calculated. This aligns well with the XRPD data (21.2 wt %, Table S1b). Notably, the reaction corresponding to the dehydroxylation of katoite and brucite (reaction (2) in M1-48-140) was not observed in sample M2-144-140, consistent with the absence of these phases (Table S1b). Similar to M1-48H-140, the DTA curve (Figurea) exhibits prominent exothermic effects above 800 °C, corresponding to the formation of high-temperature phases.
A significant observation for both samples is the lack of dehydroxylation reactions associated with tobermorite. This indicates that the charge compensation required for Al^3+^ for Si^4+^ substitutions occurs through Ca^2+^ entry into the interlayer, rather than by (OH)^−^ for O^2–^ substitutions within the 7-fold Ca–O polyhedron. In fact, at low temperatures (120–140 °C), the kinetics of hydrolysis and deprotonation are slower. Consequently, even with a high (OH)^−^ concentration (synthesis occurs in an alkaline environment), the available energy is not sufficient to favor the incorporation of hydroxyls into crystalline frameworks, particularly where (OH)^−^ should occupy structural positions, e.g., bridging Si–OH–Al. ?,? Therefore, at lower temperatures, it is both thermodynamically and kinetically more favorable to incorporate Ca^2+^ into interlayer positions than to build hydroxylated sheets into the silicate layer, a process conversely favored at higher temperatures.? Moreover, the incorporation of hydroxyl into solid phases requires specific local bonding geometries (e.g., bridging OH, or terminal OH). At lower temperatures, the mobility of structural water and framework rearrangements is limited. Hence, nonhydroxylated but hydrated phases (e.g., Ca-rich CSH amorphous material and tobermorite with extra interlayer Ca^2+^) are more likely to form. ?,? Therefore, Ca^2+^ in interlayer sites tends to minimize formation energy relative to many substituted cations, meaning that the system is more thermodynamically stable when Ca^2+^ is present. In fact, interlayer Ca^2+^ helps preserve structural features such as basal spacing and prevents undesirable rearrangements and substitution by alkali or transition metal cations, although it increases exchangeability and decreases structural stability. ?,?,?,?
Indications from the SEM Investigation
3.4
Quartz is an easily detectable mineral using XRPD, and the present Italian normative (UNI ISO 24095:2022) indicates XRPD as the analytical technique to use for crystalline silica detection (in addition to grain size analyses); however, low amounts (usually less than about 0.5 wt %) could produce diffraction signals that cannot be discriminated from the background. SEM images performed on samples M1-48H-140 and M2-144H-140 (Figures S8 and S9, respectively) support the XRPD results, indicating the absence of quartz. Complementary EDX maps reveal no discrete silica-rich grains, thereby suggesting that quartz is either absent or negligible following the synthesis procedures.
Conclusions
4
Through this research, the formation of tobermorite was investigated using waste from quartzite processing containing RCS as the source of silica.
In synthetic systems like this, higher temperatures promote rapid dissolution of quartz, providing silica for tobermorite and, in M1, katoite. Indeed, quartz is completely consumed at 130 and 140 °C but persists longer at 120 °C. However, although higher temperatures can enhance the initial nucleation rates of tobermorite, extended exposure or extreme conditions can destabilize its crystal structure, thus impairing its overall growth, particularly when employing precursors with more complex compositions (M1).
For the M1 composition, synthesis at 140 °C appears most effective for tobermorite formation, achieving the peak content more rapidly. Conversely, 120 °C leads to steady but slower crystallization with persistent amorphous material, while 130 °C retains the highest percentage of the amorphous phase, suggesting incomplete crystallization. Similarly, for M2, higher temperatures promote faster tobermorite crystallization; at 140 °C, nearly maximum formation occurs earlier (48 h), whereas at lower temperatures, the increase is more gradual. Therefore, under hydrothermal alkaline conditions, quartz grains gradually dissolve, releasing reactive silica that combines with calcium supplied by CaO or KRY·AS to form amorphous CSH. These amorphous phases act as precursors for the nucleation and growth of tobermorite, which progressively consumes quartz. During crystallization, competing phases may form, including katoite, metastable carbonate polymorphs (calcite, aragonite, vaterite) due to CO_2_ uptake, and persistent amorphous CSH at lower temperatures.
Beyond considerations of crystallization kinetics, the combined XRPD and SEM data confirm the successful recovery of the QD, with RCS transformed into safe phases. This unequivocally demonstrates that the outlined process fulfills the criteria for an End-of-Waste designation
Furthermore, this study demonstrates that the synthesis process involves the crystallization of calcium carbonates, highlighting a promising direction for future research on CO_2_ storage.
Supplementary Material
The reference list from the paper itself. Each links out to its DOI / PubMed record.
- 1Murugadoss S.Lison D.Godderis L.Van Den Brule S.Mast J.Brassinne F.Sebaihi N.Hoet P. H.Toxicology of Silica Nanoparticles: An Update Arch. Toxicol.20179192967301010.1007/s 00204-017-1993-y 28573455 PMC 5562771 · doi ↗ · pubmed ↗
- 2Sato T.Shimosato T.Klinman D. M.Silicosis and Lung Cancer: Current Perspectives Lung Cancer Targets Ther.201899110110.2147/LCTT.S 156376 PMC 620709030498384 · doi ↗ · pubmed ↗
- 3Hoy R. F.Jeebhay M. F.Cavalin C.Chen W.Cohen R. A.Fireman E.Go L. H. T.León-Jiménez A.Menéndez-Navarro A.Ribeiro M.Rosental P.Current Global Perspectives on SilicosisConvergence of Old and Newly Emergent Hazards Respirology 202227638739810.1111/resp.1424235302259 PMC 9310854 · doi ↗ · pubmed ↗
- 4Liu J. Y.Sayes C. M.A Toxicological Profile of Silica Nanoparticles Toxicol. Res.202211456558210.1093/toxres/tfac 038PMC 942471136051665 · doi ↗ · pubmed ↗
- 5OSHA OSHA 1926.1153. https://www.osha.gov/laws/regs/regulations/standardnumber/1926/1926.1153 (accessed 29 April 2025).
- 644/2020/IT. https://www.normattiva.it/uri-res/N 2Ls?urn:nir:stato:decreto.legislativo:2020;44 (accessed 29 April 2025).
- 72398/2017/CE. http://data.europa.eu/eli/dir/2017/2398/oj/ita (accessed 29 April 2025).
- 8Leso V.Fontana L.Romano R.Gervetti P.Iavicoli I.Artificial Stone Associated Silicosis: A Systematic Review Int. J. Environ. Res. Public Health 201916456810.3390/ijerph 1604056830781462 PMC 6406954 · doi ↗ · pubmed ↗