The MYC-dependent lncRNA MB3 inhibits apoptosis in Group 3 Medulloblastoma by regulating the TGF-β pathway via HMGN5
Alessia Grandioso, Paolo Tollis, Francesca Romana Pellegrini, Elisabetta Falvo, Alessandro Palma, Francesco Migliaccio, Alessandro Belvedere, Jessica Rea, Giada Tisci, Annamaria Carissimo, Irene Bozzoni, Daniela Trisciuoglio, Monica Ballarino, Pierpaolo Ceci, Pietro Laneve

TL;DR
A MYC-dependent lncRNA called MB3 helps aggressive medulloblastoma tumors survive by blocking cell death through the TGF-β pathway and HMGN5.
Contribution
Identifies a novel lncRNA, lncMB3, that inhibits apoptosis in Group 3 Medulloblastoma via the TGF-β pathway and HMGN5.
Findings
LncMB3 regulates the TGF-β pathway by binding and inhibiting HMGN5 mRNA translation.
LncMB3 promotes apoptosis inhibition through photoreceptor lineage genes like OTX2.
Combining lncMB3 targeting with cisplatin treatment shows synergistic effects in G3 Medulloblastoma.
Abstract
Group 3 (G3) is one of the most common and aggressive subtypes of the paediatric cerebellar tumour Medulloblastoma (MB), primarily driven by the MYC oncogene. The challenging targeting of MYC, coupled with gaps in understanding G3 MB molecular bases, has hindered the development of targeted therapies. The unconventional oncogenic roles of long noncoding RNAs (lncRNAs) offer opportunities to address this complexity, to provide insights and to identify novel targets. Using -omics approaches and molecular/cellular assays, we elucidate the mode-of-action of lncMB3, a MYC-dependent, anti-apoptotic lncRNA in G3 MB. LncMB3 regulates the TGF-β pathway, critically altered in G3 medulloblastomagenesis, via direct binding and translational inhibition of the mRNA for the epigenetic factor HMGN5. This regulatory axis affects apoptosis through photoreceptor lineage genes, including the G3 driver…
Genes, proteins, chemicals, diseases, species, mutations and cell lines named across the full text — each resolved to its canonical identifier and authoritative record.
Click any figure to enlarge with its caption.
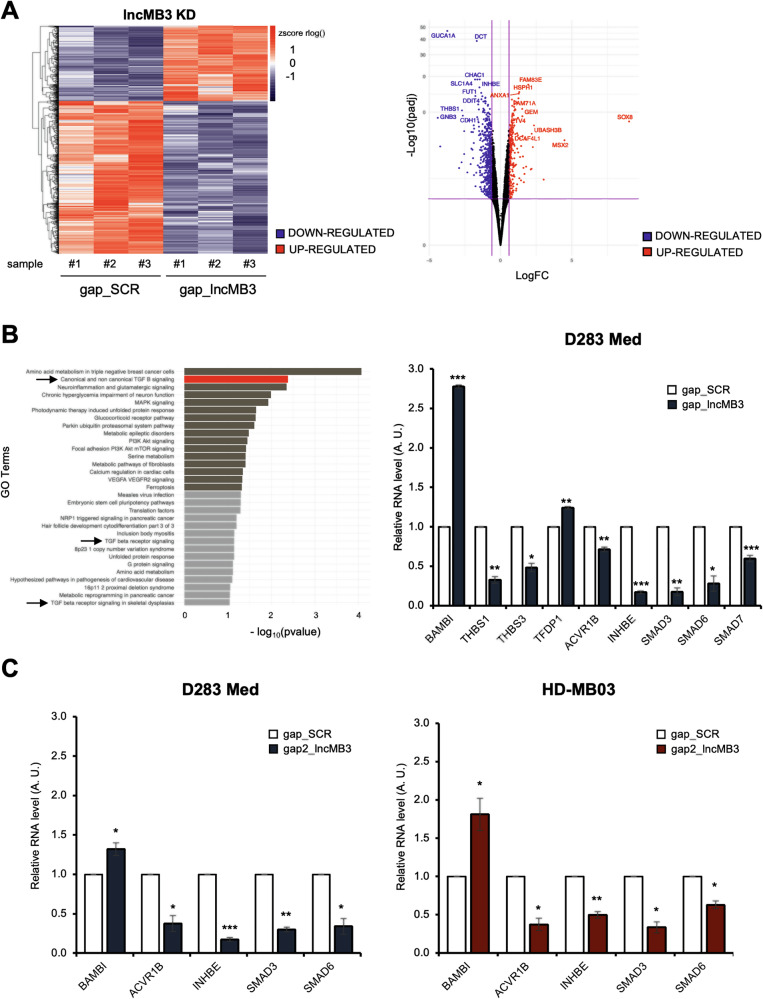 Figure 1
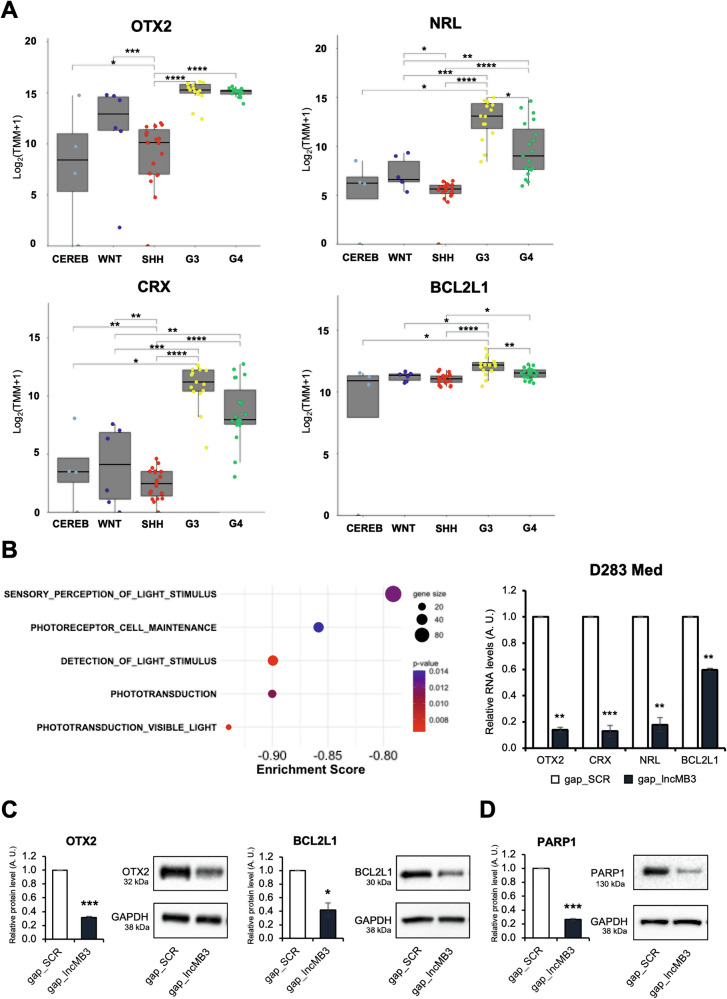 Figure 2
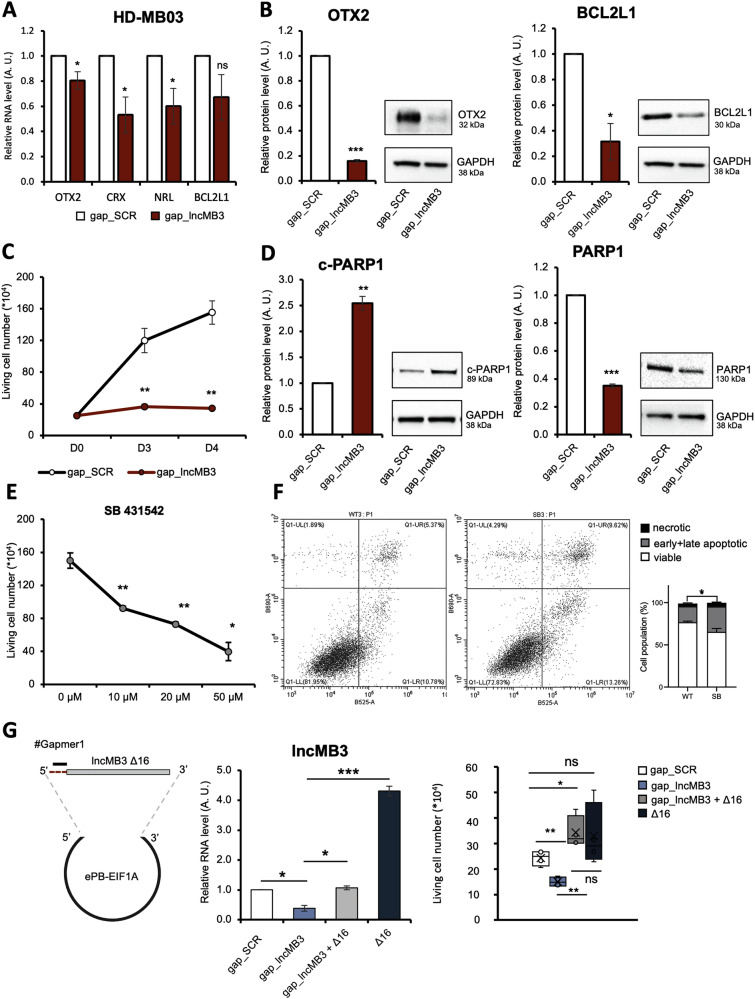 Figure 3
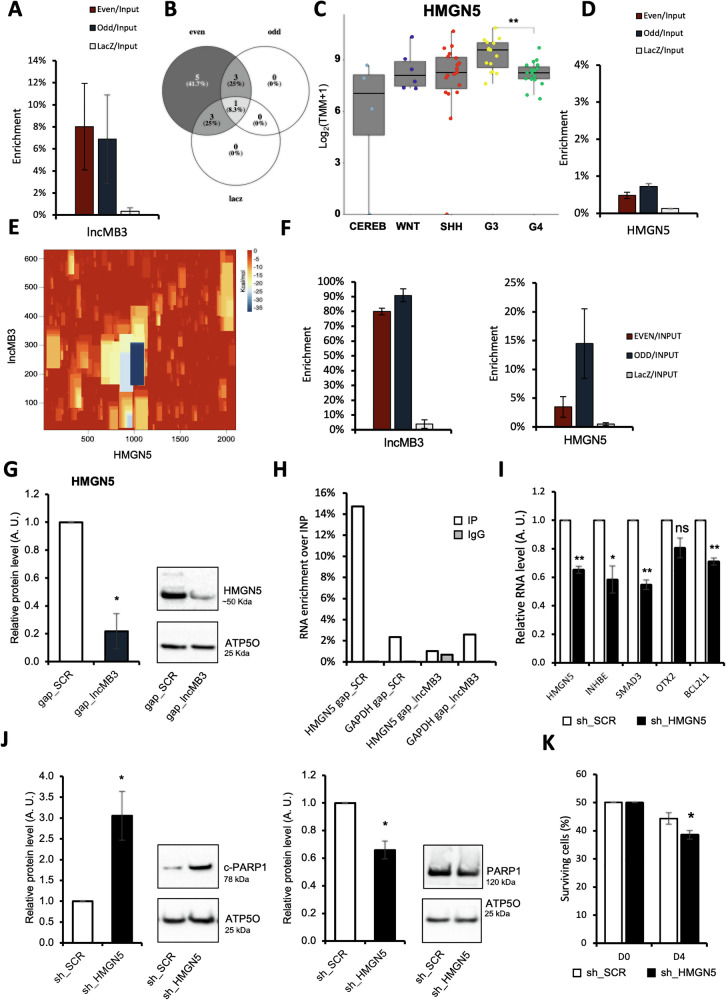 Figure 4
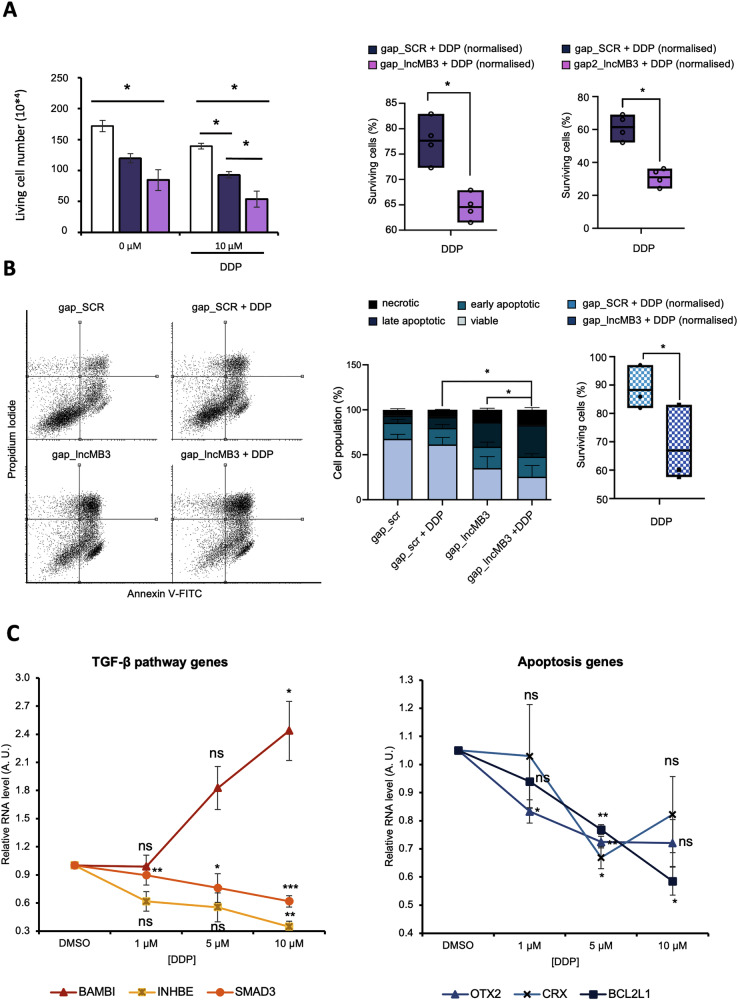 Figure 5
 Figure 6
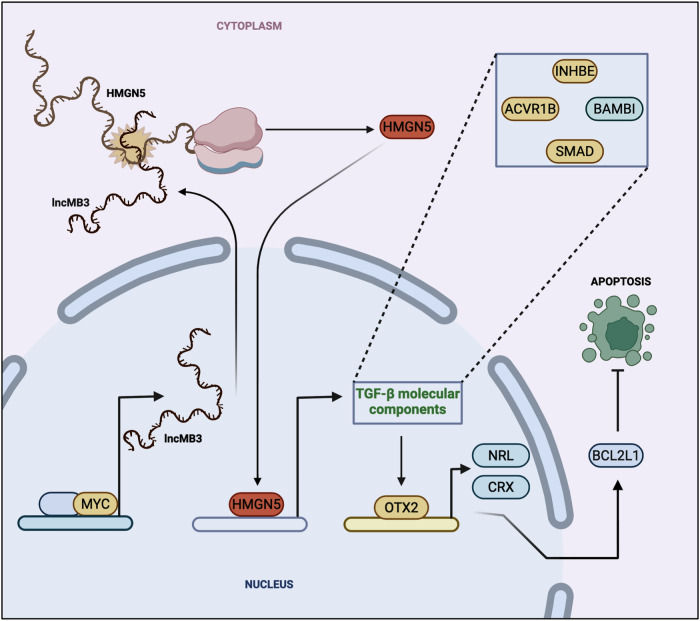 Figure 7
 Figure 8
- —https://doi.org/10.13039/501100003407Ministero dell'Istruzione, dell'Università e della Ricerca (Ministry of Education, University and Research)
- —https://doi.org/10.13039/501100004462Consiglio Nazionale delle Ricerche (National Research Council)
- —European Union - Next Generation EU (NRRP) CN00000041 (CUP B83C22002860006, Spoke #6)
- —European Union - Next Generation EU (NRRP) PRIN 2022, id. 2022WC7BL2 (CUP B53D23016520006)
- —https://doi.org/10.13039/501100005010Associazione Italiana per la Ricerca sul Cancro (Italian Association for Cancer Research)
- —European Union - Next Generation EU (NRRP) CN00000041 (CUP B83C22002870006, Spoke #3) ERC-2019-SyG 855923-ASTRA
- —https://doi.org/10.13039/501100004271Sapienza Università di Roma (Sapienza University of Rome)
- —European Union - Next Generation EU (NRRP) CN00000041 (CUP B83C22002870006, Spoke #3) European Union - Next Generation EU (NRRP) PRIN 2022, id. 2022BYB33L (CUP B53D23016090006) European Union - Next G
Peer Reviews
No public reviews on file for this paper yet. If you reviewed it on a platform where reviews are public (OpenReview, ICLR, NeurIPS, ICML), you can paste yours below so the community can read it here.
Videos
No videos yet. Explain this paper in a talk, walkthrough, or lecture? Add one.
Taxonomy
TopicsCancer-related molecular mechanisms research · Circular RNAs in diseases · RNA regulation and disease
Introduction
Medulloblastoma (MB) is the most prevalent malignant paediatric central nervous system tumour, accounting for ∼20% of all childhood brain cancers [1, 2]. Although all MBs arise in the cerebellum, share histomorphological features, and exhibit embryonic cerebellar lineage signatures [3], they show high heterogeneity. MB is classified into 4 subtypes, each with distinct biological, clinical and therapeutical implications [4]: Wingless (WNT), Sonic Hedgehog (SHH), Group 3 (G3) and Group 4 (G4). G3 and G4, together, account for 60% of MB cases and are the most aggressive, posing treatment challenges due to poor biochemical characterisation. Deciphering the molecular mechanisms of these subgroups is critical for advancing precision medicine. G3 MB presents a dismal prognosis, often with metastases at diagnosis and high recurrence rates [2], primarily driven by the oncogenic transcription factor (TF) MYC, characterised by gene copy number amplification or elevated expression [5]. Despite challenges in addressing canonical MYC circuits, targeting MYC and related pathways/complexes is essential in G3 MB management [6].
The discovery of novel classes of noncoding RNAs (ncRNAs) broadens our understanding of functional genome outputs [7], offering new therapeutic avenues for cancer. Among ncRNAs, the versatile long noncoding RNAs (lncRNAs) have emerged as key regulators of cancer hallmarks [8], showing promise as biomarkers and targets due to their cell-specific expression and regulatory roles. Over the years, we have explored ncRNAs in various nervous system cancer models, including MB [9]. Recently, we discovered MYC-dependent lncRNAs in G3 MB, three of them potentially acting as oncogenes [10], including lncMB3. Here, we functionally analyse lncMB3, which is overexpressed in tumour conditions and exerts an anti-apoptotic action. We show that lncMB3 modulates the TGF-β pathway, significantly altered in G3 MB [11], through a functional interaction with the mRNA for the epigenetic factor HMGN5, whose protein levels are upregulated and impact on a subset of TGF-β pathway genes also affected by lncMB3 targeting. This regulatory axis influences apoptosis through OTX2, another crucial G3 MB driver gene [12], and its downstream cascade. The relevance of this circuit is underscored by the synergistic effects observed when lncMB3 targeting is paired with cisplatin (DDP) administration in G3 MB cells. Lastly, we demonstrate that recombinant human ferritin-based (HFt) nanovectors, a promising platform for drug delivery in diseased conditions [13], effectively carry antisense oligonucleotides (ASOs) targeting lncMB3 in G3 MB cells.
Results
Identification of lncMB3-dependent transcriptome in G3 MB cells
To uncover the molecular network downstream of lncMB3 in MB, we conducted transcriptome analysis post-knockdown (KD) in the MYC-amplified D283 Med cell line, where the lncRNA is highly expressed (Fig. S1A) and was first identified [10]. GTEx data (https://gtexportal.org/home/) show minimal expression of lncMB3 in healthy tissues (Fig. S1B). KD reduced lncMB3 expression by ∼70% (Fig. S2A), 72 h after multi-pulse transfections of a Locked Nucleic Acid (LNA)-based ASO [14], named GapmeR #1, targeting the lncRNA 5′ region. Transcriptome data analysis showed robust gene detection (Fig. S2B, left panel), accurate transcriptome clustering (Fig. S2B, right panels) and consistency of lncMB3 KD normalised read counts with previous qRT-PCR analyses (Dataset 1).
RNA-Seq analysis (Dataset 1) detected 14655 transcripts expressed in at least one sample and identified 2995 differentially expressed genes (DEGs) between lncMB3 KD and control (SCR), with FDR < 0.05 (Fig. 1A, left panel). Among them, 1395 were downregulated and 1600 upregulated following lncMB3 silencing (Fig. 1A, right panel, blue and red dots). To technically validate the transcriptome profile and confirm RNA-seq expression trends across a range of statistical confidence, 14 of these genes were selected, with padj ranging from 0.001 to 0.05, irrespective of their biological function (Fig. S2C and Dataset 1).Fig. 1. Differential gene expression analysis upon lncMB3 KD in G3 MB cells.A Left Panel: heatmap showing the relative levels of DEGs according to RNA-Seq analyses, along with genes hierarchical clustering (3 biological replicates for each condition). Right Panel: volcano plot showing DEG distribution. Genes were plotted based on statistical significance −log_10_(FDR) and differential expression log_2_(FC). Downregulated genes (logFC < −0.6) are indicated by blue dots; upregulated genes (logFC > 0.6) by red dots. Invariant genes are indicated in black. B Left Panel: GO (wikipathways) showing the distribution in clusters of the DEGs in gap_lncMB3 vs gap_SCR-treated D283 Med cells, according to RNA-seq data. Categories are listed considering –log_10_(pvalue) and TGF-β-related ones are pointed by arrows. Right Panel: qRT-PCR validation analysis of TGF-β pathway genes in D283 Med cells treated for 72 h with gap_SCR or gap_lncMB3 (GapmeR #1). Expression levels were compared to gap_SCR sample as control, set as 1. Data (means ± SEM) are expressed in arbitrary units (A.U.) and are relative to GAPDH mRNA levels. N = 3, * p ≤ 0.05, ** p ≤ 0.01, *** p ≤ 0.001 (two-tailed Student’s t-test). C Left Panel: qRT-PCR analysis of TGF-β pathway genes in D283 Med cells treated for 72 h with gap_SCR or gap2_lncMB3 (GapmeR #2). Right Panel: HD-MB03 cells treated as above (GapmeR #2). Expression levels were compared to gap_SCR sample as control, set as 1. Data (means ± SEM) are expressed in arbitrary units and are relative to GAPDH mRNA levels. N = 3 to 5, * p ≤ 0.05, ** p ≤ 0.01, *** p ≤ 0.001 (two-tailed Student’s t-test).
To functionally explore the transcriptomic landscape, DEGs were filtered by quantitative criteria, such as fold change (FC) robustness, statistical significance and expression levels (Fig. S2D). Thirteen RNAs regulated by lncMB3 were identified (12 protein-coding and 1 lncRNA): 7 significantly downregulated and 6 upregulated (Dataset 2). qRT-PCR validated RNA-Seq data for the selected DEGs, displaying statistical significance (10 out of 13 genes) or discernible variance trends (Fig. S3A).
Throughout this study, we validated by qRT-PCR, achieving statistical significance, 37 out of 40 genes identified through RNA-Seq, yielding a validation rate of approximately 93%.
The top DEG identified was INHBE, a component of the TGF-β pathway [15], associated with G3 MB pathogenesis [11].
Gene Ontology (GO) analysis of DEGs highlighted the full set of functional gene categories affected by lncMB3 depletion (Fig. 1B, left panel). Among the top ontological annotations, GO revealed pathways such as “PIK3-Akt signalling”, associated to chemosensitivity in various cancers, including MB [16], and “MAPK signalling”, potentially reflecting apoptosis-induced DNA damage following lncMB3 KD. Focus remained on the TGF-β pathway, the second most prominent gene category, deregulated in G3 compared to other MB subgroups. It appeared in both the up and downregulated gene sets (Fig. S3B), suggesting deregulation of both activatory and inhibitory elements in the same pathway. Gene Set Enrichment Analysis (GSEA) confirms the significant impact of lncMB3 KD on the TGF-β pathway in G3 MB cells (Fig. S3C).
LncMB3 regulates the TGF-β pathway in G3 MB
Aberrant TGF-β signalling is involved in the development of numerous diseases, including cancer [17]. In G3 MB, its dysregulation is believed to drive processes such as cell proliferation, differentiation and survival [11].
The importance of the TGF-β cascade in our system and conditions was further highlighted by enriching the ontological category with additional DEGs involved in the pathway. We identified a set of 9 genes, including TGF-β/Activin signalling ligands (INHBE, [15]; THBS1, THBS3, [18]), receptors (ACVR1B,[19]; BAMBI, [20]), effectors (SMAD3, SMAD6, SMAD7, [19]) and downstream regulators (TFDP1, [21]) (Fig. S3D). Upon lncMB3 KD, qRT-PCR showed repression of genes with activatory functions in the pathway (THBS1, THBS3, INHBE, ACVR1B, SMAD3, SMAD6, SMAD7), with reductions ranging from 20% to 80% (Fig. 1B, right panel). Conversely, inhibitory components (BAMBI and TFDP1) were upregulated (1.5- to threefold, Fig. 1B, right panel), suggesting a coherent and coordinated contribution of both positive and negative effects leading to overall downregulation of the TGF-β/Activin branch of the network. To ensure specificity of targeting, we employed a second GapmeR (GapmeR #2), which recognises the 3′ end of lncMB3 (Fig. S4A), achieving 70% transcript depletion in D283 Med cells (Fig. S4B). In HD-MB03, another G3 MB cell line where MYC and lncMB3 are upregulated (Fig. S1A) and that we used to further corroborate our findings, GapmeR #2 reduced lncMB3 levels by 50% (Fig. S4B). Validations showed similar expression changes across all the tested conditions for 5 TGF-β network genes: BAMBI, ACVR1B, INHBE, SMAD3 and SMAD6 (Fig. 1C). Since GapmeR #1 targets the 5′ end of lncMB3 and results in a more efficient downregulation (Fig. S4B), it was preferred for subsequent experiments. To corroborate lncMB3 as a regulator of the TGF-β pathway, we analysed the publicly available transcriptomic dataset GSE164677, comparing 59 patient-derived samples across all MB subgroups and 4 controls. We stratified MB samples into 3 groups: healthy controls (Cereb), G3 MB patients with high lncMB3 expression (High), and G3 MB patients with low/negative lncMB3 expression (Low). As expected, and despite the limited sample size, MYC expression—used here as a positive control—appears to associate with lncMB3 levels in this dataset (Fig. S4C). More specifically, results suggest a correlation trend between the TGF-β genes ACVR1B, INHBE, SMAD3 and SMAD6 and lncMB3 (Fig. S4C), in term of increased median expression in the lncMB3-High group compared to normal tissue, and a decrease in the lncMB3-Low group. As a negative control, we examined the expression of genes excluded from the lncMB3 core target list due to inconsistent regulation with one of the two GapmeRs or in one cell line (Fig. 1C), and we appreciated a lack of consistent patterns in patient samples (Fig. S4D). To further confirm the relevance of the genes of interest, we compared the distribution of a composite differential expression score (“–log10(padj) × log2FoldChange”) between validated and non-validated target gene groups in High vs Low (including healthy cerebella) lncMB3 samples. The Wilcoxon rank-sum test revealed a significant difference between them (p = 0.029), indicating that, overall, lncMB3 targets show consistent expression changes with lncMB3 in G3 MB samples (Fig. S4E). Overall, in vitro and in vivo RNA analyses point to a role for lncMB3 in the regulation of the TGF-β pathway components in G3 MB.
Insights into apoptosis regulation by lncMB3
In the developing nervous system, a relevant TGF-β cascade target is the brain-specific TF OTX2, known as a G3 MB-enriched oncogene [12], upregulated in both D283 Med and HD-MB03 cells (Fig. S1A). During retinal development, OTX2 occupies a pivotal position in a photoreceptor gene hierarchy, including basic leucine zipper TFs NRL and CRX [22], both overexpressed in G3 MB, where they promote cancer survival via the anti-apoptotic factor BCL2L1 ([23] and Fig. S3D).
To evaluate these genes in primary MB tumours, we again queried the dataset GSE164677. NRL, CRX and BCL2L1 expression was significantly upregulated in G3 compared to healthy tissues or other MB subgroups. Although OTX2 upregulation in G3 MB vs cerebellum was not statistically significant, it showed a rising trend (Fig. 2A), which was, however, insufficient to result in a linear correlation with lncMB3 expression (data not shown), possibly due to OTX2 indirect and context-dependent regulation by lncMB3. Nevertheless, the photoreceptor gene program appeared in several downregulated annotations in lncMB3 KD-dependent GSEA (Fig. 2B, left panel).Fig. 2. Expression of OTX2, NRL, CRX and BCL2L1 in MB.A OTX2, NRL, CRX and BCL2L1 mRNA expression in N = 4 healthy cerebella (CEREB) and N = 59 primary MB subgroup samples, according to the transcriptomic dataset GSE164677. Results are expressed in log_2_(TMM + 1). * p ≤ 0.05, ** p ≤ 0.01, *** p ≤ 0.001 **** p ≤ 0.0001 (two-tailed Student’s t-test). B Left Panel: GSEA biological process (BP) domains performed on deregulated genes. Categories are listed considering enrichment score, gene size and p-value. Right Panel: qRT-PCR analysis of OTX2, NRL, CRX and BCL2L1 in D283 Med cells treated for 72 h with gap_SCR or gap_lncMB3 (GapmeR #1). Expression levels were compared to gap_SCR sample as control, set as 1. Data (means ± SEM) are expressed in arbitrary units and are relative to GAPDH mRNA levels. N = 3, ** p ≤ 0.01, *** p ≤ 0.001 (two-tailed Student’s t-test). C Western blot analysis of OTX2 (left panel) and BCL2L1 (right panel) protein levels in D283 Med cells treated for 72 h with gap_SCR or gap_lncMB3 (GapmeR #1). Normalisations are relative to GAPDH protein levels. N = 3, * p ≤ 0.05, *** p ≤ 0.001, (two-tailed Student’s t-test). D Western blot analysis of PARP1 protein levels in D283 Med cells treated for 72 h with gap_SCR or gap_lncMB3 (GapmeR #1). Details as in (C).
OTX2, NRL, CRX and BCL2L1 RNAs were downregulated in D283 Med cells after lncMB3 depletion (Fig. 2B, right panel). Protein downregulation was also assessed for OTX2 and BCL2L1 (Fig. 2C), as well as for PARP-1 (Fig. 2D) [24], whose cleavage product (C-PARP) is an apoptosis hallmark. Further confirmation of the lncRNA involvement in this axis was obtained in HD-MB03 cells using GapmeR #1, with lncMB3 depletion leading to (i) reduced RNA and protein levels for OTX2, NRL, CRX and BCL2L1 (Fig. 3A, B); (ii) decreased cell viability (Fig. 3C); and (iii) corresponding modulation of C-PARP and PARP-1 levels (Fig. 3D).Fig. 3. Analysis of TGF-β pathway and apoptosis in G3 MB cells.A qRT-PCR analysis of OTX2, NRL, CRX and BCL2L1 in HD-MB03 cells treated for 72 h with gap_SCR or gap_lncMB3 (GapmeR #1). Expression levels were compared to gap_SCR sample as control, set as 1. Data (means ± SEM) are expressed in arbitrary units and are relative to GAPDH mRNA levels. N = 3, * p ≤ 0.01 (two-tailed Student’s t-test). B Western blot analysis of OTX2 (left panel) and BCL2L1 (right panel) protein levels in HD-MB03 cells treated for 72 h with gap_SCR or gap_lncMB3 (GapmeR #1). Normalisations were performed relative to GAPDH protein levels. N = 3, * p ≤ 0.05, *** p ≤ 0.001, (two-tailed Student’s t-test). C Time course analysis of the number of viable HD-MB03 cells depleted for lncMB3 (gap_lncMB3). Scramble-transfected cells (gap_SCR) were used as control. Cells were transfected at day 0 (D0) and counted at each timepoint. Data (means ± SEM) are expressed as the number of viable cells, counted by an automated cell counter. N = 4, ** p ≤ 0.01, (two-tailed Student’s t-test). D Western blot analysis of c-PARP1 (left panel) and PARP1 (right panel) protein levels in HD-MB03 cells treated for 72 h with gap_SCR or gap_lncMB3 (GapmeR #1). N = 3, ** p ≤ 0.01, *** p ≤ 0.001. Details as in (B). E Dose-response analysis of the number of viable D283 Med cells after TGF-β inhibition. Control cells were treated with vehicle (DMSO). Cell counts started 24 h after treatment. Data (means ± SEM) are expressed as the number of viable cells, counted by an automated cell counter. N = 4, * p ≤ 0.05, ** p ≤ 0.01 (two-tailed Student’s t-test). F Left Panel: representative flow cytometry analysis of propidium iodide- and Annexin V-stained D283 Med cells upon TGF-β inhibition. X-axis Annexin V-FITCH staining; Y-axis: PI staining. Right Panel: quantification of the fractions (expressed as percentage of total cell number) of viable (Annexin V−/PI−), early apoptotic (Annexin V+/PI−), late apoptotic (Annexin V+/PI+) and necrotic (Annexin V−/PI+) cells. For early+late apoptotic cells, N = 3, * p ≤ 0.05 (two-way ANOVA). G Left panel: schematic representation of the construct overexpressing lncMB3 Δ16. Middle panel: qRT-PCR analysis of lncMB3 expression in D283 Med cells transfected with gap_SCR, gap_lncMB3 or gap_lncMB3 + Δ16 construct, Δ16 construct alone. N = 3, * p ≤ 0.05, *** p ≤ 0.001. Right panel: number of viable D283 Med cells upon gap_lncMB3 transfection (lncMB3 KD) or Δ16 co-expression, or Δ16 expression alone, compared to gap_SCR condition. Normalisation was performed on lncMB3 KD condition. N = 5, * p ≤ 0.05, ** p ≤ 0.01 (two-tailed Student’s t-test).
Consistent with lncMB3 regulation by MYC [10], RNA alterations seen with lncMB3 KD were also observed in MYC-inhibited D283 Med cells vs untreated cells (Dataset 3). To further link lncMB3 and the TGF-β pathway within the same regulatory network, we used a TGF-β Receptor Kinase inhibitor to block Smad2/3 phosphorylation. After 48 h-treatment, we observed a dose-dependent reduction in the number of viable D283 Med cells, which were prioritised in all drug assays (Fig. 3E), correlated with increased apoptosis via Annexin V assay (Fig. 3F). These findings show that direct TGF-β cascade inhibition produced effects converging with lncMB3 silencing.
To definitively confirm lncMB3 role in counteracting apoptosis, we performed a rescue assay. A plasmid carrying the lncRNA sequence lacking its first 16 nucleotides (Δ16), necessary for GapmeR #1 recognition, was generated (Fig. 3G, left panel). When ectopically expressed in D283 Med cells along with the ASO, the mutant lncRNA (Fig. 3G, middle panel) restored cell viability compared to cells transfected with GapmeR #1 alone (Fig. 3G, right panel). No consequences were observed when Δ16 was overexpressed alone, suggesting a saturation of the baseline cell viability rate that masked any additional pro-survival effect.
These findings reconstruct the molecular network initiated by MYC amplification and involving lncMB3 as a trans-acting non-coding RNA that suppresses apoptosis in G3 MB.
Insights into the RNA interactome of lncMB3
The lack of coding potential in lncRNAs necessitates the identification of their molecular partners as a strategy to understand their mechanisms of action [25]. To investigate how lncMB3 modulates TGF-β and apoptotic pathway genes through such interactions, we adopted a stepwise approach guided by hypotheses of increasing complexity, with a particular focus on RNA–RNA interactions, given their emerging significance in molecular oncology [26, 27] and their suitability for experimental validation.
Initially, we hypothesized a straightforward interaction between lncMB3 and target mRNAs downregulated upon its KD. Preliminary analyses using the IntaRNA algorithm (http://rna.informatik.uni-freiburg.de/), which maps RNA-RNA binding regions, yielded low interaction propensity (Dataset 4). However, to experimentally explore possible indirect associations, we conducted RNA pull-down assays as in [28], with 2 independent pools of specific biotinylated antisense probes (Fig. 4A). qRT-PCR analysis of lncMB3-enriched pull-down fractions with EVEN and ODD probe sets compared to control LacZ-precipitated fractions (Dataset 5) showed no significant candidate enrichment (Dataset 6), excluding any RNA interaction between lncMB3 and TGF-β or downstream pathway transcripts.Fig. 4. Analysis of lncMB3/HMGN5 mRNA interaction.A qRT-PCR analysis of RNA enrichment in EVEN, ODD and LacZ fractions over Input, from native lncMB3 RNA pull-down experiments in D283 Med cell extracts. Data expressed as percentage of Input, N = 2. B Venn diagram showing intersections of mRNAs retrieved and sequenced from two independent native lncMB3 pull-down fractions (EVEN, ODD, LacZ). C HMGN5 mRNA expression in N = 4 healthy cerebella (CEREB) and N = 59 primary MB subgroup samples, according to the transcriptomic dataset GSE164677. Results are expressed in log_2_(TMM + 1). * p ≤ 0.05, ** p ≤ 0.01, *** p ≤ 0.001, **** p ≤ 0.0001 (two-tailed Student’s t-test). D qRT-PCR analysis of HMGN5 mRNA enrichment in native lncMB3 RNA pull-down fractions. Details as in (A). Data are expressed as percentage of Input, N = 2. E IntaRNA energy map representing the predicted stability of the RNA-RNA interaction between lncMB3 and HMGN5 mRNA. mRNA and lncRNA sequences are positioned along the x- and y-axes, respectively. The free energy of predicted intramolecular pairs ranges from red (higher energy, unstable pairing) to blue (minimal energy, stable pairing). F qRT-PCR analysis of lncMB3 (left panel) and HMGN5 mRNA (right panel) enrichment in EVEN, ODD and LacZ fractions over Input, from AMT-crosslinked lncMB3 RNA pull-down experiment in D283 Med cells. Data expressed as percentage of Input, N = 3. G Western blot analysis of HMGN5 protein levels in D283 Med cells treated for 72 h with gap_SCR or gap_lncMB3 (GapmeR #1). Normalisations were performed relative to GAPDH protein levels. N = 3, * p ≤ 0.05, (two-tailed Student’s t-test). H qRT-PCR analysis of HMGN5 and GAPDH upon RPL22-FLAG RIP assay in gap_SCR and gap_lncMB3 (GapmeR #1) conditions. Analysis of RNA enrichment in IP and IgG fractions over Input. N = 1. Data expressed as percentage of Input. I qRT-PCR analysis of HMGN5, INHBE, SMAD3, OTX2, BCL2L1 mRNAs in D283 Med cells treated for 72 h with sh_SCR or sh_HMGN5. Expression levels were compared to sh_SCR sample as control, set as 1. Data (means ± SEM) are expressed in arbitrary units and are relative to GAPDH mRNA levels. N = 3, * p ≤ 0.05, ** p ≤ 0.01 (two-tailed Student’s t-test). J Western blot analysis of c-PARP1 (left panel) and PARP1 (right panel) protein levels in D283 Med cells treated for 72 h with sh_SCR or sh_HMGN5. N = 3, * p ≤ 0.05 (two-tailed Student’s t-test). K Analysis of number of viable D283 Med cells treated for 72 h with sh_SCR or sh_HMGN5. Data (means ± SEM) are expressed as the number of viable cells, counted by an automated cell counter. N = 3, * p ≤ 0.05 (two-tailed Student’s t-test).
We then considered the competing endogenous RNA network, a regulatory mechanism in which long transcripts modulate microRNA activity by acting as molecular sponges. Through this mechanism, lncMB3 may sequester microRNAs repressing its targets and indirectly control their expression. Preliminary interaction predictions between lncMB3 and the core RNA-induced silencing complex component Argonaute 2 (AGO2) performed through the catRAPID algorithm (http://s.tartaglialab.com/page/catrapid_group) (Dataset 7) were experimentally validated through a CLIP assay (Fig. S5A). Based on these results, we employed Targetscan (https://www.targetscan.org/vert_80/) to identify microRNAs predicted to bind both lncMB3 and target mRNAs (Dataset 8). Of 6 candidates (hsa-miR-135b-5p, hsa-miR-216a-3p, hsa-miR-3681-3p, hsa-miR-613, hsa-miR-1197, hsa-miR-196b-5p), the top 3 were tested by qRT-PCR on lncMB3 pull-down fractions, showing no significant enrichment and ruling out the hypothesis of competition for microRNA association (Dataset 9).
Finally, lncMB3 may regulate its downstream gene network by binding and modulating other mRNAs, that are in turn involved in the control of target gene expression [29]. To explore this hypothesis, we identified lncMB3 interactome by cross-referencing RNA-Seq data from independent lncMB3 pull-down replicates (Fig. 4B and Dataset 10), applying a stringent analysis to pinpoint key binding partners. We found two mRNAs (HMGN5, EIF5B) and one lncRNA (ANKDDA1) associated with lncMB3 (Figs. 4B and S6A). Notably, the mRNA for the nuclear factor HMGN5 (High Mobility Group Nucleosome Binding Domain 5) had the highest FC and the most significant FDR. Given the broad epigenetic role of HMGN5 in transcriptional regulation [30] and its interplay with lncMB3, it can be highlighted as a candidate for further analysis.
LncMB3 interacts with HMGN5 mRNA
The chromatin factor HMGN5 regulates gene expression by influencing nucleosome-DNA interactions [30, 31]. HMGN5 is ubiquitously expressed (Fig. S6B), with low expression in cerebellum, among brain tissues. RNA-Seq from the primary MB dataset GSE164677 showed a trend of HMGN5 upregulation in MB (Fig. 4C).
Co-enrichment of HMGN5 mRNA with lncMB3 was validated in additional pull-down assays (Fig. 4D). Upon nucleus/cytoplasm subcellular fractionation of D283 Med cell extracts, we also performed cytoplasmic native RNA pull-down assays and highlighted that lncMB3/HMGN5 interaction occurs in this compartment (Fig. S7A). IntaRNA predicted an interaction site (energy score: −30.1 kcal/mol) spanning ~120 nucleotides between lncMB3 5’ region (nt 189–307) and HMGN5 mRNA coding sequence (nt 933–1059) (Fig. 4E). This prediction was experimentally verified using 4′-aminomethyl-4,5′,8-trimethylpsoralen (AMT)-crosslinked RNA pull-down assays [28], which detect direct RNA-RNA pairings in vivo (Fig. 4F). Finally, digital PCR-based absolute quantifications showed stoichiometrically equivalent expression levels for lncMB3 and HMGN5 (Fig. S6C).
To assess the functional consequences of this interaction, we investigated lncMB3 influence on HMGN5 expression. HMGN5 mRNA levels remained unchanged following lncMB3 KD, as per RNA-Seq data (Dataset 1) and qRT-PCR (Fig. S8A). This is further confirmed in vivo by the lack of correlation between lncMB3 and HMGN5, according to the dataset GSE164677 (Spearman Coefficient 0.29). However, HMGN5 protein levels dropped by ∼80% upon lncMB3 KD (Fig. 4G), consistently with HMGN5 recognised oncogenic activity in various cancers [32, 33]. Restoring lncMB3 levels through transient exogenous expression of Δ16 construct after one pulse of KD (Fig. S8B), showed a 20% recovery of HMGN5 protein levels, indicating a specific and quantitative regulation of HMGN5 factor by lncMB3.
The impact of lncMB3 on HMGN5 protein and their RNA-RNA interaction indicates that the lncRNA acts as a translational activator. This was confirmed using a Ribo-Tag strategy [34] with transient FLAG-tagged 60S ribosomal protein L22 (RPL22) expression in D283 Med cells (Fig. S8C). Western blot analysis of FLAG-RPL22-precipitated fractions showed comparable protein levels in gap_SCR vs gap_lncMB3 extracts (Fig. S8D). At variance, qRT-PCR analysis revealed a marked decrease in HMGN5 mRNA association with ribosomes in the absence of lncMB3, compared to control (GAPDH, Fig. 4H). These results indicate that lncMB3 is required for HMGN5 mRNA ribosomal association.
HMGN5 regulates TGF-β pathway and apoptosis in G3 MB cells
Given the documented HMGN5 protein nuclear activity, we re-evaluated genes altered upon lncMB3 KD to assess if their expression changes were mainly transcriptional. qRT-PCR analysis was performed with exon-exon vs exon-intron junction primers to differentiate mature mRNAs from primary transcripts. As shown in Fig. S8E, lncMB3 silencing downregulated ACVR1B, INHBE, SMAD3, OTX2, NRL and CRX pre-mRNAs, highlighting a nuclear control over several genes regulated by lncMB3 (compare Figs. 1B, 1C, 2B and 3A).
HMGN5 role in suppressing apoptosis had not previously been assessed in MB. To functionally connect lncMB3 and HMGN5 activities, we aimed to mimic the molecular effects of lncMB3 KD by silencing HMGN5. Using VectorBuilder (https://en.vectorbuilder.com/), we designed a short interfering RNA targeting HMGN5. Transient transfections in D283 Med cells resulted in a ~ 30% downregulation of HMGN5 mRNA (Fig. 4I) and a ~ 60% reduction in protein levels (Fig. S8F). This led to a 20–50% RNA decrease for INHBE, SMAD3, OTX2 and BCL2L1 (Fig. 4I), targets also downregulated upon lncMB3 KD (see Figs. 1B, 1C, 2B and 3A), indicating that HMGN5 KD appreciably phenocopies lncMB3 molecular effects (Fig. S8G). Regarding cell death, HMGN5 KD caused a threefold increase in c-PARP1 protein (Fig. 4J, left panel) and a 30% decrease in full-length PARP1 (Fig. 4J, right panel). HMGN5 level reduction also mirrored a viable D283 Med cell number decrease, with a drop of ~ 30% (Fig. 4K), similar to the impact of lncMB3 targeting. These findings demonstrate that lncMB3 and HMGN5 participate into the same molecular and cellular phenotypes. Dependent on interactions with lncMB3, HMGN5 mRNA decreased translation contributes to the nuclear regulation of TGF-β pathway and downstream gene module in G3 MB cells.
LncMB3 inhibition synergizes with DDP treatment in G3 MB cells
DDP is a first-line anti-cancer agent and a cornerstone of MB treatment [35]. Combining therapies can reduce DDP side effects and fight both intrinsic and acquired resistance. Given the shared influence of lncMB3 and DDP on apoptosis-related pathways [36], we asked whether lncMB3 KD could amplify DDP cytotoxicity in G3 MB cells.
We first performed dose-response assays for each drug treatment (DDP or GapmeR #1), to evaluate their effect on the reduction of D283 Med cell viability (Fig. S9A). Based on these results, we then combine 10 μM DDP administration, with 100 nM GapmeR #1 and assessed the number of surviving cells (Fig. 5A, left panel). Normalising double-treated vs drug-untreated samples, cell counts revealed lower relative survival rate in gap_lncMB3-treated cells compared to scramble-transfected, indicating a synergistic effect between treatments (Fig. 5A, right panels). This finding was confirmed using an equivalent setup with 100 nM GapmeR # 2 (Fig. 5A, right panels). To further validate this effect, we conducted an apoptosis assay with Annexin V staining (Fig. 5B, left panel). Quantification of non-viable vs viable cells showed an increase of late apoptotic cell number compared to other populations upon combined treatments (Fig. 5B, middle panel), reinforcing the synergistic effect (Fig. 5B, right panel).Fig. 5. Analysis of lncMB3 KD/DDP treatment on D283 Med cell viability and apoptosis.A Left Panel: dose-response analysis of the number of viable D283 Med cells upon DDP treatment. Cells were treated with the vehicle (DMSO), 10 μM/mL DDP, untreated (NT) or treated with gap_SCR or gap_lncMB3 (GapmeR #1). N = 4, * p ≤ 0.05, (two-tailed Student’s t-test). Right Panel: Percentage of viable D283 Med cells following DDP administration and lncMB3 GapmeR transfection (GapmeR #1 or GapmeR #2). Double-treated samples (gap_SCR + DDP and gap_lncMB3 + DDP) were normalised on the viable cell number of the corresponding transfected-only sample (gap_SCR and gap_lncMB3, respectively). DDP concentration used was 10 μM. N = 4, * p ≤ 0.05 (two-tailed Student’s t-test). B Left panel: representative flow cytometry analysis of PI− and Annexin V-stained D283 Med cells following DDP administration [1 μM] and GapmeR #1 transfection 24 h after lncMB3 KD, with or without DDP treatment. Middle panel: quantification of viable (Annexin V−/PI−), early apoptotic (Annexin V+/PI−), late apoptotic (Annexin V+/PI+) and necrotic (Annexin V−/PI+) fractions. N = 3, * p ≤ 0.05 (comparison between early + late apoptotic cells). Right panel: percentage of viable D283 Med cells. Data normalisations as in (A). N = 3, * p ≤ 0.05 (two-way ANOVA). C qRT-PCR analysis of TGF-β pathway genes (left panel) and downstream pathway genes (right panel) in D283 Med cells treated for 24 h with DDP at different doses (reported on the x-axis). Control cells were treated with vehicle (DMSO) and set as 1. Data (means ± SEM) are expressed in arbitrary units and are relative to GAPDH mRNA levels. N = 3, * p ≤ 0.05, ** p ≤ 0.01, *** p ≤ 0.001 (two-tailed Student’s t-test).
To examine whether synergy relied on a crosstalk between treatments, we tested DDP administration consequences on lncMB3 target genes. A partial deregulation of both the TGF-β (Fig. 5C, left panel) and apoptotic pathway genes (Fig. 5C, right panel) was highlighted, similar to lncMB3 KD. LncMB3 expression remained unaffected by chemotherapy (Fig. S9B), suggesting the two treatments as independent triggers with overlapping outcomes.
The synergistic enhancement of anticancer effects was not indiscriminate. When GapmeR #1 was combined with Vincristine, another MB therapeutic drug [37] whose autonomous effects on D283 Med cells are reported in Fig. S9A, only additive, not synergistic effects were measured on viable cell counts (Fig. S9C) and apoptosis (Fig. S9D). To formally quantify all these drug interactions, we finally applied the Chou-Talalay method [38], calculating the Combinatorial Index (CI) between administration of GapmeR #1 and each of the two drugs. A synergistic effect (CI < 1) was confirmed with DDP, while an additive effect was validated with Vincristine (CI≈1) (Fig. S9E).
These data suggest that, in vitro, lncMB3 targeting potentiates DDP treatment effectiveness in reducing G3 MB cell proliferation and inducing apoptosis.
Production of the ferritin variant HFt-HIS-PASE
Targeting lncMB3 affects the TGF-β pathway, enhances apoptosis, and boosts chemotherapeutic efficiency in cancer cell lines. This led us to explore the use of human ferritin nanoparticles (NPs) to formulate innovative RNA/protein complexes aimed at lncMB3-directed GapmeR delivery. Human ferritin H-type (HFt) is a promising NP for drug delivery, particularly chemotherapeutics, due to its internalisation by the transferrin receptor 1 (CD71), frequently overexpressed in tumours [13, 39].
We designed and synthesized HFt-HIS-PASE, a recombinant ferritin variant derived from a prior HFt version, HFt-MP-PASE [40]. HFt-HIS-PASE contains a tumour-selective sequence (MP), responsive to tumour protease MMP-2 and -9 activities, and a shielding polypeptide (PASE) that enhances stability, masks the surface, and increases target specificity. Additionally, HFt-HIS-PASE features a five-histidine motif known to aid nucleic acid endosomal escape [41] (Fig. S10A).
Preliminary qRT-PCR assessments of MMP-2, MMP-9 and CD71 mRNA abundance in HD-MB03 and D283 Med cells (Fig. S10B) led to selecting the latter for further tests. We then evaluated the targeting capacity of a Fluorescein-5-Maleimide-labeled HFt-HIS-PASE nanovector (HFt-HIS-PASE-fluo). About 85% of D283 Med cells exposed to HFt-HIS-PASE-fluo (1 mg/mL) showed fluorescence signal 12 h post-administration, indicating the affinity of HFt-HIS-PASE for MB cells (Fig. 6A). Immunofluorescence assays performed 24 h later, using nuclear (DAPI) and cytoplasmic (Phalloidin) staining and confocal microscopy analysis, demonstrated intracellular uptake of HFt, with a nuclear-cytoplasmic distribution (Fig. 6B).Fig. 6. Synthesis, analysis and application of HFt-HIS-PASE/GapmeR complexes.A Left panel: representative image of colocalisation analysis between fluorescein-HFt-HIS-PASE and DAPI in D283 Med cells, 12 h after administration (magnification 20×). Fluorescein-HFt-HIS PASE (green) and DAPI (blue, nuclear staining) are on the left, object counts after binarisation are in the middle and the merge of the two channels is on the right. Right panel: percentage of colocalisation between fluorescein-HFt-HIS-PASE and DAPI in D283 Med cells. Data (mean ± SEM) were obtained from 8 different fields. B Left panel: representative immunofluorescence of fluorescein-HFt-HIS PASE delivered for 24 h (green), DAPI (blue, nuclear staining) and phalloidin (red, cytoplasmic staining) (magnification 60×). Right panel: percentage of nucleus/cytoplasm subcellular localisation of HFt-HIS PASE in D283 Med cells. Data (mean + SEM) were obtained from 5 different fields. C Band migration profiles on agarose gel electrophoresis. Gel was double-stained with SYBR Gold for GapmeR visualisation (left panel) and Coomassie Blue for ferritin visualisation (right panel). Lane 1: GapmeR standard 2 µM; Lane 3: GapmeR standard 1 µM; Lane 5: GapmeR standard 0.5 µM; Lane 6: HFt-HIS-PASE-GapmeR complex. D Size Exclusion Chromatography profile analysis of HFt-HIS-PASE (in black), HFt-HIS-PASE-GapmeR #1 complexes (in red) and GapmeR #1 alone (in blue). E qRT-PCR analysis of lncMB3 levels in D283 Med cells upon treatment with HFt-HIS-PASE-GapmeR #1 complexes, 48 h after delivery, compared with empty HFt-HIS-PASE, set as 1. Data (means ± SEM) are expressed in arbitrary units and are relative to GAPDH mRNA levels. N = 3, *** p ≤ 0.001 (two-tailed Student’s t-test). F qRT-PCR analysis of TGF-β pathway genes in D283 Med cells treated for 48 h with HFt-HIS-PASE-GapmeR #1 + 5 µM DDP. Expression levels were compared to HFt-HIS-PASE-empty + 5 µM DDP, set as 1. Data (means ± SEM) are expressed in arbitrary units and are relative to GAPDH mRNA levels. N = 3, * p ≤ 0.05, ** p ≤ 0.01 (two-tailed Student’s t-test). G Number of viable D283 Med cells treated for 48 h with HFt-HIS-PASE-GapmeR #1 + 5 µM DDP. HFt-HIS-PASE empty + 5 µM DDP was used as control. Data (means ± SEM) are expressed as the percentage of viable cells, counted by an automated cell counter. N = 4, ** p ≤ 0.01 (two-tailed Student’s t-test). Where necessary in the figure HFt-HIS-PASE is referred as HFt.
Analysis of HFt-HIS-PASE-GapmeR complexes and lncMB3 targeting
To evaluate lncMB3 targeting using HFt-ASO complexes, we generated and characterised HFt-HIS-PASE-GapmeR nucleoprotein particles. The lncMB3 GapmeR #1 was encapsulated in the internal cavity of HFt-HIS-PASE via pH-dependent HFt dissociation/reassociation. Successful GapmeR loading was confirmed by electrophoresis of purified HFt-HIS-PASE-GapmeR complexes. Distinct migration patterns for the complex compared to free GapmeR were observed. DNA-specific staining (Fig. 6C, left panel) displayed significant delay for nucleic acid when associated with HFt-HIS-PASE (lane HFt + gap), while protein-specific staining confirmed a co-migration profile between HFt-HIS-PASE-GapmeR complex and ferritin (Fig. 6C, right panel).
Regarding stability, no nucleic acid degradation was observed after 1 h and overnight incubations of HFt-HIS-PASE-GapmeR with DNA/RNA nuclease at 37 °C (Fig. S10C). No degradation was noted after 3 months of storage at 4 °C, indicating GapmeR encapsulation within the protein cavity, shielded from external exposure.
To evaluate GapmeR binding efficiency to HFt NPs, the relative intensities of agarose bands corresponding to DNA or protein were quantified. Comparisons were made with free GapmeR and HFt-HIS-PASE molecules at standard concentrations. The final GapmeR/HFt-HIS-PASE molecular ratio was 0.5:1. Purity and hydrodynamic volume of HFt-HIS-PASE-GapmeR were determined by size-exclusion chromatography, showing similar elution volume and size to non-encapsulated HFt-HIS-PASE protein, with no free GapmeR detected, indicating co-elution with ferritin (Fig. 6D).
The biological activity of the complex was tested in D283 Med cells treated with a single dose of HFt-HIS-PASE alone or GapmeR-complexed (200 nM). Steady-state lncMB3 levels, 48 h post-treatment, showed a 30% reduction with encapsulated GapmeR #1 compared to mock-treated cells (Fig. 6E). Similar outcomes were obtained with HFt-HIS-PASE-GapmeR stored at 4 °C for 3 months, replicating the effects of a standard, single-pulse GapmeR #1 transfection at 100 nM for 48 h (Fig. S10D). No modulation of TGF-β pathway gene expression, cell proliferation reduction, or apoptosis increase was registered under these conditions, probably due to insufficient lncMB3 downregulation. However, to further investigate HFt-HIS-PASE-mediated cellular effects of lncMB3 targeting, we leveraged our findings on the synergy between lncMB3 KD and DDP administration. D283 Med cells were treated with 5 μM DDP alone or in combination to HFt-HIS-PASE-GapmeR. Combined treatments led to a 20–50% reduction in TGF-β pathway and downstream genes (Fig. 6F), as revealed by qRT-PCR analysis. A decrease in cancer cell survival was also observed, compared to DDP treatment alone (Fig. 6G), consistent with earlier data (Fig. 5A), indicating that HFt-based NPs are effective for lncMB3 targeting and sensitising G3 MB cells to anticancer drugs.
Discussion
Integrated multi-omics has combined molecular genetic with histological analyses within a framework to illuminate MB inherent heterogeneity and complexity [1]. Despite unique genomic, biochemical and clinical traits in each MB subgroup [42], therapies still rely on general interventions—surgical resection, chemotherapy and radiotherapy—with 5-year survival rates of 60%–80% [43]. This underscores the need for targeted therapies and deeper explorations of dysfunctional pathways, particularly in high-risk and poorly characterised subgroups, like G3 and G4. G3 MB, representing 25% of cases, exhibits the highest recurrence and metastasis rate, correlating with worse outcomes [44]. The discovery of MYC amplification/overexpression as a major G3 MB pathogenic factor [45, 46] aligns with estimates of aberrant MYC activity in 70% of human cancers [46]. Yet, targeting MYC has long been challenging due to its disordered structure, leading to low-potency therapeutic candidates, with suboptimal pharmacological properties and considerable off-target effects [47]. Furthermore, MYC plays a critical role in physiological processes including differentiation, proliferation, and cell cycle regulation, which are central to development and post-natal life. This makes it essential to develop strategies for MYC inhibition, particularly in paediatric cancers. Several pre-clinical studies and clinical trials are investigating direct MYC inhibitors [47, 48], like OMOMYC, a dominant-negative showing promise in solid cancers [10, 48], that we used to map the MYC transcriptome in G3 MB cells [10]. Indirect strategies targeting MYC cofactors or regulators are valuable alternatives and, along this direction, understanding MYC-dysregulated gene pathways, including non-coding RNA networks, may diversify and improve opportunities for MYC-targeted therapies [49].
Over the past two decades, the rise of non-coding RNAs has reshaped cancer biology [50]. LncRNAs have gained attention as cancer hallmark modulators for their tissue- and cell-specific expression and their structural flexibility, making them attractive biomarkers and molecular targets. However, their potential as biological master regulators require detailed functional characterisation.
To date, only few lncRNAs have been mechanistically described in G3 MB. This study clarifies the role of MYC-regulated lncMB3 in G3 medulloblastomagenesis, establishing a foundation for its potential application. LncMB3 is upregulated in G3 MB cell lines and primary tumours, playing a pivotal role in cell death evasion in vitro. Through transcriptomic, molecular and cellular assays, we show that lncMB3 regulates the TGF-β cascade, crucial for G3 MB pathology, impacting cancer cell proliferation and survival [11]. Notably, we identified lncMB3 target gene cluster in this pathway, whose misregulation elevates the retinal TF OTX2, an oncogenic driver in G3 MB that boosts cell proliferation, suppresses apoptosis, and contributes to tumour aggressiveness [51]. OTX2 and other photoreceptor TFs, including NRL and CRX, drives anti-apoptotic factors like BCL2L1 [23], linking this gene program to sustained cancer cell viability. LncMB3 activity orchestrates key pathways, genes, and processes in G3 MB, forming a nexus among MYC driver gene, TGF-β signalling, photoreceptor gene network, and apoptosis regulation. This interconnection offers an integrated framework for understanding the molecular underpinnings of this tumour subgroup.
While our coding transcriptome analysis provided insights into lncMB3 function, its interactome revealed its mode of action. LncMB3 directly interacts with HMGN5 mRNA, encoding an epigenetic regulator within the HMGN nucleosome-binding and nuclear architecture family, involved in extensive chromatin decondensation and transcriptional regulation [32, 33]. HMGN5, implicated in embryonic gene regulation [52] and exhibiting oncogenic properties in several cancers [32, 33], shows a tendency toward upregulation in MB. Our findings suggest that functional RNA-RNA interactions between coding and non-coding molecules—an emerging theme in cancer regulation—upregulate HMGN5 protein levels, explaining why HMGN5 RNA interference phenocopies lncMB3 targeting effects. Given that several lncMB3 targets are dysregulated in the nucleus, where HMGN5 protein operates, this mechanism adequately accounts for the observed molecular and cellular phenotypes, though additional regulative cascades or secondary effects could exist, consistent with multifunctional scaffolding properties and diverse subcellular localisation of lncRNAs. Owing to its molecular features—ranging from dual nucleocytoplasmic distribution to chromatin-independent regulatory activity—lncMB3 can be regarded as a trans-acting lncRNA. Along this line, lncMB3/HMGN5 co-expression confined to pathological cerebellum suggests their interaction as a platform for developing novel inhibitors competing out disease-specific complexes.
Due to G3 MB aggressive nature and treatment resistance, integrated therapies promise solutions. ASOs have gained prominence in RNA-based treatments for their design flexibility and pharmacological properties [50]. Our analysis of lncMB3-targeting LNA GapmeRs combined with standard MB chemotherapy demonstrated synergistic interplay, enhancing drug cytotoxicity. This effect likely stems from both treatments acting on the intrinsic apoptotic pathway [36] and the TGF-β cascade (this study). These findings suggest modulating the lncMB3 molecular network to amplify anticancer agent efficacy, to support RNA-based combinatorial strategies to reduce tumour resistance and to improve G3 MB treatment outcomes. However, a major challenge in RNA therapies is ensuring efficient effector delivery to intended sites. We explored application of HFt-based nanocarriers for deploying LNA GapmeRs targeting lncMB3. HFt properties, from high biocompatibility and stability to low toxicity and cost-effectiveness, make it a powerful drug delivery system [13]. Moreover, HFt capacity to cross the blood-brain barrier [13] positions it as a promising tool for brain tumour therapies. Its symmetrical self-assembly, small and uniform size, and versatile surface functionalisation are ideal for bioactive compound delivery, including small nucleic acids. While siRNAs [53] and microRNAs [54] have already been delivered by HFt, this study is the first, to our knowledge, to employ HFt-encapsulated ASOs for gene silencing. Combinatorial administration of lncMB3-targeting NPs and DDP replicated the synergistic effects observed with ASO transfection, impacting the TGF-β pathway and reducing cell survival. These results indicate that HFt-based strategies have potential for targeting oncogenic pathways at the RNA level via biocompatible delivery of tumour-specific antisense oligomers.
In conclusion, this study highlights the critical role of lncMB3 in G3 MB apoptosis regulation through TGF-β pathway modulation and interaction with underexplored genes, such as HMGN5. LncMB3 stands out as a key regulatory node linking MYC amplification to enhanced tumour cell survival via cell death inhibition (Fig. 7). Future efforts will focus on deeper exploration of lncMB3 interactions and regulatory mechanisms-of-action, as well as validating its therapeutic potential in preclinical G3 MB models using the HFt nanocarriers.Fig. 7. Regulatory circuit.Schematic representation of the MYC-dependent lncMB3 mechanism of action. Image made with Biorender (https://biorender.com).
Materials and Methods
All cell lines were obtained from ATCC and cultured as previously described [10]. Evaluation of viable cell number was assessed after cell manipulations by CytoSMART Cell Counter. Gene silencing or overexpression were realised transfecting antisense LNA GapmeRs or plasmid constructs by Lipofectamine 2000 as per manufacturer’s instructions. Expression of specific RNAs was performed by standard qRT-PCR of digital PCR. TruSeq Stranded mRNA Library Prep Kit was used to obtain sequencing libraries from polyA+ RNA. RNA-Seq analyses were performed by conventional R package DESeq2 (Bioconductor), Gene Ontology and Gene Set Enrichment Analysis. Protein expression was assessed by conventional immunoblotting, detected by ChemiDoc XRS+ Molecular Imager and quantified through the Image Lab Software. Chemotherapeutics (cisplatin, Vincristine) were administered at different concentrations according to the specific experimental plan, eventually in combination with GapmeR transfection. Apoptosis was analysed by determination of Annexin V-FITC/PI staining through flow cytometry. Data were analysed using the Flowing software. Alternatively, cell death markers were analysed by immunoblot assay. For Crosslinked Immunoprecipitation assay, cytoplasmic extracts were incubated with AGO2 antibody or IgG and coupled to Protein G Dynabeads resin. Immunoprecipitated proteins were collected in RIPA buffer and analysed. Immunoprecipitated RNA was treated by Proteinase K before qRT-PCR. RNA Pull Down experiments were performed as described in [28] from endogenous cell extracts using separate sets of antisense biotinylated probes binding to streptavidin Magnasphere paramagnetic beads. Pull Down-Seq analysis were performed through edgeR to quantify significant genes, using a generalised linear model. RNA-RNA interaction prediction was computed using IntaRNA 3.3.2, whereas TargetScan Human database was exploited to obtain candidates microRNAs. Ribotagging and RNA Immunoprecipitation was performed as described in [34], exploiting exogenous expression of a FLAG-tagged version of the RPL22 protein for enriching the ribosomal fraction from cell lysates. HFt-HIS-PASE was obtained as a recombinant protein considering codon optimisation for high expression levels in E. coli. BL21 (DE3) strain. Size-exclusion chromatography experiments were performed using a Superose 6 gel-filtration column. The HFt-HIS-PASE protein was incubated with Fluorescein-5-Maleimide for fluorescent labelling. Electrophoresis on agarose gel of the purified HFt-GapmeR complexes was used to demonstrate GapmeR loading. For nucleocytoplasmic staining, fluo-HFt targeted cells were fixed in paraformaldehyde, permeabilised and blocked with Triton ×-100/BSA/PBS. Fixed cells were incubated with Alexa Fluor™ 555 Phalloidin and DAPI solution. For confocal microscopy experiments, samples were imaged using an Olympus iX83 FluoView1200 laser scanning confocal microscope. The Fiji “Analyse Particles” tool was employed for cell counts, whereas signal co-localisation was analysed using the “JACoP” Fiji plugin. HFt-ASO complexes were directly administered to cells, according to the specific experimental plan. Oligonucleotide, probe and GapmeR sequences are listed in Dataset 5. For detailed technical descriptions, see “Supplementary Materials and Methods”.
Supplementary information
Supplementary Figures and legends Supplementary Materials and Methods Uncropped wb dataset 1 dataset 2 dataset 3 dataset 4 dataset 5 dataset 6 dataset 7 dataset 8 dataset 9 dataset 10