The deubiquitinase USP17LA negatively regulates T-cell activation and attenuates anti-tumor immunity
Huiling Zhang, Zhihan Guo, Gaigai Wei, Jingjing Yi, Zixi Wang, Yuqi Zhang, Haiping Zhao, Tingrong Ren, Yihan Wang, Jiating Kuang, Zhaoying Sheng, Duanwu Zhang

TL;DR
This study identifies USP17LA as a negative regulator of T-cell activation and shows that its loss enhances anti-tumor immunity in mice.
Contribution
The study reveals USP17LA as a novel negative regulator of T-cell activation and a potential target for cancer immunotherapy.
Findings
USP17LA-deficient T cells show increased cytokine production and anti-tumor activity in murine models.
USP17LA interacts with RACK1 to suppress NFAT signaling, inhibiting T-cell function.
Deleting Usp17la improves TCR signaling and tumor surveillance without affecting T-cell development.
Abstract
T-cell activation is essential for effective immune responses, yet its precise regulatory mechanisms remain incompletely understood. In this study, we show that the deubiquitinases of the Ubiquitin-Specific Peptidase 17-like (USP17L) family are significantly upregulated following T-cell stimulation. Using CRISPR-mediated gene knockout mice, we demonstrate that USP17LA, but not USP17LB, acts as a negative regulator of T-cell activation. Loss of Usp17la leads to increased production of pro-inflammatory cytokines, enhanced T-cell proliferation and effector functions, without affecting T-cell development or homeostasis. Furthermore, Usp17la deletion augments TCR signaling and anti-tumor immunity, improving T-cell-mediated tumor surveillance in murine tumor models. Mechanistically, proteomic analysis revealed that USP17LA strongly associates with cadherin-binding and calmodulin-binding…
Genes, proteins, chemicals, diseases, species, mutations and cell lines named across the full text — each resolved to its canonical identifier and authoritative record.
Click any figure to enlarge with its caption.
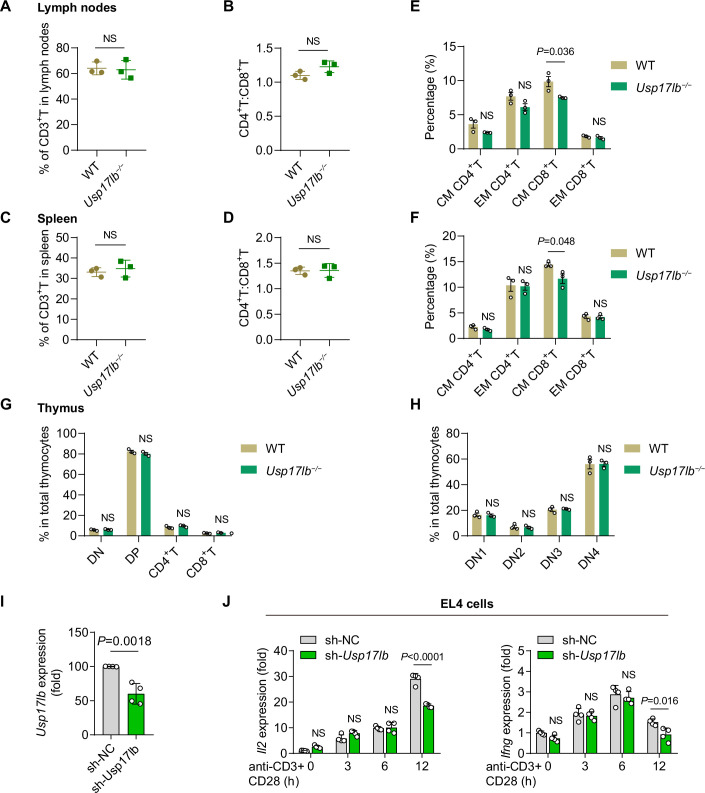 Figure 10
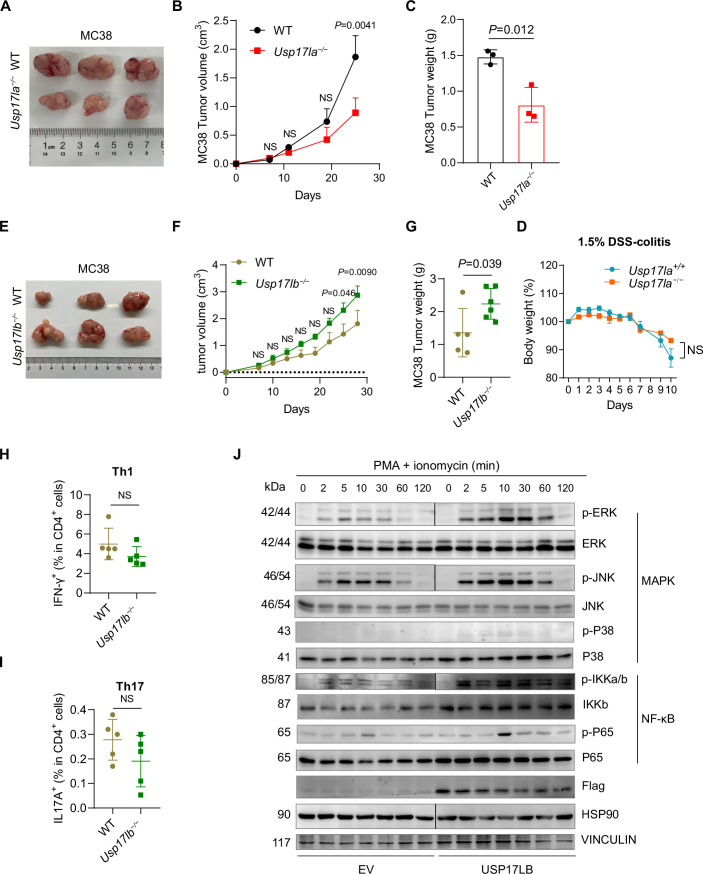 Figure 11
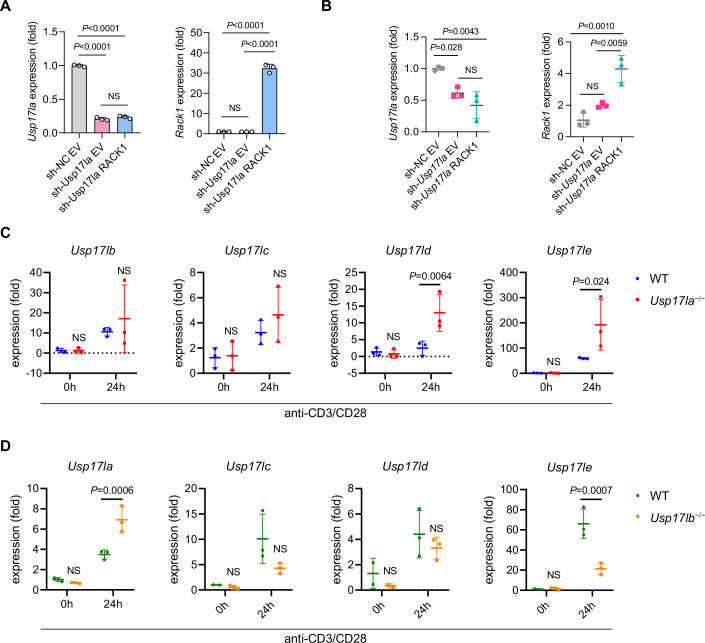 Figure 12
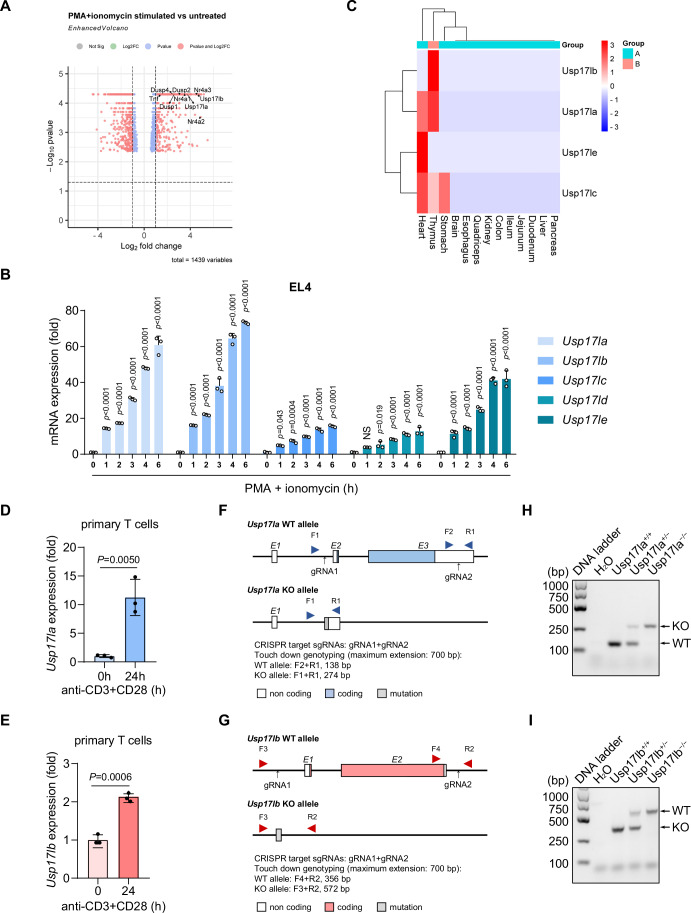 Figure 1
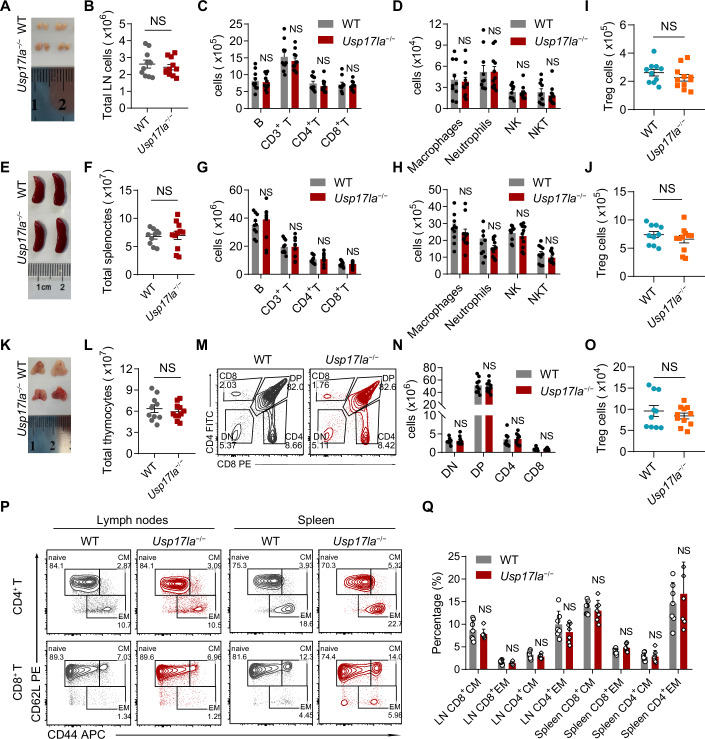 Figure 2
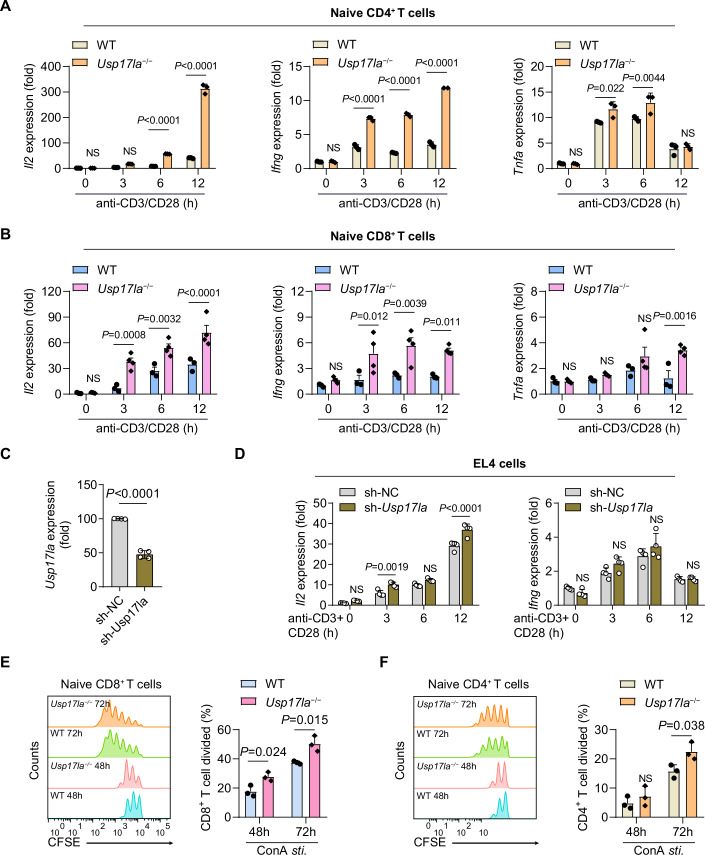 Figure 3
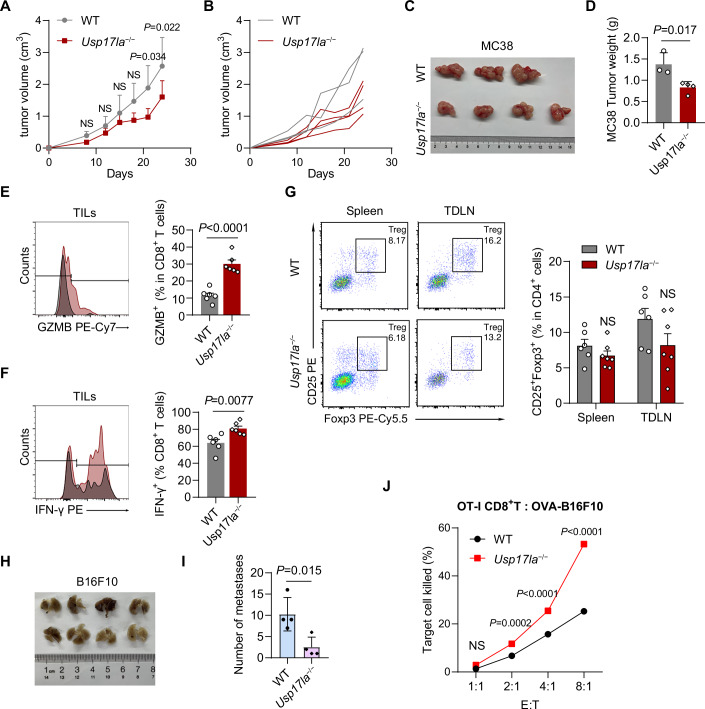 Figure 4
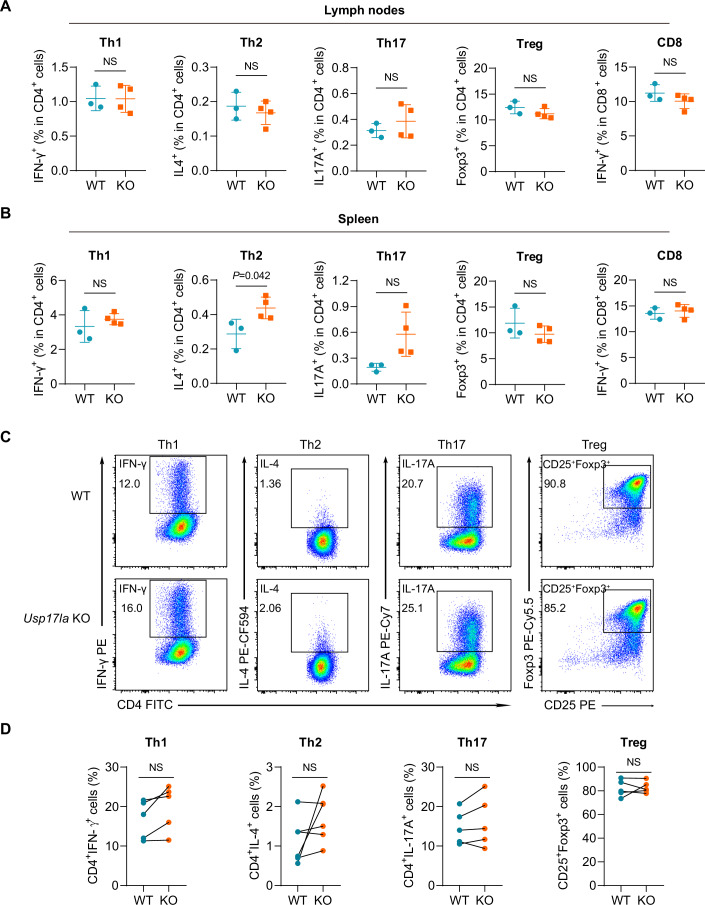 Figure 5
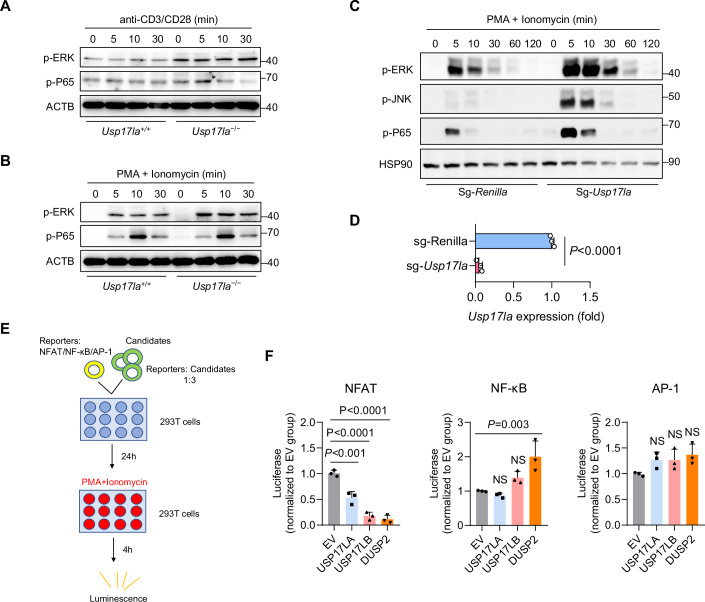 Figure 6
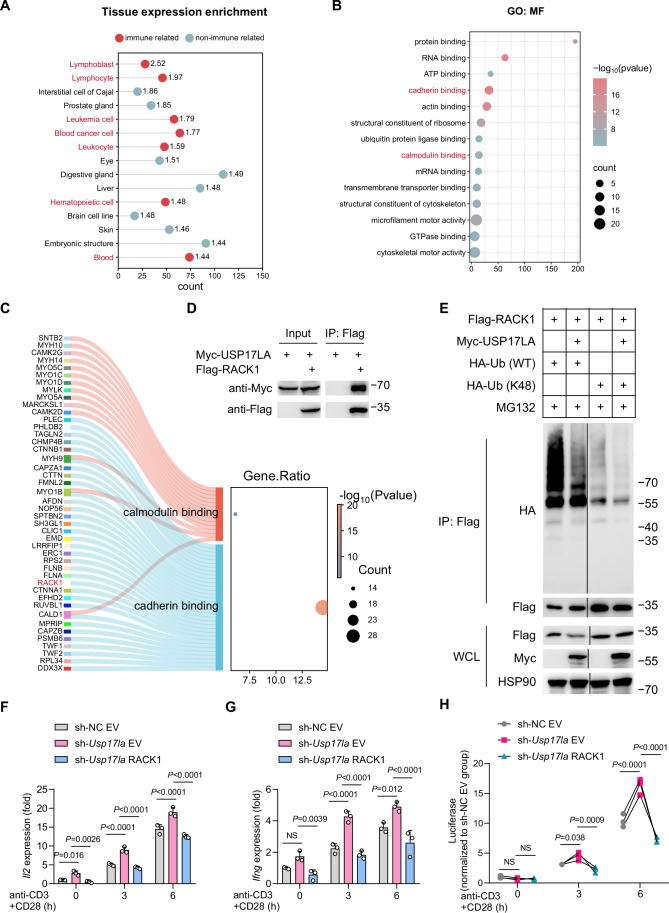 Figure 7
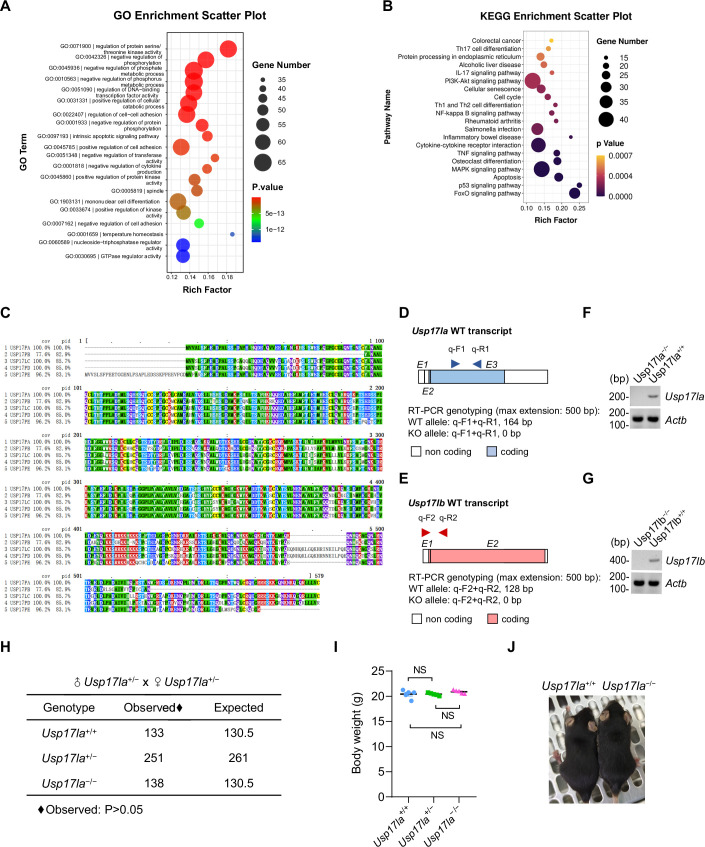 Figure 8
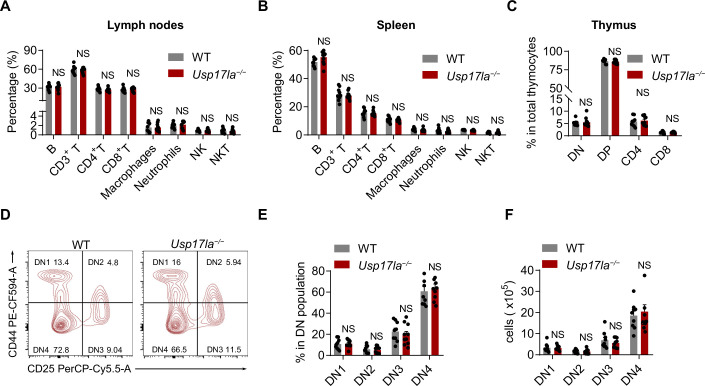 Figure 9
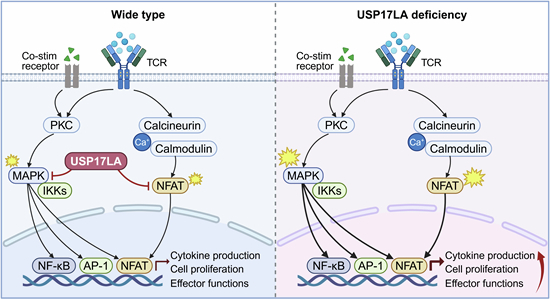 Figure 13
 Figure 14
- —http://dx.doi.org/10.13039/501100001809MOST | National Natural Science Foundation of China (NSFC)
- —http://dx.doi.org/10.13039/501100003399Science and Technology Commission of Shanghai Municipality (STCSM)
Peer Reviews
No public reviews on file for this paper yet. If you reviewed it on a platform where reviews are public (OpenReview, ICLR, NeurIPS, ICML), you can paste yours below so the community can read it here.
Videos
No videos yet. Explain this paper in a talk, walkthrough, or lecture? Add one.
Taxonomy
TopicsUbiquitin and proteasome pathways · Genetics and Neurodevelopmental Disorders · Autophagy in Disease and Therapy
Introduction
T-cell activation is a fundamental process in the immune system, playing a pivotal role in maintaining immune homeostasis and defending against infections and malignancies (Kishton et al, 2017). Upon encountering antigens, T cells undergo a series of signaling events that lead to their proliferation, differentiation, and effector functions (Sun et al, 2023). Precise regulation of T-cell activation is essential, as dysregulation can result in immune dysfunction, including autoimmunity, immunodeficiency, or impaired anti-tumor immunity. Although many molecular components involved in T-cell activation have been identified (Chapman et al, 2020), the precise mechanisms underlying this process remain incompletely understood. Further investigation is required to identify additional regulatory factors that govern T-cell activation.
Deubiquitinating enzymes (DUBs) remove the Ub/UBL from modified proteins, reversing the effects of ubiquitin modifications (Patel et al, 2023a). Dysregulation of DUBs disrupts the dynamic equilibrium of the ubiquitome and causes various diseases, especially cancer and immune disorders (Li and Reverter, 2021). Among them, the Ubiquitin Specific Proteinase (USP) family is the largest subfamily of deubiquitinases, and its members have been widely reported to participate in T-cell activation (Ren et al, 2023). USP15 has been reported to inhibit anti-tumor T-cell responses through stabilizing MDM2 (Zou et al, 2014). USP8 has been reported to be critical for T-cell development and homeostasis by securing maturation and Foxo1-mediated upregulation of IL-7Rα (Dufner et al, 2015). Besides, A20, OTUB1, and OTUD2B were reported to be associated with T-cell activation (Düwel et al, 2009; Hu et al, 2016; Zhou et al, 2019). In this context, we noted that the USP17L family, which acts as a poor survival predictor in GVHD patients (Patel et al, 2023b) and is elevated in EL4 cells upon stimulation with PMA plus ionomycin, has not been studied in T cells.
Calcium signaling is essential for T-cell activation, with calmodulin (CaM) acting as the primary calcium sensor that orchestrates downstream effectors (Trebak and Kinet, 2019). Following T-cell receptor (TCR) engagement, calcium influx induces conformational changes in CaM, facilitating its interaction with key targets such as calcineurin and CaMKII. Calcineurin dephosphorylates nuclear factor of activated T cells (NFAT), promoting its nuclear translocation and cytokine transcription (e.g., IL-2, IFN-γ) (Macian, 2005). While calcium-related regulators remain to be fully elucidated, RACK1 knockdown has been reported to enhance antigen-induced calcium mobilization in mast cells (Filho et al, 2021). Moreover, RACK1 inhibits NFAT activity (Han et al, 2002), suggesting that its regulation modulates the calcium-NFAT signaling axis.
Here, we utilized Usp17la-deficient mice to demonstrate that Usp17la deficiency does not affect T-cell development in the thymus or peripheral lymphoid organs. However, loss of Usp17la specifically enhances T-cell activation by promoting TCR signaling. Mechanistically, USP17LA interacts with calcium-related pathway proteins and facilitates NFAT activation by mediating the ubiquitin-dependent degradation of RACK1. RACK1 overexpression inhibits excessive cytokine production caused by USP17LA depletion. Furthermore, Usp17la deficiency suppresses tumor growth and enhances T-cell anti-tumor efficacy. These findings reveal a previously unrecognized role of USP17LA as a negative regulator of T-cell activation.
Results
USP17-like deubiquitinases are significantly induced during T-cell activation
To identify new regulators involved in T-cell activation, we analyzed our previous RNA sequencing data from PMA and ionomycin-stimulated EL4 cells (Zhang et al, 2019). RNA-sequencing analysis revealed 982 differentially expressed genes (DEGs), including 536 upregulated and 446 downregulated genes (Fig. 1A). Among the upregulated genes, negative regulators of TCR signaling, such as Nr4a1, Nr4a3, Dusp2, and Dusp6, were significantly increased (Bertin et al, 2015; Chen et al, 2019; Dan et al, 2020; Hsu et al, 2018; Liu et al, 2019). Notably, members of the deubiquitinating enzyme (DUB) family, including Usp17la, Usp17lb, Usp17ld, and Usp17le, were also upregulated (Fig. 1A), suggesting their potential role in modulating T-cell activation. Gene ontology (GO) enrichment and KEGG pathway analyses of the upregulated DEGs highlighted pathways related to protein phosphorylation, cell adhesion, catabolic processes, and immune signaling, such as IL-17, NF-κB, and MAPK pathways, among the top 20 enriched pathways (Fig. EV1A,B).Figure 1USP17LA and USP17LB are potential regulatory factors for T-cell activation.(A) Volcano plot analysis of differentially expressed genes in PMA plus ionomycin stimulated EL4 cells versus untreated EL4 cells by RNA-seq analysis. The x axis represents log_2_ of fold change of expression of these genes in the PMA plus ionomycin group compared to the untreated group, and the y axis represents −log_10_ P value. Data were obtained from our previous study (Zhang et al, 2019) and re-analyzed using the online bioinformatic platform (https://www.bioinformatics.com.cn). Differential expression was calculated with Cuffdiff v2.1.1 (n = 2 per group). (B) RT-qPCR analysis of the mRNA levels of Usp17la, Usp17lb, Usp17lc, Usp17ld, Usp17le in EL4 cells upon stimulation with PMA plus ionomycin for the indicated times, quantification was determined by using 2^−ΔΔCt^ methods (n = 3 per group). (C) Clustering analysis heatmap of Usp17l-family expression across various mouse tissues, with the immune-related tissues highlighted (pink group). Data were sourced from a previous study (Söllner et al, 2017) and analyzed using the same bioinformatic platform. (D, E) RT-qPCR analysis of Usp17la and Usp17lb mRNA levels in primary T cells upon stimulation with anti-CD3 and anti-CD28 for 24 h or not (n = 3, respectively). (F, G) Schematic diagram of the CRISPR/Cas9-mediated gene targeting strategy to generate Usp17la^−/−^ and Usp17lb^−/−^ mice, including the genotyping strategy for confirming targeted deletion. (H) Representative PCR genotyping results of Usp17la^+/+^, Usp17la^+/−^, and Usp17la^−/−^ alleles using genomic DNA isolated from tail biopsies. (I) Representative PCR genotyping results of Usp17lb^+/+^, Usp17lb^+/−^, and Usp17lb^−/−^ alleles using genomic DNA isolated from tail biopsies. Data are representative of three independent experiments (B,** D**,** E**,** H**,** I**). Data are shown as mean ± s.d. Statistical analyses were performed using two-way ANOVA followed by Dunnett’s multiple comparisons test (B) and unpaired, two-tailed Student’s t test (D,** E**). NS not significant. Source data are available online for this figure.
Given the critical role of DUBs in regulating protein function, the Usp17-like family members may provide mechanistic insights into immune modulation. Then, we validated the expression profiles of the identified genes in EL4 cells following PMA and ionomycin stimulation. Compared to control cells, the mRNA levels of all identified genes were significantly increased in a time-dependent manner (Fig. 1B). Tissue expression analysis further revealed that these DUBs were highly enriched in the thymus and heart (Fig. 1C), implicating them in T-cell development, activation, and heart homeostasis. Due to their high sequence similarity (Fig. EV1C), USP17L family members may be functionally redundant and complex. Based on their pronounced expression in the thymus and in PMA-stimulated EL4 cells, Usp17la and Usp17lb were selected for further investigation. Their upregulation was confirmed in primary T cells stimulated with anti-CD3 and anti-CD28 antibodies (Fig. 1D,E).
Then, we generated Usp17la^−/−^ and Usp17lb^−/−^ mice using the CRISPR/Cas9 strategy to facilitate further investigation (Fig. 1F,G). Genotypes of these knockout mice were confirmed by tail DNA genotyping (Fig. 1H,I) and RT-PCR of spleen T-cell mRNA (Fig. EV1D–G), validating gene deletion at both DNA and mRNA levels. Due to the high amino acid sequence similarity among USP17L family proteins, we were unable to generate USP17LA- and USP17LB-specific antibodies, which prevented us from detecting the effects of USP17LA and USP17LB deletion in mice at the protein level. The mice were born in accordance with Mendelian inheritance laws and exhibited no significant differences in weight or appearance compared to their wild-type (WT) counterparts (Fig. EV1H–J). In summary, USP17LA and USP17LB are identified as DUBs upregulated during T-cell activation, suggesting their roles in immune regulation.
Usp17la deficiency does not affect T-cell homeostasis or development
We then examined whether Usp17la or Usp17lb deficiency affects T-cell homeostasis. Ablation of Usp17la did not alter the size or cellularity of inguinal lymph nodes (Fig. 2A,B). Detailed analysis of immune cell subpopulations in lymph nodes revealed no significant differences in the absolute numbers or proportions of B cells, CD3^+^ T cells, CD4^+^ T cells, CD8^+^ T cells, macrophages, NK cells, or NKT cells in Usp17la^−/−^ mice compared to WT controls (Figs. 2C,D and EV2A). Similarly, the size, total cellularity, and composition of immune subsets in the spleen were comparable between genotypes (Figs. 2E–H and EV2B). Regulatory T-cell (Treg) frequencies in both spleen and lymph nodes were also unaffected (Fig. 2I,J). Along with unchanged T-cell number in the periphery, T-cell development in the thymus remained intact in Usp17la^−/−^ mice, as evidenced by normal thymic morphology, thymocyte counts, and thymocyte subpopulations based on CD4 and CD8 expression (Figs. 2K–N and EV2C). Further analysis of early thymocyte development revealed no significant differences in DN subpopulations (DN1−DN4), defined by CD44 and CD25 expression, between Usp17la^−/−^ and WT mice (Fig. EV2D–F). Moreover, Treg development in the thymus was also unaffected in Usp17la^−/−^ mice (Fig. 2O).Figure 2Usp17la ablation does not affect peripheral T-cell homeostasis or thymic T-cell development.(A–D) Inguinal lymph nodes from 2-month-old WT and Usp17la^−/−^ mice were isolated and analyzed by organ size (A), organ cell numbers (B), and absolute number of various immune cell types (C, D) (n = 10–11 per genotype). (E–H) Spleens from 2-month-old WT and Usp17la^−/−^ mice were isolated and analyzed by organ size (E), organ cell numbers (F), and absolute number of various immune cell types (G,** H**) (n = 10–11 per genotype). (I, J) Flow cytometric quantification of Foxp3⁺ CD4⁺ Treg cells in the lymph nodes and spleen of WT and Usp17la^−/−^ mice (n = 10–11 per genotype). (K–O) Thymuses from 2-month-old WT and Usp17la^−/−^ mice were isolated and analyzed by organ size (K), organ cell numbers (L), representative flow cytometry plots (M), absolute number of DN, DP, CD4 SP, CD8 SP subpopulations (N), and absolute number of Treg cells (O) (n = 10–11 per genotype). (P, Q) Flow cytometry analysis of the expression of CD44 and CD62L in CD4^+^ and CD8^+^ T cells from lymph nodes and spleens of WT and Usp17la^−/−^ mice (n = 7 per genotype). Representative flow cytometry plots (P) and quantification (Q) are shown. Data are a combination of two independent experiments (A–Q). Data are shown as mean ± s.d. Statistical analyses were performed using unpaired, two-tailed Student’s t test (B,** F**,** I**,** J**,** L**, O) and two-way ANOVA followed by Sidak’s multiple comparisons test (C,** D**,** G**,** H**,** N**, Q). NS not significant. Source data are available online for this figure.
We also assessed the activation status of peripheral T cells by analyzing CD44 and CD62L expression, which allowed for the classification of T cells into naive, central memory, and effector memory subpopulations. No significant differences were observed between Usp17la^−/−^ and WT mice (Fig. 2P,Q). Overall, these findings indicate that Usp17la deficiency does not significantly affect T-cell development or peripheral homeostasis.
Similarly, Usp17lb ablation had no effect on T-cell percentages or the CD4^+^/CD8^+^ ratio in lymph nodes or spleen (Fig. EV3A–D). In contrast to the unchanged activation status observed in Usp17la^−/−^ mice, CD8⁺ T cells in Usp17lb^−/−^ mice exhibited a decreased proportion of central memory cells in both the lymph nodes and spleen (Fig. EV3E,F). Analysis of thymocyte subpopulations, defined by CD4 and CD8 expression, and DN subpopulations, defined by CD44 and CD25, revealed no significant differences between Usp17lb^−/−^ and WT mice, indicating no apparent changes in thymocyte development (Fig. EV3G,H). In summary, Usp17lb deficiency does not appear to have any significant effect on T-cell development and homeostasis.
USP17LA restrains T-cell activation and expansion
The induced expression of Usp17la and Usp17lb in primary T cells following TCR engagement suggested their involvement in T-cell activation. To assess the role of USP17LA in this process, we performed in vitro activation studies using anti-CD3 and anti-CD28 antibodies. Our results revealed that Usp17la^−/−^ naive CD4⁺ T cells exhibited significantly higher production of IL-2, IFN-γ, and* TNF-α* at various time points following stimulation (Fig. 3A). Similarly, Usp17la^−/−^ naive CD8^+^ T cells exhibited augmented effector function, as evidenced by increased production of IL-2, IFN-γ, and TNF-α (Fig. 3B). In EL4 cells, Usp17la knockdown upregulated IL-2 and IFN-γ levels upon TCR engagement (Fig. 3C,D), while Usp17lb knockdown had the opposite effect when stimulated for 12 h (Fig. EV3I,J). These findings suggest that USP17LA negatively regulates the activity of both CD4^+^ and CD8^+^ T cells.Figure 3Usp17la deletion promotes activation and expansion of T cells.(A) RT-qPCR analysis of the expression of Il-2, Ifng, and Tnfα in WT and Usp17la^−/−^ CD4^+^ T cells upon stimulation with anti-CD3 plus anti-CD28 for the indicated times (n = 3 per genotype). (B) RT-qPCR analysis of the expression of Il-2, Ifng, and Tnfα in WT and Usp17la^−/−^ CD8^+^ T cells upon stimulation with anti-CD3 plus anti-CD28 for the indicated times (n = 3–4 per genotype). (C) RT-PCR analysis of Usp17la knockdown efficiency in EL4 cells following infection with sh-NC or sh-Usp17la lentivirus (n = 4 per group). (D) RT-PCR analysis of the expression of Il-2 and Ifng in EL4 cells infected with sh-NC or sh-Usp17la lentivirus following anti-CD3 plus anti-CD28 stimulation for the indicated times (n = 4 per group). (E, F) Flow cytometry analysis of the proliferation of naive CD8^+^ and CD4^+^ T cells purified from the spleen of WT and Usp17la^−/−^ mice following stimulation with ConA for the indicated time periods. The cell division percent was measured by CFSE dilution (n = 3 per genotype). Data are representative of two independent experiments (A–F). Data are shown as mean ± s.d. Statistical analyses were performed using two-way ANOVA followed by Sidak’s multiple comparisons test (A,** B**, D) and unpaired, two-tailed Student’s t test (C,** E**,** F**). NS not significant. Source data are available online for this figure.
Consistent with these observations, Usp17la^−/−^ CD4^+^ and CD8^+^ T cells showed significantly higher proliferation in response to Concanavalin A (ConA) stimulation, with the percentage of divided cells increasing by ~50% (Fig. 3E,F). In summary, USP17LA acts as a negative regulator of T-cell activation and expansion by restraining effector function and proliferation in both CD4^+^ and CD8^+^ T cells.
Usp17la deficiency enhances T-cell-mediated anti-tumor immunity
Given that Usp17la deficiency enhanced T-cell activity, it was critical to explore its physiological implications under pathological conditions. To this end, we first utilized the MC38 murine colon cancer model to evaluate the anti-tumor effects of Usp17la^−/−^ mice. Compared to WT controls, Usp17la^−/−^ mice exhibited significantly reduced tumor progression and smaller tumor sizes (Figs. 4A–D and EV4A–C), suggesting that USP17LA functions as a negative regulator of anti-tumor responses. Further analysis of tumor-infiltrating lymphocytes (TILs) isolated from MC38 tumors revealed that Usp17la deficiency increased granzyme B (GZMB) and IFN-γ production by cytotoxic CD8^+^ T cells (Fig. 4E,F). Moreover, the frequency of Treg cells in tumor-draining lymph nodes and spleen remained unchanged in Usp17la^−/−^ mice (Fig. 4G). These data indicate that Usp17la deficiency can enhance anti-tumor immunity against MC38 solid tumors.Figure 4Usp17la deficiency enhances T-cell anti-tumor immunity.(A–D) Tumor growth was assessed in terms of the tumor volume (A,** B**), tumor size (C), and tumor weight (D) in WT and Usp17la^−/−^ mice after MC38 colon cancer cells inoculation (WT, n = 3; Usp17la^−/−^, n = 4). (E, F) Flow cytometry analysis of the expression of GZMB (D) and IFN-γ (E) in tumor-infiltrating CD8^+^ T cells from MC38 tumor−bearing mice on day 25 (n = 6 per genotype). (G) Flow cytometry analysis of CD25^+^ Foxp3^+^ Treg cells in tumor-infiltrating CD4^+^ T cells from MC38 tumor−bearing mice on day 25 (n = 6 per genotype). (H, I) Representative images of lung metastases and quantification of the total number of lung surface metastases from WT and Usp17la^−/−^ mice 14 days after tail-vein injection with B16F10 melanoma cells (n = 4 per genotype). (J) In vitro CTL cytotoxicity assay of OVA_257-264_ peptide−pulsed B16/F10 cells co-cultured with WT OT − I and Usp17la^−/−^ OT − I CD8^+^ T cells for 4 h at the indicated Effector:Target (E:T) ratio (n = 3 per group). Data are representative of two independent experiments (A–D, H**–J) or pooled from two independent experiments (E–G). Data are shown as mean ± s.d. (J, error bars are present but not readily discernible due to minimal variance among replicates). Statistical analyses were performed using two-way ANOVA followed by Sidak’s multiple comparisons test (A,** G**,** J**), and unpaired, two-tailed Student’s t test (D–F,** I**). NS not significant. Source data are available online for this figure.
We also examined the role of USP17LA in metastatic tumor progression using the B16/F10 melanoma lung metastasis model. Usp17la^−/−^ mice exhibited less severe tumor invasion compared to WT mice (Fig. 4H,I). To further explore the effect of USP17LA on antigen-specific CD8⁺ T cell-mediated anti-tumor immunity, we utilized OT−I transgenic mice. Co-culture of OVA_257-264_ peptide-stimulated OT−I CD8⁺ T cells with OVA-expressing B16/F10 melanoma cells demonstrated that Usp17la^−/−^ OT−I CD8^+^ T cells exhibited enhanced cytotoxicity, as indicated by increased lactate dehydrogenase release (Fig. 4J). These results demonstrate that Usp17la deficiency enhances anti-tumor immunity by promoting CD8^+^ T-cell effector functions. We next evaluated the susceptibility of Usp17la-deficient mice to DSS-induced colitis and found that loss of Usp17la had no effect on body weight loss during the course of treatment (Fig. EV4D), suggesting that USP17LA is dispensable for innate immune responses to epithelial injury.
In contrast to the enhanced anti-tumor efficacy observed in Usp17la^−/−^ mice, Usp17lb^−/−^ mice showed accelerated tumor progression (Fig. EV4E–G), indicating a potential tumor suppressive role for USP17LB. Despite being homologous members of the USP17L family, USP17LA and USP17LB exhibited distinct roles in tumor regulation.
Usp17la is dispensable for the homeostasis and differentiation of CD4⁺ T helper cells
In addition to investigating the effects of USP17LA on CD8^+^ T-cell function, we further examined whether Usp17la deficiency impacts CD4^+^ T-cell homeostasis. Th2 population was slightly increased in the spleens of Usp17la^−/−^ mice, but no significant differences in other Th populations (Th1, Th2, Th17, Treg) were observed in their lymph nodes (Fig. 5A,B). In addition, no differences were observed in IFN-γ^+^ CD8^+^ T cells between the two genotypes (Fig. 5A,B). Moreover, Usp17lb deficiency did not affect the proportion of Th1 and Th17 cells in the spleen under homeostasis (Fig. EV4H,I).Figure 5Usp17la deficiency does not alter Th cell distribution or differentiation.(A, B) Flow cytometry analysis of the expression of IFN-γ, IL-4, IL-17A, and Foxp3 in CD4^+^ T cells and IFN-γ in CD8^+^ T cells from lymph nodes and spleens of WT and Usp17la^−/−^ mice (n = 3–4 per genotype). (C, D) Flow cytometry analysis of the staining of IFN-γ, IL-4, IL-17A, CD25, and Foxp3 in WT and Usp17la^−/−^ naive CD4^+^ T cells activated with plate-bound anti-CD3 plus anti-CD28 under various polarization conditions. Representative flow cytometry plots (C) and quantification (D) are shown. (n = 5–6 per genotype). Data are representative of two independent experiments (A–D). Data are shown as mean ± s.d. Statistical analyses were performed using unpaired, two-tailed Student’s t test (A,** B**) and paired, two-tailed Student’s t test (D). NS not significant. Source data are available online for this figure.
To evaluate whether Usp17la deficiency influences T-cell differentiation, we stimulated naive CD4^+^ T cells from WT and Usp17la-deficient mice with anti-CD3 and anti-CD28 antibodies under Th1, Th2, Th17, and iTreg-polarizing conditions. Flow cytometric analysis revealed no significant differences in the expression of signature cytokines, including IFN-γ, IL-4, and IL-17A, between the two groups (Fig. 5C,D). Moreover, the induction efficiency of Foxp3⁺ iTreg cells was comparable (Fig. 5C,D). These findings suggest that USP17LA does not significantly impact CD4^+^ T-cell homeostasis or differentiation.
Loss of Usp17la enhances TCR signaling
Signaling pathways, including MAPK, NF-κB, and NFAT, are integral to T-cell activation processes (Blanchett et al, 2021; Rincón et al, 2001). To investigate how Usp17la deletion affects T-cell activation, we analyzed intracellular signaling events in splenic primary T cells from WT and Usp17la KO mice following stimulation with anti-CD3 plus anti-CD28 antibodies or PMA plus ionomycin. Both stimuli activated downstream TCR signaling molecules, including p-ERK and p-P65 (Fig. 6A,B). In Usp17la-knockout T cells, phosphorylation of ERK and P65 was significantly elevated (Fig. 6A,B). This enhancement was also validated in Usp17la KO EL4 cells compared to the sg-Renilla controls (Fig. 6C,D). Conversely, USP17LB overexpression enhanced TCR signaling, as indicated by increased phosphorylation of ERK, JNK, P38, IKKα/β, and P65 (Fig. EV4J).Figure 6USP17LA negatively modulates T-cell activation through inhibiting MAPK-NF-κB-NFAT signaling pathway.(A, B) Immunoblot analysis of TCR signaling-associated proteins in anti-CD3 plus anti-CD28-stimulated (A) and PMA plus ionomycin-stimulated (B) CD3^+^ T cells from WT and Usp17la^−/−^ splenocytes. (C) Immunoblot analysis of TCR signaling-associated proteins in PMA plus ionomycin-stimulated EL4 cells transduced with a sgRNA control (sg-Renilla) or a Usp17la-specific sgRNA (sg-Usp17la). (D) RT-qPCR analysis of Usp17la mRNA levels in EL4 cells as in (C) (n = 3 per group). (E) Schematic image of transcription factor reporter assay. HEK293T cells were stimulated with PMA plus ionomycin after co-transfection with reporter plasmids and EV, USP17LA, or USP17LB for 24 h and then lysed to detect luminescence. (F) The relative luciferase reporter values of USP17LA, USP17LB, and DUSP2 were normalized to those of the EV group (n = 3 per group). Data are representative of two (A,** B**) or three (C–F) independent experiments. Data are shown as mean ± s.d. Statistical analyses were performed using unpaired, two-tailed Student’s t test (D) and one-way ANOVA with Dunnett’s multiple comparisons test (F). NS not significant. Source data are available online for this figure.
Reporter assays were employed to assess the effects of USP17LA and USP17LB on NFAT, NF-κB, and MAPK signaling pathways. In these assays, HEK293T cells were co-transfected with reporter plasmids and candidate plasmids, followed by stimulation with PMA plus ionomycin to measure luminescence reporter activity (Fig. 6E). The positive control, DUSP2, significantly inhibited NFAT reporter activity, consistent with a previous report (Lu et al, 2015). Similarly, USP17LA and USP17LB inhibited NFAT activity but did not affect NF-κB or MAPK activity (Fig. 6F). These findings suggest potential feedback mechanisms associated with USP17LA and USP17LB ablation and overexpression. Collectively, these findings indicate that USP17LA functions as a negative regulator of TCR signaling pathways.
USP17LA modulates the Ubiquitin-mediated degradation of RACK1 to regulate NFAT signaling
To further elucidate the molecular mechanism regulated by USP17LA, we conducted immunoprecipitation coupled with mass spectrometry analysis (IP/MS) and identified 229 potential interactors of USP17LA. Tissue expression enrichment analysis using STRING revealed that these proteins are predominantly expressed in immune cells, consistent with their roles in T-cell activation (Fig. 7A). DAVID-based Gene Ontology molecular function (GO-MF) analysis identified cadherin binding and calmodulin binding as two of the top 10 enriched pathways (Fig. 7B). Cadherins and calmodulins are key molecules involved in T-cell activation. Cadherins play a critical role in the formation of the immunological synapse and signal transduction (Charnley et al, 2023). In contrast, calmodulin, as a central calcium signaling adapter, directly regulates the dephosphorylation and nuclear translocation of NFAT (Trebak and Kinet, 2019). The interactions between USP17LA and cadherin-binding proteins or calmodulin-binding proteins may alter the function of cadherins or calmodulin, thereby inhibiting downstream signaling in T cells.Figure 7USP17LA binds to cadherin-binding and calmodulin-binding proteins and inhibits NFAT activity by impairing RACK1 ubiquitination degradation.(A) Tissue expression profile of Flag-USP17LA-interacting proteins identified by IP/MS was analyzed using the STRING database (STRING: functional protein association networks). (B) GO molecular function analysis of USP17LA-immunoprecipitated proteins was performed using the DAVID database (https://david.ncifcrf.gov/), with a cutoff spectral index ratio of USP17LA versus vector set at 2. (C) Image representation of proteins involved in cadherin-binding and calmodulin-binding pathways enriched by Flag-USP17LA IP/MS. Image generated via a bioinformatic tool (www.microbioinformatics.cn). (D) Interaction was validated in HEK293T cells by co-expressing Flag-tagged RACK1 and Myc-tagged USP17LA, followed by immunoprecipitation using anti-Flag M2 beads and subsequent immunoblotting. (E) Immunoblot analysis of lysates from HEK293T cells co-transfected with Flag-RACK1, Myc-USP17LA, and HA-Ub (WT or K48 mutant), followed by a 4-h incubation with 20 mM MG132. (F, G) RT-PCR analysis of the expression of Il-2 and Ifng in EL4 cells following infection with sh-NC or sh-Usp17la in combination with OE-EV or OE-RACK1 lentiviruses, following anti-CD3 plus anti-CD28 stimulation for the indicated times (n = 3 per group). (H) Relative luciferase activity in NFAT-luciferase reporter EL4 cells expressing sh-NC or sh-Usp17la, with or without RACK1 overexpression, following anti-CD3 plus anti-CD28 stimulation (n = 3 per group). Data are representative of two (D,** E**,** H**) or three (F,** G**) independent experiments. Statistical analyses were performed using two-way ANOVA with Turkey’s multiple comparisons test (F,** G**) and with Dunnett’s multiple comparisons test (H). NS not significant. Source data are available online for this figure.
Analysis of candidate USP17LA-interacting partners revealed that RACK1 (Fig. 7C), acting as a receptor for PKC, inhibits NFAT transcriptional activity (Han et al, 2002). Besides, previous study indicates that loss of RACK1 elicits pathological hyperactivation in CD8^+^ T lymphocytes (Qiu et al, 2017), suggesting its putative role as a negative regulator of T-cell activation signaling pathways. First, we verified that USP17LA interacts with RACK1 in co-expression settings (Fig. 7D). Ubiquitination assays demonstrated that USP17LA suppresses K48-linked ubiquitination of RACK1, thereby attenuating its proteasomal degradation and stabilizing RACK1 protein levels (Fig. 7E). Reconstitution of RACK1 expression in USP17LA-depleted EL4 cells suppressed the upregulation of IL-2 and IFN-γ induced by anti-CD3 and anti-CD28 stimulation, supporting the notion that USP17LA regulates T-cell activation through a RACK1-dependent mechanism (Figs. 7F,G and EV5A). Consistently, RACK1 overexpression dampened the enhanced NFAT luciferase reporter activity observed in Usp17la-deficient cells under the same stimulatory conditions (Figs. 7H and EV5B). Collectively, these findings suggest that USP17LA regulates T-cell activation by modulating NFAT activity through stabilization of RACK1.
Discussion
T-cell activation is fundamental to the adaptive immune response, playing a crucial role in defense against infections and immune homeostasis. While numerous studies have identified key regulators of T-cell activation, the precise molecular mechanisms remain incompletely understood. In this study, we identified USP17LA and USP17LB, two members of the deubiquitinase (DUB) family, as novel regulators of T-cell activation with opposing functions. Usp17la deficiency enhanced T-cell activation without affecting T-cell development, whereas Usp17lb deficiency reduced T-cell activation. Notably, Usp17la knockout mice exhibited heightened anti-tumor immunity, suggesting a potential role for USP17LA in tumor immunosurveillance.
Mechanistically, USP17LA interacts with cadherin-binding and calmodulin-binding proteins and suppresses K48-linked ubiquitination of RACK1, thereby stabilizing NFAT activity and enhancing T-cell activation. USP17LA deletion also enhances ERK and P65 phosphorylation in EL4 and primary T cells; however, AP-1 and NF-κB reporter activity in HEK293T cells remains unchanged. This discrepancy likely reflects differences in cellular context: 293T cells lack intact TCR signaling, limiting faithful AP-1/NF-κB readouts, whereas NFAT activity is preserved via the calcium–calcineurin pathway. Similarly, DUSP2, a known MAPK regulator in T cells (Dan et al, 2020), fails to suppress AP-1 in 293T cells, underscoring the limitations of this system. Therefore, these findings are complementary rather than contradictory. However, our conclusions regarding CD4⁺ T-cell activation in Usp17la-deficient cells remain cautious, as the depletion method used did not specifically exclude Treg cells, which may influence activation outcomes.
Our study showed that USP17LA can regulate the stability of RACK1, thereby affecting NFAT activity, but did not explain how USP17LA regulates MAPK and NFKB activity. Prior studies reported RACK1 negatively regulates NF-κB activity in gastric cancer cells (Yong-Zheng et al, 2015), potentially explaining increased NF-κB activation in Usp17la^−/−^ T cells. Conversely, RACK1 positively correlates with MAPK signaling in tumorigenesis (Sato et al, 2015; Song et al, 2024), but the impact of USP17LA on MAPK signaling in T cells remains unexplored. Given that USP17LA interacts with numerous proteins, it likely regulates additional substrates beyond RACK1. Among the 47 proteins associated with cadherin-binding and calmodulin-binding pathways, MYH9 was identified as a ubiquitination-regulated target analyzed by Uniprot. While MYH9 mutations are linked to hearing loss in humans with no significant immune implications (Li et al, 2016), uncharacterized ubiquitination of other proteins may play a role in T-cell modulation.
USP17LA and USP17LB exhibit high amino acid sequence homology, differing primarily at their N- and C-termini, suggesting that these structural domains may confer distinct regulatory functions in T cells. Consistent with this notion, although both USP17LA and USP17LB inhibited NFAT activity in HEK293T overexpression reporter assays, they appeared to have opposite effects on overall T-cell activation. This paradox may reflect the limitations of the artificial overexpression system, which lacks the full TCR signaling context and may obscure functional differences. USP17LA appears to regulate T-cell activation more broadly by stabilizing RACK1 and modulating MAPK and NF-κB pathways, while USP17LB may differ in subcellular localization, protein interactions, or expression dynamics, which could result in distinct or even compensatory functions under specific stimuli or cellular states. For instance, USP17LB may not associate with key regulators such as RACK1 to the same extent, potentially accounting for the divergent signaling outcomes. These observations highlight the functional divergence within the USP17L family and underscore the need for further investigation into their context-dependent roles in T-cell biology.
Owing to the conserved nature of the USP17L family, we hypothesized that compensatory mechanisms might operate among its members. To address this, we assessed the expression of other USP17L genes in CD3⁺ T cells lacking either USP17LA or USP17LB. Under resting conditions, no significant changes were detected, implying limited baseline compensation (Fig. EV5C,D). However, upon TCR engagement using anti-CD3 and anti-CD28 antibodies, stimulus-dependent changes emerged. In Usp17la-deficient T cells, Usp17ld and Usp17le were markedly upregulated, suggestive of a compensatory attempt to restore regulatory balance in the absence of USP17LA. In contrast, Usp17lb deficiency resulted in elevated Usp17la and reduced Usp17le expression, indicating an alternative compensatory axis (Fig. EV5C,D). These findings underscore a dynamic, context-dependent regulatory interplay among USP17L family members and highlight the complexity of DUB-mediated modulation of T-cell activation. Usp17la/Usp17lb double KO mice may serve as valuable models to investigate potential compensatory mechanisms between these two homologs, which warrants further investigation in future studies. Given that ubiquitination is orchestrated by the coordinated actions of E3 ligases and DUBs, future studies are warranted to define the specific E3 partners of USP17LA and their contributions to TCR signaling fidelity.
Immune checkpoint inhibitors (ICIs) targeting PD-1 (CD279), PD-L1 (CD274), or CTLA-4 (CD152) have revolutionized cancer immunotherapy, leading to significant survival benefits in multiple cancer types (Wallis et al, 2019). However, many patients do not respond to ICI monotherapy (Wallis et al, 2019), highlighting the need to identify additional regulatory mechanisms controlling T-cell function in anti-tumor immunity. Recent advances suggest that targeting T-cell homeostasis in combination with ICIs may enhance therapeutic efficacy (Chen and Mellman, 2017; Hashimoto et al, 2023; Luo et al, 2023). Given that Usp17la knockout mice exhibit enhanced anti-tumor immunity, we hypothesize that targeting USP17LA in combination with ICIs could yield improved therapeutic outcomes. Further studies are required to validate this hypothesis and explore the underlying molecular mechanisms.
In summary, our study demonstrates that Usp17la deficiency enhances T-cell activation by modulating TCR signaling. We further show that USP17LA depletion suppresses tumor growth, underscoring its potential as a target for cancer immunotherapy. Future studies should explore whether USP17LA inhibition can synergize with ICIs and further elucidate the downstream molecular pathways governing T-cell activation and tumor immunity.
Methods
Reagent and tools tableReagent/resourceReference or sourceIdentifier or catalog number Experimental models C57BL/6J miceShanghai Model Organisms CenterNM-KO-200804OT-I miceProf. Bing Du from East China Normal UniversityN/AMC38American Type Culture CollectionN/AEL4American Type Culture CollectionN/AHEK293TAmerican Type Culture CollectionN/A Recombinant DNA pLV-EF1a-N-Flag (EV)This studyN/ApLV-EF1a-N-Flag-USP17LAThis studyN/ApLV-EF1a-N-Flag-USP17LBThis studyN/ApLV-EF1a-N-Flag-RACK1This studyN/ApLV-EF1-H1-NCThis studyN/ApLV-EF1-H1-shUsp17laThis studyN/ALentiCRISPR sg-RenillaThis studyN/ALentiCRISPR sg-Usp17laThis studyN/ApGL4.30-luc2P-NFAT-RE-HygroThis studyN/ApLV-luc2P-NFAT-REThis studyN/ApLV-puro-C-HA (EV)This studyN/ApLV-puro-C-HA-K48This studyN/ApLV-puro-N-MycThis studyN/ApLV-puro-N-Myc-USP17LAThis studyN/A Antibodies APC/Fire™ 750 anti-mouse CD3εBioLegend100362FITC anti-mouse CD4BioLegend100509PE anti-mouse CD8αBioLegend100707Brilliant Violet 785™ anti-mouse/human CD45R/B220BioLegend103246APC anti-mouse NK-1.1BioLegend108709APC anti-mouse/human CD11bBioLegend101212Brilliant Violet 421™ anti-mouse F4/80BioLegend123137APC anti-mouse/human CD44BioLegend103011PE anti-mouse CD25BioLegend102007PE anti-mouse CD62LBioLegend104408FITC anti-mouse IL-2BioLegend503806PE anti-mouse IL-4BioLegend504103PE anti-mouse IL-17ABioLegend506903PE anti-mouse/human FOXP3BioLegend320207PE/Cyanine7 anti-human/mouse Granzyme BBioLegend372213PE anti-mouse IFN-γBioLegend505807Brilliant Violet 650™ anti-mouse TNF-αBioLegend506333Ultra-LEAF™ Purified anti-mouse CD3εBioLegend100340Ultra-LEAF™ Purified anti-mouse CD28BioLegend102116Ultra-LEAF™ Purified anti-mouse IL-4BioLegend504122Ultra-LEAF™ Purified anti-mouse IFN-γBioLegend505834Anti-β-actinSigma-AldrichA2228Anti-HSP90Proteintech13171-1-APAnti-VinculinProteintech66305Anti-FlagSigma-AldrichF1804Anti-HASigma-AldrichH9658Anti-c-MycSigma-AldrichM4439Anti-p-ERKSanta Cruzsc-7383Anti-p-JNK1/2/3ABclonalAP0276Anti-p-P38ABclonalAP4771Anti-phospho-NF-κB P65Cell Signaling Technology3033 TAnti-p-IKKα/β (S176/180)Cell Signaling Technology2697 TAnti-ERKABclonalA4782Anti-JNK1/2/3ABclonalA4867Anti-P38ABclonalA4771Anti-P65Cell Signaling Technology8242TAnti-IKKβCell Signaling Technology8943T Oligonucleotides and other sequence-based reagents
Forward
Reverse Usp17la-RTGAGGTCTTTGGAGACATGGTGCCAACTCAGACTGTGCTTTCCUsp17lb-RTGTGGTTGCTCTCTCCTTCCCTCTCCCAACTCAGACTGTGUsp17lc-RTGAGGTCTTTGGAGACATGGTGTCAGACTGGGCTTGTCATTGUsp17ld-RTTGGTGGTTTCTCTTTCCTTCCTCAGACTGGGCTTGTCATTGUsp17le-RTCAAGTTCTTTGAAGAGGTCTTTGGAGACTGTGCTTTCCATTGGTAGRACK1-RTGTCCCGAGACAAGACCATAAAGGACACAAGACACCCATTCTACTB-RTACCTTCTACAATGAGCTGCGCTGGATGGCTACGTACATGGsg-Usp17laCACCGTGGAGGAGCTAACTGTCAAAAACTTGACAGTTAGCTCCTCCACsh-Usp17laAAAA GCTGTAAGTTGTGTGCTATGG TTGGATCCAA CCATAGCACACAACTTACAGCAAAA GCTGTAAGTTGTGTGCTATGG TTGGATCCAA CCATAGCACACAACTTACAGCsh-Usp17lbAAAA GGTGGAGGTCTCAGATCAAGT TTGGATCCAA ACTTGATCTGAGACCTCCACCAAAA GGTGGAGGTCTCAGATCAAGT TTGGATCCAA ACTTGATCTGAGACCTCCACCUsp17la-genotyping (F1/F2/R1)TCTCTCTACTTTGGTGGTCG (F1)GCTGACTGACTCTCTGATTG (F2)CTCTATGCTGCTCAGATTCC (R1)Usp17lb-genotyping (F3/F4/R2)TGGTCATGAGTTGAAGCCGT (F3)GAACTTGATCGACTCAGTGG (F4)AGAAAGGGCAGTCACAAAGC (R2)Usp17la-genotyping (q-F1/q-R1)CTTCTATGTGCAGCAGGCCATGTTTTCGCAGGGCTCTCCTAAUsp17lb-genotyping (q-F2/q-R2)GTGGTTGCTCTCTCCTTCCCTCTCCCAACTCAGACTGTG Chemicals, enzymes, and other reagents True-Nuclear™ Transcription Factor Buffer SetBioLegend424401DNase ISigma-Aldrich10104159001Collagenase DSigma-Aldrich11088858001PercollCytiva17089109-1EDTASangon BiotechB540625-0500Nonidet (R) P-40Sangon BiotechA500109-05002 x Taq Plus Master Mix IIVazymeP213-03PrimeSTAR Max Premix (2X)TAKARAR045QMojoSort™ Mouse CD3 T Cell Isolation KitBioLegend480031MojoSort™ Mouse CD4 Naive T Cell Isolation KitBioLegend480040MojoSort™ Mouse CD8 Naive T Cell Isolation KitBioLegend480044DMEMSangon BiotechE600003-0500RPMI 1640Sangon BiotechE600028-0500Fetal bovine serumLonseraS711-001SPenicillin–streptomycin solutionSangon BiotechE607011-0500Nonessential amino acidsBeyotimeC0332Sodium pyruvateBasalMedia113-24-6PMASigma-AldrichP8139Dextran Sulfate Sodium SaltMP Biomedicals0216011010IonomycinSigma-Aldrich407952MonensinPeprotech2237803Immunostaining Fix SolutionBeyotimeP0098Permeabilization Solution with SaponinBeyotimeP0095CountBright Absolute Counting BeadsThermo FisherC36950CFDA SE Cell Proliferation and Tracking KitYeasen40714ES76ConASigma-Aldrich11028-71-0LDH Cytotoxicity Assay KitBeyotimeC0017BCA Protein Assay KitEpizymeZJ102HiScript III RT SuperMix for qPCR KitVazymeR323-01Anti-Flag M2 magnetic beadsSigma-AldrichM88233× FLAG peptideSigma-AldrichF4799Protein Stains OSangon BiotechC510027Protease Inhibitor CocktailSigma-AldrichP2714Nitrocellulose membranesCytiva10600002Escherichia coli Stellar cellsClontech636763SYBR qPCR Master MixVazymeQ712Recombinant Human TGF-β1BioLegend580702Human IL-2NovoproteinC013Mouse IL-2Peprotech212-12Mouse IL-4Peprotech214-14Mouse IL-12Peprotech210-12Recombinant Mouse IL-6 (carrier-free)BioLegend575702 Software FlowJo v10.6TreeStarGraphPad Prism 8GraphPad Software Other Celesta cell analyzerBD BiosciencesOrbitrap Exploris 480Thermo FisherPierce™ ECL Western Blotting SubstrateThermo FisherChemiScope 6100TanonNanoDrop 2000 spectrophotometerThermo Fisher
Mice
All mice used in this study were on a C57BL/6J background, with age and gender matched across groups. Male and female mice were used interchangeably unless otherwise noted. The Usp17la-knockout (Usp17la^−/−^) and Usp17lb-knockout (Usp17lb^−/−^) mice were generated by the Shanghai Model Organisms Center, Inc. using a CRISPR/Cas9−mediated gene targeting strategy. The genotype of mice was confirmed by PCR of mouse tail DNA and RT-PCR using cDNA from CD3^+^ T cells isolated from the spleen. OT−I mice were originally provided by Prof. Bing Du (East China Normal University). Usp17la^−/−^ OT−I mice were obtained by crossing Usp17la^−/−^ mice with OT−I transgenic mice. To minimize bias and experimental variability, mice were randomly grouped and re-labeled with randomized identification numbers. All mice were bred and maintained under specific pathogen-free conditions, with ad libitum access to standard laboratory chow, a 12 h light/dark cycle, controlled temperature (22 ± 1 °C), and humidity (55% ± 5%), in accordance with the guidelines approved by the Animal Studies Committee of Children’s Hospital of Fudan University. All in vivo experiments were conducted following protocols approved by the Institutional Animal Care and Use Committee of Fudan University (Protocol No. 2020IBSJS-013).
Primary cells and cell lines
Primary immune cell suspensions from thymus, spleen, inguinal lymph nodes, and blood were prepared as described (Zhang et al, 2025). In brief, cells from the thymus, spleen, and lymph nodes were harvested by mechanical grinding, while peripheral blood was collected via the submandibular vein. After erythrocyte lysis from the spleen and peripheral blood, the resulting cell suspensions were used for peripheral immune cell analysis. For in vitro T-cell activation, Th polarization and TCR signal analysis, primary CD3^+^ T cells, naive CD4^+^ T cells or naive CD8^+^ T cells were isolated from the spleens of mice using negative selection kits, according to the manufacturer’s protocol. To isolate tumor-infiltrating lymphocytes (TILs), MC38 tumors were harvested from mice and subjected to enzymatic digestion with DNase I and collagenase D for 30 min at 37 °C with gentle rotation. The resulting cell suspension was then separated by density gradient centrifugation using a 20%/80% Percoll solution. The lymphocyte-enriched fraction was collected from the interphase and subsequently resuspended in complete culture medium for further analysis.
The mouse lymphoma (EL4) cells and human embryonic kidney (HEK293T) cells were sourced from the American Type Culture Collection. Both EL4 and HEK293T cells were cultured in DMEM medium supplemented with 10% fetal bovine serum and 1% penicillin–streptomycin. Primary cell lines were cultured in RPMI 1640 medium, supplemented with 10% FBS, nonessential amino acids, sodium pyruvate, and 55 µM β-mercaptoethanol. All cells were maintained in a humidified incubator with 5% CO_2_ at 37 °C. Cell authentication was performed via short tandem repeat (STR) profiling.
Flow cytometry
Flow cytometry was performed using a Celesta cell analyzer (BD Biosciences), and data were analyzed with FlowJo software. Immune cells were stained at 4 °C with FACS buffer (2% BSA in 1× PBS) and analyzed using the following surface markers: CD3ε, CD4, CD8, B220, NK1.1, CD11b, F4/80, CD44, CD25, and CD62L. For intracellular cytokine analysis, cells were stimulated with PMA and ionomycin in the presence of Monensin for 4–5 h. Intracellular markers included IL-2, IL-4, IL-17A, Granzyme B, IFN-γ, and TNF-α. Intracellular cytokine staining was conducted at 4 °C using Immunostaining Fix Solution and Permeabilization Solution with Saponin. For transcription factor analysis, Foxp3 staining was performed at 4 °C using the True-Nuclear Transcription Factor Buffer Set. For cell quantification, CountBright Absolute Counting Beads were added to the samples prior to flow cytometric analysis.
Th cell polarization
According to the previous description, naive CD4^+^ T cells were isolated from mouse spleens using a negative selection kit and activated with 2 μg/mL of plate-bound anti-CD3 and 1 μg/mL of anti-CD28. To induce polarization into specific subsets, the following conditions were applied: Th1 cells were polarized with 10 μg/mL anti-IL-4 and 10 ng/mL IL-12; Th2 cells were induced with 10 μg/mL anti-IFN-γ and 20 ng/mL IL-4; Th17 cells were differentiated using 20 ng/mL IL-6, 5 ng/mL TGF-β, along with anti-IFN-γ and anti-IL-4; and iTreg cells were differentiated with 1 ng/mL TGF-β, 4 ng/mL IL-2, and anti-IFN-γ and anti-IL-4. After 72 h of stimulation, Monensin was added for the last 4 h to block protein transport, and cells were then collected for flow cytometry analysis.
Carboxyfluorescein succinimidyl ester (CFSE) cell proliferation
CFSE dilution assays were performed using the CFDA SE Cell Proliferation and Tracking Kit. The cell concentration was adjusted to 1–5 × 10^6^ cells/mL, and cells were stained with a 2× CFDA SE working solution at 37 °C for 15 min. The staining reaction was then terminated by adding 5–10 times the volume of medium supplemented with 10% FBS, following the manufacturer’s protocol. CFSE-stained cells were cultured with ConA for 48 or 72 h, and cell division was subsequently analyzed by flow cytometry.
B16F10 lung metastasis model
A total of 2 × 10^5^ B16/F10 melanoma cells, suspended in 100 µL PBS, were i.v. injected into 6–8-week-old WT and Usp17la^−/−^ female mice. Fourteen days post-injection, the mice were anesthetized and their lungs were carefully excised for examination of metastatic nodules and photographic documentation.
Subcutaneous syngeneic MC38 colon adenocarcinoma model
A total of 1 × 10^6^ MC38 cells suspended in 100 µL PBS were injected subcutaneously into 6–8- week-old WT and Usp17la^−/−^ mice. Tumor volume was measured every 3 days starting 8 days post-injection. Tumor volume was calculated using the formula: ½ × length × width², where length and width represent the longest and shortest tumor diameters, respectively. After 25 days, the tumors were excised and weighed. CD4^+^ and CD8^+^ tumor-infiltrating T cells were isolated for subsequent flow cytometry analysis.
In vitro cytotoxicity assay
Total splenocytes from WT OT−I and Usp17la^−/−^ OT−I mice were isolated and cultured in vitro with 10^−7 ^M OVA_257-264_ peptide for 24 h, following lysis of red blood cells. The cells were then maintained in IL-2 for an additional 4 days to generate effector cells. On day 5, 2 × 10⁴ B16/F10 cells were seeded in a 96-well plate and pulsed with 10^−7 ^M OVA_257-264_ peptide for 1 h to serve as target cells. The activated WT and Usp17la^−/−^ OT−I cells were subsequently collected and incubated with peptide-pulsed B16/F10 cells at varying effector-to-target ratios for 4 h. Cell death was quantified using the LDH Cytotoxicity Assay Kit at an optical density of 490 nm (OD490) and calculated according to the manufacturer’s instructions.
DSS-induced colitis model
To induce acute colitis, 8−10-week-old male WT and Usp17la^−/−^ mice on a C57BL/6 background were given 1.5% dextran sulfate sodium (DSS; molecular weight 36,000–50,000) in their drinking water for 7 consecutive days, followed by 3 days of regular water. Body weight was monitored daily starting from the first day of DSS treatment.
Luciferase reporter assay
For HEK293T cell-based luciferase reporter assay, HEK293T cells were co-transfected with luciferase reporter plasmids and either (empty vector) EV, USP17LA, USP17LB or DUSP2 expression constructs. After 24 h, cells were stimulated with PMA and ionomycin for 4 h, lysed at room temperature for 10 min, and centrifuged to collect the supernatant. Luciferase activity was measured using a commercial luciferase assay system according to the manufacturer’s instructions.
For the EL4 cell-based luciferase reporter assay, EL4 cells were transduced with lentivirus encoding an NFAT-luciferase reporter cassette, and stable cell lines were established. These cell lines were subsequently transduced with lentivirus expressing Usp17la shRNA and/or RACK1 overexpression constructs. After 3 days, cells were stimulated with PMA and ionomycin for 3 or 6 h, followed by lysis and measurement of luciferase activity.
Immunoprecipitation and co-immunoprecipitation/mass spectrometry (Co-IP/MS)
Transfected HEK293T cells were harvested and lysed in NP-40 lysis buffer (25 mM Tris-HCl, pH 7.5, 150 mM NaCl, 1% NP-40/Triton X-100, 1 mM EDTA, 1 mM EGTA, 2.5 mM sodium pyrophosphate, 1 mM β-glycerophosphate, 1 mM Na_3_VO_4_, 1 mM PMSF) supplemented with protease inhibitors. Cell lysates were centrifuged at 12,000× g for 10 min and incubated with anti-Flag M2 magnetic beads for 2–4 h at 4°C. After extensive washing, the anti-Flag-beads−bound proteins were eluted using 3× FLAG peptide. The eluted proteins were then subjected to immunoblotting or silver staining prior to semiquantitative mass spectrometry analysis by the Functional Proteomics Analysis Platform, Institutes of Biomedical Sciences, Fudan University.
Ubiquitination assay
HEK293T cells were transfected with HA-Ub (WT or K48) and the indicated constructs. After 36 h, the cells were treated with 20 μM MG132 for 4 h, then lysed in denaturing buffer [1% (wt/vol) SDS, 50 mM Tris-HCl, pH 7.5, 0.5 mM EDTA, and 1 mM DTT]. The lysates were heated at 100 °C for 5 min, sonicated, and then diluted 10-fold with NP-40 lysis buffer. After centrifugation, the lysates were incubated with anti-Flag M2 beads for 2 h at 4 °C. Following extensive washing, the bead-bound proteins were eluted with 3× FLAG peptide and resolved by SDS-PAGE for subsequent immunoblotting.
Immunoblotting
Immunoblotting was performed as previously described (Zhang et al, 2025). Briefly, cells or tissues were lysed in RIPA lysis buffer (25 mM Tris-HCl, pH 7.5, 150 mM NaCl, 1% NP-40/Triton X-100, 1 mM EDTA, 1% sodium deoxycholate, 0.1% SDS), supplemented with protease inhibitors, 1 mM PMSF, and 1 mM Na₃VO₄. Protein concentrations were determined using the BCA Protein Assay Kit, resolved by sodium dodecyl sulfate−polyacrylamide gel electrophoresis (SDS-PAGE), and transferred to Nitrocellulose membranes. After blocking with 5% skim milk, the membranes were sequentially incubated with primary and secondary antibodies. The primary antibodies used included: anti-β-actin; anti-HSP90; anti-Vinculin; anti-Flag; anti-HA; anti-c-Myc; anti-p-ERK;anti-p-JNK1/2/3; anti-p-P38; anti-phospho-NF-κB P65 (Ser536), p-IKKα/β (S176/180); ERK; JNK1/2/3; P38; P65; IKKβ. Bands were visualized using Pierce™ ECL Western Blotting Substrate with a ChemiScope 6100 (Tanon, Shanghai, China).
Plasmid constructs
Human gene RACK1 was amplified by PCR and subcloned into the pLV-EF1a-IRES-puro vector with an N- terminal Flag tag. Mouse gene Usp17la and Usp17lb were conducted by amplifying cDNA from mouse tissues mix and cloning it into the pLV-EF1a-IRES-puro vector with an N-terminal Myc tag. K48 Ub was constructed by mutating six other lysine residues (K6, K11, K27, K29, K33, and K63) to arginine and subsequently cloned into the pcDNA6-N-HA vector. To knockout endogenous Usp17la, lentiviral sgRNA vectors were generated by inserting the sgRNA sequences into the lentiCRISPR v2 vector. Lentiviral shRNA vectors targeting endogenous Usp17la were generated by cloning the shRNA sequences into the pLV-EF1a-H1 vector. shRNA sequences were designed using Thermo Fisher’s BLOCK-iT RNAi Designer tool. All plasmids were transformed into Escherichia coli Stellar cells, and plasmid DNA was extracted. All plasmid constructs were validated by DNA sequencing.
RNA isolation and quantitative real-time PCR (qRT-PCR)
Total RNA was extracted from cultured cells using TRIzol reagent in accordance with the manufacturer’s instructions. The quality and concentration of the RNA were assessed using a NanoDrop 2000 spectrophotometer. Subsequently, RNA was transcribed into first-strand complementary DNA (cDNA) as needed, utilizing the HiScript III RT SuperMix for qPCR Kit. Quantitative real-time PCR (RT-qPCR) was conducted using SYBR qPCR Master Mix on a QuantStudio 1 system (Applied Biosystems) following the manufacturer’s protocol. The expression levels of the target genes were normalized to β-actin using the 2^−ΔΔCt^ method.
Bioinformatics analyses
The RNA-seq data from EL4 cells stimulated with PMA and Ionomycin were analyzed using differential expression data reported in our previous study (Zhang et al, 2019). Tissue expression profile data for the Usp17l family were obtained from a previous study ((Söllner et al, 2017); Data Ref: (Söllner et al, 2017)). For the analysis of USP17LA IP/MS data, two sets of data were integrated: one comprising proteins with a USP17LA-to-vector ratio greater than two, and the other derived from the USP17LA-only group. Tissue expression profiles were evaluated using the STRING database, and Gene Ontology (GO) molecular function enrichment analysis was performed using the DAVID database. Proteins involved in the calmodulin binding and cadherin-binding pathways, as identified through DAVID, were further analyzed and visualized using a specialized bioinformatic tool (http://www.bioinformatics.com.cn).
Statistical analysis
Data are presented as the mean ± standard deviation (s.d.), as reflected by the error bars in the graphs. Sample sizes were determined to ensure sufficient statistical power for detecting potential differences. Statistical significance was determined using GraphPad Prism 9.0 software. Group differences were assessed with an unpaired two-tailed Student’s t test for comparisons between two groups and with ordinary one-way or two-way analysis of variance (ANOVA) for comparisons involving multiple groups. A P value of >0.05 was deemed not significant. Some samples were excluded from the analysis based on pre-established criteria, such as poor viability, failed stimulation. These exclusions were made prior to unblinding and were necessary to ensure data quality.
Supplementary information
Peer Review File Source data Fig. 1 Source data Fig. 2 Source data Fig. 3 Source data Fig. 4 Source data Fig. 5 Source data Fig. 6 Source data Fig. 7 Figure EV4 Source Data Expanded View Figures
The reference list from the paper itself. Each links out to its DOI / PubMed record.
- 1Hashimoto M, Ramalingam SS, Ahmed R (2023) Harnessing CD 8 T cell responses using PD-1-IL-2 combination therapy. Trends Cancer 10:332–34610.1016/j.trecan.2023.11.008PMC 1100658638129234 · doi ↗ · pubmed ↗
- 2Hsu WC, Chen MY, Hsu SC, Huang LR, Kao CY, Cheng WH, Pan CH, Wu MS, Yu GY, Hung MS et al (2018) DUSP 6 mediates T cell receptor-engaged glycolysis and restrains T(FH) cell differentiation. Proc Natl Acad Sci USA 115:E 8027–E 803610.1073/pnas.1800076115 PMC 611272230087184 · doi ↗ · pubmed ↗
- 3Zhang H, Guo Z, Yi J, Wu J, Wang Y, Ren T, Zhang Y, Zhao H, Wu N, Wei G et al (2025) Thymic egress and peripheral T cell homeostasis regulated by Rho GT Pase-activating protein 30. Cell Death Differ. 10.1038/s 41418-025-01529-010.1038/s 41418-025-01529-0PMC 1266970840404920 · doi ↗ · pubmed ↗