Differentiating small intestinal stromal tumors from primary small intestinal lymphomas using contrast-enhanced CT and texture analysis: a diagnostic study
Zhihua Li, Yiying Wang, Da Xi, Jian Wang, Haiyang Lan, Xiaoning He, Na Zhao, Juan Xiao, Naiwen Mu, Jianlong Li, Lincheng Liu, Guanghui Yu

TL;DR
This study uses CT scans and texture analysis to better distinguish between two types of intestinal tumors, improving preoperative diagnosis.
Contribution
The novel contribution is combining morphological and texture analysis from CECT to enhance differentiation between SISTs and PSILs.
Findings
SISTs showed significantly higher entropy and contrast, and lower homogeneity compared to PSILs.
The combined model achieved an AUC of 0.927, outperforming CECT features alone.
Integration of CECT and texture analysis improves diagnostic accuracy for intestinal tumors.
Abstract
To assess the diagnostic performance of morphological features combined with contrast-enhanced computed tomography (CECT) texture analysis in differentiating small intestinal stromal tumors (SISTs) from primary small intestinal lymphomas (PSILs). This retrospective study included 77 patients with pathologically confirmed SISTs and 52 patients with PSILs who underwent CECT. Clinical data (age, sex, symptoms) and CT morphological features (tumor location, growth pattern, enhancement, etc.) were analyzed. Texture parameters (entropy, contrast, homogeneity, etc.) were extracted using 3D Slicer software (version 5.6.2; https://www.slicer.org/). Statistical comparisons were performed using Student’s t-test or Mann–Whitney U test. Receiver operating characteristic (ROC) curve analysis was used to evaluate diagnostic efficacy. Compared with PSILs, SISTs exhibited significantly higher entropy…
Genes, proteins, chemicals, diseases, species, mutations and cell lines named across the full text — each resolved to its canonical identifier and authoritative record.
Click any figure to enlarge with its caption.
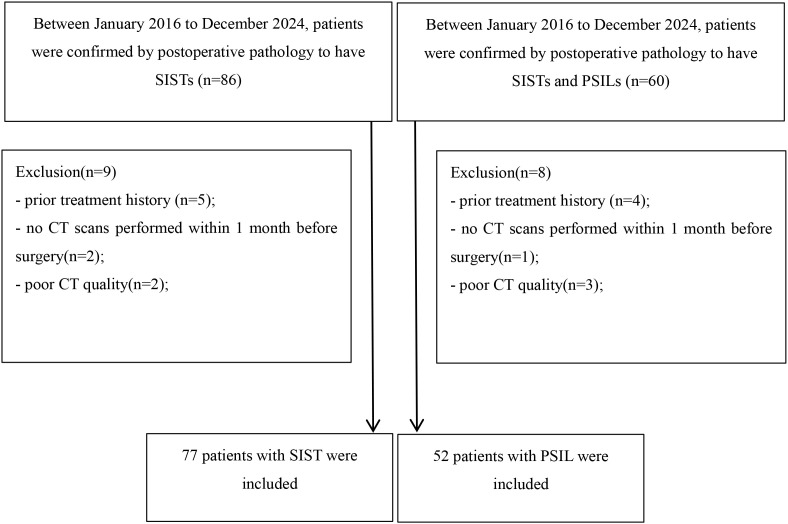 Figure 1
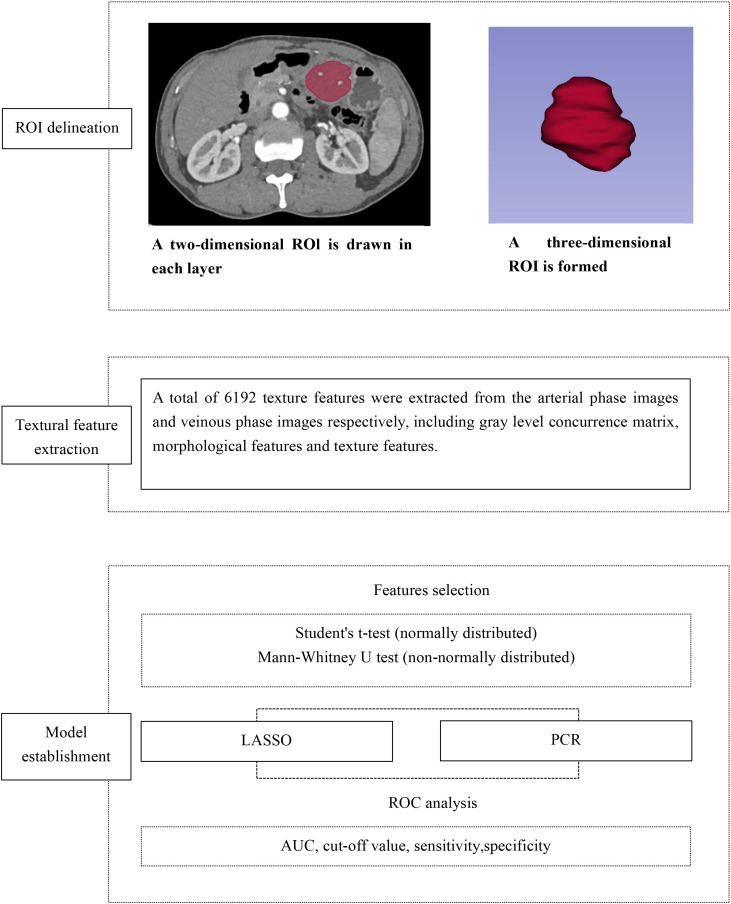 Figure 2
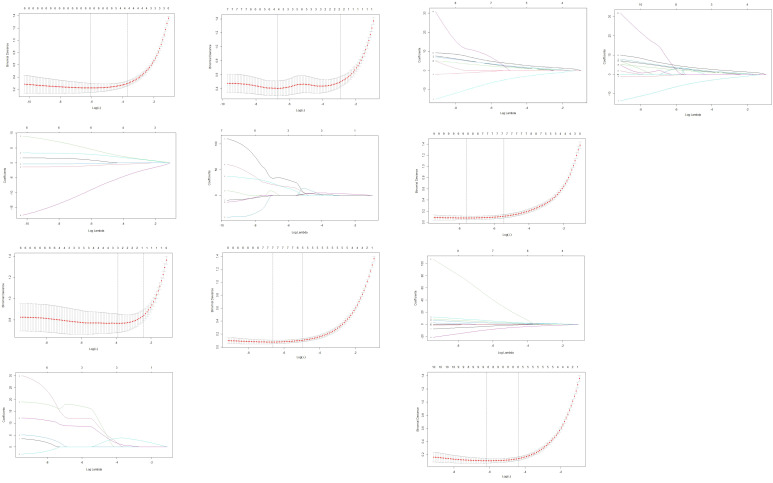 Figure 3
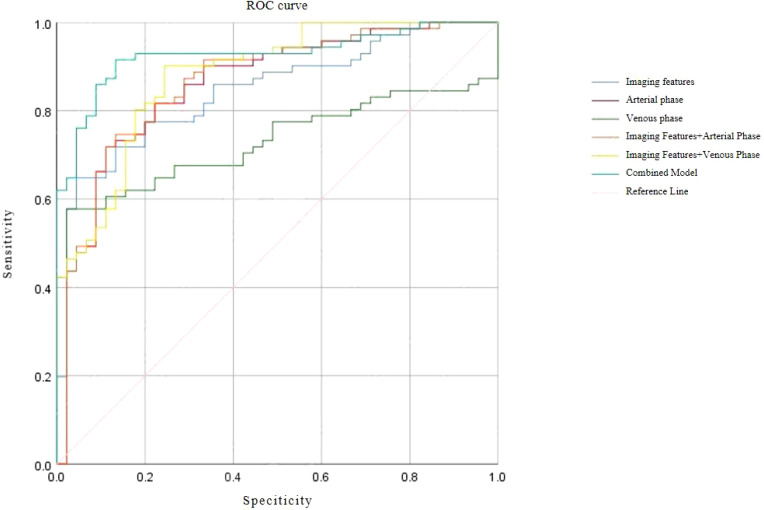 Figure 4
| Parameters | SIST (n=77) | PSIL (n=52) | t/χ² | P | |
|---|---|---|---|---|---|
| Age (mean ± SD) (y) | 63.51 ± 10.65 | 59.92 ± 16.38 | 1.391 | 0.168 | |
| Tumor size | 64.16 ± 37.26 | 62.93 ± 28.69 | 0.200 | 0.842 | |
| Gender | male | 46(59.74) | 37(71.15) | 1.762 | 0.184 |
| female | 31(40.26) | 15(28.85) | |||
| Contour | irregular | 23(29.87) | 38(73.08) | 23.246 | <0.001 |
| regular | 54(70.13) | 14(26.92) | |||
| Margin | well-defined | 67(87.01) | 36(69.23) | 6.738 | 0.034 |
| ill-defined | 10(12.99) | 16(30.77) | |||
| Location | duodenum | 22(28.57) | 4(7.69) | 37.102 | <0.001 |
| jejunum | 30(38.96) | 13(25) | |||
| ileum | 25(32.47) | 20(38.46) | |||
| ileocecum | 0(0) | 15(28.85) | |||
| Homogeneity | homogeneous | 11(14.29) | 37(71.15) | 42.963 | <0.001 |
| heterogeneous | 66(85.71) | 15(28.85) | |||
| Embedded vessel sign | present | 13(16.88) | 19(36.54) | 6.429 | 0.011 |
| absent | 64(83.12) | 33(63.46) | |||
| Lumen expansion | present | 12(15.58) | 17(32.69) | 4.503 | 0.034 |
| absent | 65(84.42) | 35(67.31) | |||
| Necrosis | present | 63(81.82) | 9(17.31) | 52.377 | <0.001 |
| absent | 14(18.18) | 43(82.69) | |||
| Lymphadenopathy | present | 2(2.6) | 35(67.31) | 72.446 | <0.001 |
| absent | 70(90.91) | 17(32.69) | |||
| Enhanced degree | mild | 20(25.97) | 9(17.31) | 62.742 | <0.001 |
| moderate | 6(7.79) | 38(73.08) | |||
| obvious | 51(66.23) | 5(9.62) | |||
| Parameters | SIST (n=77) | PSIL (n=52) | t | P |
|---|---|---|---|---|
| Contrast | 0.65 ± 0.21 | 0.36 ± 0.08 | 11.127 | <0.001 |
| Correlation | 0.49 ± 0.18 | 0.27 ± 0.11 | 8.848 | <0.001 |
| Difference average | 0.52 ± 0.11 | 0.35 ± 0.06 | 10.991 | <0.001 |
| Difference variance | 0.36 ± 0.09 | 0.23 ± 0.03 | 11.557 | <0.001 |
| Energy | 0.18 ± 0.07 | 0.35 ± 0.09 | -11.478 | <0.001 |
| Entropy | 3.09 ± 0.51 | 1.98 ± 0.25 | 16.424 | <0.001 |
| Maximum correlation coefficient | 0.53 ± 0.16 | 0.3 ± 0.11 | 9.845 | <0.001 |
| Joint maximum | 0.32 ± 0.1 | 0.51 ± 0.12 | -9.443 | <0.001 |
| Sum average | 8.42 ± 3.25 | 7.19 ± 10.74 | 0.946 | 0.346 |
| Sum entropy | 2.42 ± 0.4 | 1.59 ± 0.2 | 15.575 | <0.001 |
| SumSquares | 0.74 ± 0.4 | 0.25 ± 0.05 | 10.673 | <0.001 |
| Autocorrelation coefficient | 20.77 ± 19.14 | 41.26 ± 208.56 | -0.706 | 0.483 |
| Cluster prominence | 35.09 ± 74.63 | 1.39 ± 0.84 | 3.962 | <0.001 |
| Cluster shade | 0.55 ± 6.55 | 0 ± 0.18 | 0.736 | 0.464 |
| Cluster tendency | 2.32 ± 1.5 | 0.64 ± 0.18 | 9.703 | <0.001 |
| Difference entropy | 1.2 ± 0.15 | 0.94 ± 0.08 | 12.519 | <0.001 |
| IDM | 0.76 ± 0.04 | 0.83 ± 0.03 | -10.446 | <0.001 |
| ID | 0.75 ± 0.05 | 0.83 ± 0.03 | -10.700 | <0.001 |
| IDMN | 0.99 ± 0.01 | 0.98 ± 0.01 | 4.303 | <0.001 |
| IDN | 0.94 ± 0.02 | 0.93 ± 0.02 | 1.511 | 0.133 |
| ICM1 | -0.13 ± 0.08 | -0.12 ± 0.08 | -0.574 | 0.567 |
| ICM2 | 0.49 ± 0.19 | 0.47 ± 0.19 | 0.636 | 0.526 |
| Inverse variance | 0.42 ± 0.05 | 0.34 ± 0.06 | 8.583 | <0.001 |
| Joint Average | 4.21 ± 1.63 | 3.6 ± 5.37 | 0.946 | 0.346 |
| Parameters | SIST (n=77) | PSIL (n=52) | t | P |
|---|---|---|---|---|
| Contrast | 0.55 ± 0.18 | 0.35 ± 0.09 | 8.011 | <0.001 |
| Correlation | 0.43 ± 0.18 | 0.29 ± 0.12 | 5.265 | <0.001 |
| Difference average | 0.47 ± 0.11 | 0.34 ± 0.08 | 7.804 | <0.001 |
| Difference variance | 0.31 ± 0.07 | 0.23 ± 0.04 | 8.030 | <0.001 |
| Energy | 0.21 ± 0.07 | 0.36 ± 0.12 | -8.376 | <0.001 |
| Entropy | 2.78 ± 0.49 | 1.98 ± 0.34 | 10.958 | <0.001 |
| Maximum correlation coefficient | 0.48 ± 0.18 | 0.32 ± 0.12 | 6.046 | <0.001 |
| Joint maximum | 0.41 ± 0.14 | 0.44 ± 0.15 | 0.190 | 0.857 |
| Sum average | 7.88 ± 3.65 | 7.32 ± 11 | 0.416 | 0.678 |
| Sum entropy | 2.19 ± 0.38 | 1.6 ± 0.26 | 10.447 | <0.001 |
| SumSquares | 0.54 ± 0.27 | 0.27 ± 0.16 | 6.946 | <0.001 |
| Autocorrelation coefficient | 19.09 ± 25.71 | 43.15 ± 243.46 | -0.710 | 0.481 |
| Cluster prominence | 12.63 ± 19.55 | 471.81 ± 3391.16 | -0.976 | 0.333 |
| Cluster shade | 0.15 ± 2 | -6.26 ± 44.95 | 1.027 | 0.309 |
| Cluster tendency | 1.6 ± 1 | 0.74 ± 0.62 | 5.999 | <0.001 |
| Difference entropy | 1.12 ± 0.14 | 0.93 ± 0.13 | 7.682 | <0.001 |
| IDM | 0.78 ± 0.04 | 0.83 ± 0.04 | -7.340 | <0.001 |
| ID | 0.77 ± 0.05 | 0.83 ± 0.04 | -7.374 | <0.001 |
| IDMN | 0.98 ± 0.01 | 0.98 ± 0.01 | 2.016 | 0.046 |
| IDN | 0.93 ± 0.02 | 0.94 ± 0.02 | -0.580 | 0.563 |
| ICM1 | -0.15 ± 0.08 | -0.09 ± 0.05 | -5.011 | <0.001 |
| ICM2 | 0.52 ± 0.18 | 0.34 ± 0.12 | 6.770 | <0.001 |
| Inverse variance | 0.41 ± 0.06 | 0.33 ± 0.07 | 6.824 | <0.001 |
| Joint Average | 3.94 ± 1.83 | 3.66 ± 5.5 | 0.416 | 0.678 |
| Models | optimal λ value | Selection criterion | Regression equation reconstructed after principal-component regression |
|---|---|---|---|
| CECT features | 0.03942 | homogeneity, enhanced degree, necrosis, lymphadenopathy | Z = 4.616 − 0.599 * (homogeneity) + 9.278 * (enhanced degree) + 1.605 * (necrosis) − 9.867 * (lymphadenopathy) |
| Arterial-phase CT texture | 0.00146 | contrast, correlation, mean difference, energy | Z=4.877 + 7.129 * (contrast) + 4.858 * (correlation) + 3.072 * (mean difference) + 4.040 * (energy) |
| Venous-phase CT texture features | 0.02025 | difference average, entropy, difference variance | Z = 1.074 + 2.457 * (difference average) + 0.040 * (entropy) + 1.692 * (difference variance) |
| Combined CECT features with arterial-phase texture features | 0.00133 | contour, margin, enhanced degree, necrosis, lymphadenopathy, difference variance, entropy | Z =100.889 + 20.369 * (contour) + 14.708 * (margin) + 49.947 * (enhanced degree) + 48.644 * (necrosis) − 45.011 * (lymphadenopathy) + 56.173 * (difference variance) + 60.883 * (entropy) |
| Combined CECT with venous-phase texture features | 0.00051 | homogeneity, enhanced degree, embedded vessel sign, necrosis, lymphadenopathy, difference variance, entropy | Z =8.201 − 3.697 * (homogeneity) + 4.323 * (enhanced degree) − 0.474 * (embedded vessel sign) + 3.860 * (necrosis) − 3.859 * (lymphadenopathy) + 5.305 * (difference variance) + 5.721 * (entropy) |
| Integrated prediction | 0.00212 | contour, margin, enhanced degree, necrosis, lymphadenopathy, difference variance, entropy, contrast, difference variance | Z=136.455 + 26.880 * (contour) + 21.615 * (margin) +61.441 * (enhanced fegree) + 68.357 * (necrosis) − 58.015 * (lymphadenopathy) + 54.395 * (difference variance) + 62.617 * (entropy) + 26.350 * (contrast) + 28.488 * (difference variance) |
| Models | AUC(95% CI) | Sensitivity(%) | Specificity(%) |
|---|---|---|---|
| CECT features | 0.847 (0.777, 0.917) | 0.698 | 0.906 |
| Arterial-phase CT texture | 0.860 (0.790, 0.931) | 0.817 | 0.778 |
| Venous-phase CT texture features | 0.731 (0.639, 0.823) | 0.707 | 0.848 |
| Combined CECT features with arterial-phase texture features | 0.865 (0.795, 0.935) | 0.718 | 0.889 |
| Combined CECT with venous-phase texture features | 0.881 (0.820, 0.943) | 0.901 | 0.756 |
| Integrated prediction | 0.927 (0.879, 0.975) | 0.915 | 0.867 |
Peer Reviews
No public reviews on file for this paper yet. If you reviewed it on a platform where reviews are public (OpenReview, ICLR, NeurIPS, ICML), you can paste yours below so the community can read it here.
Videos
No videos yet. Explain this paper in a talk, walkthrough, or lecture? Add one.
Taxonomy
TopicsRadiomics and Machine Learning in Medical Imaging · Gastrointestinal Tumor Research and Treatment · Gastric Cancer Management and Outcomes
Introduction
Small intestinal stromal tumors (SISTs) and primary small intestinal lymphomas (PSILs) are two distinct malignancies with markedly different biological behavior and management strategies. SISTs are mesenchymal neoplasms with malignant potential, accounting for approximately 30% of small intestinal stromal tumors (1). Although surgical resection is the standard treatment for localized disease (2), high-risk cases remain prone to recurrence and metastasis despite advances in targeted therapies such as imatinib (3–6).
In contrast, PSILs represent a heterogeneous group of lymphoid malignancies, comprising 30-40% of all extranodal lymphomas (7). Their clinical presentation, prognosis, and treatment - which is primarily chemotherapy or radiotherapy - differ substantially from those of SISTs (8–11). Accurate preoperative distinction between these entities is therefore critical for treatment selection and prognostic assessment.
Conventional computed tomography (CT) is widely used for evaluating small intestinal tumors, but the morphological features of SISTs and PSILs often overlap, limiting diagnostic accuracy (12, 13). Radiomics, particularly CT texture analysis (CTTA), enables high-throughput quantification of tumor heterogeneity, providing information beyond visual interpretation (14–17). While CTTA has shown promise in oncologic imaging (18), its application in differentiating SISTs from PSILs has not been systematically investigated.
This study aimed to assess the value of contrast-enhanced CT morphological features combined with texture analysis in differentiating SISTs from PSILs, with the goal of improving preoperative diagnostic accuracy and guiding clinical decision-making.
Materials and methods
Study population
This retrospective study was approved by the Institutional Review Board of our hospital, and written informed consent was obtained from all participants. Between January 2016 and December 2024, 146 consecutive patients with pathologically confirmed small intestinal stromal tumors (SISTs) or primary small intestinal lymphomas (PSILs) were enrolled. The inclusion criteria were: (a) curative resection or biopsy with a definitive pathological diagnosis of SIST or PSIL; and (b) availability of contrast-enhanced CT(CECT) performed within 2 months prior to histopathological confirmation. The exclusion criteria were: (a) history of prior treatment (n = 9); (b) absence of preoperative CT within 1 month before surgery (n = 3); and (c) poor-quality CT images due to severe artifacts (n = 5). After applying these criteria, 129 patients (77 SISTs, 52 PSILs) were included in the final analysis. The patient selection process is summarized in Figure 1.
Flow chart detailing the patient selection process and exclusion criteria. In total, 129 patients with small intestinal stromal tumors and primary small intestinal lymphomas were enrolled in the final analysis. SIST, small intestinal stromal tumor; PSIL, primary small intestinal lymphoma;.
CT Imaging Protocol
All examinations were performed using a dual-source CT scanner (SOMATOM Definition, Siemens Healthcare, Forchheim, Germany). Patients fasted for at least 6 hours prior to scanning and ingested 1500–2000 mL of water 40–60 minutes before the examination to achieve adequate small bowel distension. Scans were acquired in the supine, feet-first position, covering the region from the dome of the diaphragm to the pubic symphysis. The CT acquisition parameters were as follows: tube voltage 100–120 kV, automatic tube current modulation, rotation time 0.5 s, collimation 64 × 1.25 mm, pitch 1.5:1, matrix 512 × 512, and slice thickness/interval 1.25 mm. Images were reconstructed using a 50 cm field of view, standard (STD) kernel, and 100% adaptive statistical iterative reconstruction (ASIR). For contrast-enhanced scans, nonionic iodinated contrast medium (iopromide, 370 mg I/mL; Ultravist 370, Bayer Schering Pharma, Berlin, Germany) was administered intravenously via the cubital vein at 1.5 mL/kg using a high-pressure injector at a rate of 3.5 mL/s, followed by a 20 mL saline flush. Bolus tracking was performed with the region of interest placed in the abdominal aorta, and arterial phase acquisition was initiated 20 s after the attenuation threshold reached 120 HU. Venous phase images were acquired 30s after the completion of the arterial phase, using the same coverage as the unenhanced scan. All images were transferred to a dedicated workstation (Syngovia, Siemens Healthcare) for multiplanar reconstruction with a slice thickness of 1.25 mm in coronal and sagittal planes. Data were subsequently exported to a 3D-Slicer platform for both qualitative and quantitative image analysis.
Image analysis
All CT images were reviewed on a picture archiving and communication system (PACS) workstation. Two board-certified abdominal radiologists, each with more than five years of experience, independently assessed the images while blinded to clinical information and final pathological results. In cases of disagreement, consensus was reached through consultation with a senior abdominal radiologist with over 30 years of experience. Demographic information such as sex and age were collected. The following imaging characteristics were recorded: lesion contour, margin, location, homogeneity, presence of the embedded vessel sign, luminal expansion, necrosis, lymphadenopathy, and degree of enhancement.
Feature extraction and selection
CT texture features were extracted from arterial- and venous-phase images using 3D Slicer (version 5.6.2; https://www.slicer.org/), an open-source software platform for medical image analysis and visualization (19). The image processing and texture analysis workflow is illustrated in Figure 2.
Flow diagram of image processing and texture features calculation.
Prior to feature extraction, grayscale normalization was performed to minimize variability caused by differences in image contrast and brightness. The region of interest (ROI) was manually delineated along the tumor boundary on the largest cross-sectional slice by an experienced radiologist blinded to clinical data, except for lesion location. Care was taken to exclude peri-tumoral vessels, adjacent normal bowel wall, intraluminal contents, and surrounding organs. All segmentations were performed on images with a slice thickness of 5 mm to ensure consistency for subsequent analyses.
Statistical analysis
All statistical analyses were performed using SPSS (version 26.0; IBM Corp., Armonk, NY, USA) and R (version 4.3.1; R Foundation for Statistical Computing, Vienna, Austria). Continuous variables were expressed as mean ± standard deviation or median (interquartile range), depending on distribution, while categorical variables were summarized as counts and percentages. Comparisons between SIST and PSIL groups were performed using the independent-samples t-test or Mann–Whitney U test for continuous variables, and Chi-square or Fisher’s exact test for categorical variables, as appropriate. Univariate analysis was initially conducted to identify statistically significant predictors among CECT morphological features, arterial-phase texture features, and venous-phase texture features. Significant variables were subsequently entered into least absolute shrinkage and selection operator (LASSO) regression for further feature selection.
To develop predictive models, principal component analysis (PCA) was used to reduce dimensionality. Six models were constructed:
CECT morphological features model;
Arterial-phase texture features model;
Venous-phase texture features model;
Combined CECT + arterial-phase texture model;
Combined CECT + venous-phase texture model;
Comprehensive model combining CECT + arterial-phase + venous-phase texture features.
The diagnostic performance of each model in differentiating SISTs from PSILs was evaluated using receiver operating characteristic (ROC) curve analysis. Predictive efficacy was quantified by the area under the curve (AUC), 95% confidence interval (CI), accuracy, sensitivity, and specificity. A two-sided p < 0.05 was considered statistically significant.
Results
Patient clinical and morphological characteristics with SIST and PSIL
A total of 129 patients with surgically and pathologically confirmed SISTs or PSILs were included, comprising 77 (59.7%) SISTs and 52 (40.3%) PSILs. The cohort consisted of 83 males and 46 females, with a mean age of 61.51 ± 12.65 years.
Significant differences between the two groups were observed for lesion morphology (p < 0.001), tumor location (p < 0.001),enhanced homogeneity (p < 0.001), vascular embedding (p = 0.011), necrosis (p < 0.001), enlarged lymph nodes (p < 0.001), and enhancement pattern (p < 0.001), margins (p = 0.034) and lumen expansion (p = 0.034). No significant differences were noted in age, sex, or tumor diameter (p > 0.05). The detailed clinical and CT imaging characteristics are summarized in Table 1.
Arterial-phase CT texture features
Analysis of arterial-phase CT texture features revealed significant differences between SISTs and PSILs in multiple parameters (P < 0.05), including contrast, correlation, difference average, difference variance, energy, entropy, maximum correlation coefficient, joint maximum, sum average, sum entropy, sum of squares, autocorrelation coefficient, cluster prominence, cluster shade, cluster tendency, difference entropy, inverse difference moment (IDM), inverse difference (ID), inverse difference moment normalized (IDMN), inverse difference normalized (IDN), information correlation measures 1 and 2 (ICM1, ICM2), inverse variance, and joint average. These findings indicate distinct arterial-phase texture patterns between the two tumor types. Quantitative comparisons are provided in Table 2.
Venous-phase CT texture features
Venous-phase CT texture analysis similarly demonstrated statistically significant differences between SISTs and PSILs across multiple parameters, including contrast, correlation, and difference average and others. These results highlight distinct venous-phase texture patterns between the two tumor types. Detailed quantitative comparisons are presented in Table 3.
Development and diagnostic performance of predictive models
Due to multicollinearity among the statistically significant features and the large number of potential predictors, LASSO regression was initially applied for feature selection. The optimal λ values were as follows: CECT imaging features alone, 0.03942; arterial-phase texture features, 0.00146; venous-phase texture features, 0.02025; combined CECT with arterial-phase features, 0.00133; combined CECT with venous-phase features, 0.00051; comprehensive combination of all features, 0.00212.
As features selected via LASSO regression still exhibited pairwise correlations, principal component regression (PCR) was employed to construct predictive models. Reconstructed regression equations for each model were derived following PCR transformation. The selected features and corresponding regression coefficients are detailed in Table 4 and Figure 3.
Features selection via LASSO regression. 3-1. Radiomics feature dimensionality reduction via 10-fold cross-validated LASSO regression. 3-2. Radiomics feature coefficient path plot derived from LASSO regression model. 3-3. Venous-phase radiomics feature dimensionality reduction via 10-fold cross-validated LASSO regression. 3-4. Coefficient path plot of venous-phase radiomics features derived from LASSO regression 3-5. Arterial-phase radiomics features dimensionality reduction via 10-fold cross-validated LASSO regression. 3-6. Coefficient path plot of arterial-phase radiomics features derived from LASSO regression model. 3-7. Integrated radiomic and arterial phase features dimensionality-reduction via 10-fold cross-validated LASSO regression. 3-8. Coefficient-path plot of the integrated radiomic and arterial phase features derived from LASSO regression model. 3-9. Integrated radiomic and venousl phase features dimensionality-reduction via 10-fold cross-validated LASSO regression. 3-10. Coefficient-path plot of the integrated radiomic and arterial phase features derived from LASSO regression model. 3-11. Combined-model dimensionality-reduction via 10-fold cross-validated LASSO regression. 3-12. Coefficient-path plot of the combined-model derived from LASSO regression.
ROC analysis of predictive models
Receiver operating characteristic (ROC) curve analysis demonstrated excellent discriminative performance for all predictive models. The area under the curve (AUC) values for each model exceeded 0.9, with sensitivity and specificity also above 0.9, confirming strong diagnostic capability for differentiating SISTs from PSILs. Detailed ROC results and curves are presented in Table 5 and Figure 4.
ROC Curve.
Discussion
In this study, we evaluated the diagnostic performance of CECT combined with texture analysis in differentiating SISTs from PSILs. Multiple CT texture parameters demonstrated significant differences between the two tumor types. Previous studies have highlighted the utility of CT texture analysis in assessing clinical stage, prognosis, and treatment response across various gastrointestinal malignancies, including esophageal cancer (20), gastrointestinal stromal tumors (21, 22), and colorectal cancer (23, 24). Recent study demonstrated that CTTA outperforms conventional clinical and radiologic approaches in distinguishing SISTs from PSILs, and that integrating radiomic features with clinical or imaging data may further optimize predictive accuracy (25). Additionally, quantitative parameters derived from dual-energy spectral CT - such as iodine concentration, virtual monoenergetic imaging (VMI), and effective atomic number (Zeff) - have demonstrated high accuracy in differentiating primary small intestinal tumors (26, 27).
Accurate preoperative differentiation of SISTs from PSILs is clinically important due to distinct treatment strategies. SISTs typically present as exophytic, well-demarcated masses with heterogeneous enhancement resulting from necrosis, hemorrhage, or cystic degeneration. Complications including bleeding, perforation, obstruction, or metastasis can adversely affect the prognosis of patients with SISTs. In contrast, PSILs often manifest as long-segment circumferential wall thickening with homogeneous mild-to-moderate enhancement, preservation of fat planes, and aneurysmal luminal dilatation, frequently accompanied by mesenteric or retroperitoneal lymphadenopathy. Vascular invasion or occlusion is rare, despite frequent vessel encasement. However, overlapping imaging features - including atypical presentations lacking geographic appearance, target signs, aneurysmal dilation, sandwich sign, or floating vessel sign - render differentiation challenging. Conventional CECT diagnostic accuracy ranges from 70-80% for typical SISTs (28), indicating a need for improved diagnostic tools.
Texture analysis provides quantitative assessment of tissue heterogeneity, reflecting tumor microstructure and underlying biological characteristics that are not perceptible by conventional imaging (29). Recent studies have applied CT texture analysis to tumor identification, staging, and therapy response evaluation (30–33), but its application in differentiating SISTs from PSILs has not been previously reported. To our knowledge, this study is the first to employ CT texture analysis for this purpose. High-dimensional radiomic features inherently pose challenges such as multicollinearity and overfitting. To address this, we implemented a two-step dimensionality reduction strategy using LASSO regression followed by Principal Component Analysis (PCA). LASSO effectively identified non-redundant, discriminative features by imposing an L1 penalty, selecting parameters related to heterogeneity and structural complexity - including entropy, contrast, and variance-based measures. PCA subsequently transformed these features into orthogonal principal components (PCs), minimizing multicollinearity while maximizing explained variance. Retained PCs captured key aspects of tumor heterogeneity (entropy, contrast), uniformity (energy, homogeneity), and structural organization (cluster prominence, correlation).
Analysis of arterial-phase features revealed that SISTs exhibited higher contrast, entropy, and inverse difference moment (homogeneity), reflecting complex tissue architecture and intratumoral heterogeneity such as necrosis, hemorrhage, or solid components. Conversely, PSILs showed higher energy and homogeneity, indicating more uniform tissue patterns. Similar trends were observed in the venous phase, with additional parameters - including informational measures of correlation (IMC1 and IMC2) - highlighting differences in spatial organization and grayscale dependence between the two groups. These results support the value of combining LASSO and PCA to derive biologically meaningful and interpretable features from high-dimensional radiomic data.
Our results indicate that CECT imaging features alone can achieve good specificity but limited sensitivity in differentiating SISTs from PSILs. In contrast, arterial- and venous-phase texture analyses demonstrated high pooled sensitivity and specificity. The combined model incorporating imaging and texture features achieved a pooled sensitivity of 91.5% and specificity of 86.7%, underscoring the added value of texture analysis in enhancing diagnostic performance.
This study has several limitations that should be acknowledged. First, this was a single-center retrospective study with a relatively small sample size, the use of a single CT scanner, and a ununiform imaging acquisition protocol, which may introduce selection bias and limit generalizability. Multi-center studies with larger cohorts are needed to validate our findings. Second, while LASSO and PCA enhanced feature selection stability, overall model performance remains constrained by the cohort size. Future studies should externally validate these models across diverse populations. Third, the study lacks both internal and external validation of the developed model. Furthermore, the reliance on manual segmentation, without an assessment of inter-observer reliability or reproducibility, represents another potential source of bias. Finally, although our approach effectively addressed multicollinearity, the performance of alternative techniques (e.g., elastic net regression) was not explored; a comparative analysis of these methods represents an important direction for future research.
Conclusion
In summary, our findings suggest that CECT combined with texture analysis offers quantitative and reliable parameters for differentiating SISTs from PSILs. This approach enhances preoperative diagnostic accuracy and provides a novel framework for the clinical evaluation and management of intestinal tumors.
The reference list from the paper itself. Each links out to its DOI / PubMed record.
- 1von Mehren M Kane JM Riedel RF Sicklick JK Pollack SM Agulnik M. NCCN guidelines® insights: gastrointestinal stromal tumors, Version 2.2022. J Natl Compr Canc Ne. (2022) 20:1204–14. doi: 10.6004/jnccn.2022.0058, PMID: 36351335 PMC 10245542 · doi ↗ · pubmed ↗
- 2Wu CY Ye K. Laparoscopic surgical strategies for different sites of gastrointestinal stromal tumors. Chin J Operative Procedures Gen Surg (Electronic Edition). (2025) 19:224–7. doi: 10.3877/cma.j.issn.1674-3946.2025.02.028 · doi ↗
- 3Yuan Q Xiang WR Lv Y Yan ZZ Zhu HF Chen G. Study on prediction model of recurrence-free survival for gastrointestinal stromal tumors based on random survival forest. Chin J Operative Procedures Gen Surg (Electronic Edition). (2025) 19:438–41. doi: 10.3877/cma.j.issn.1674-3946.2025.04.023 · doi ↗
- 4Cao L Lin C Liu Y Sui C Li Z Chen L. Clinical characteristics and prognostic analysis of postoperative recurrence or metastasis of low-risk gastrointestinal stromal tumors. World J Surg Oncol. (2024) 22:65. doi: 10.1186/s 12957-024-03339-z, PMID: 38395931 PMC 10885449 · doi ↗ · pubmed ↗
- 5Li JX Sun L Chen S Guo YH Zhao S Shao B. Analysis of clinicopathological features, gene mutation characteristics and prognosis of 228 cases of primary gastrointestinal stromal tumor of small intestine. Chin J Dig. (2022) 42:171–9. doi: 10.3760/cma.j.cn 311367-20210810-00435 · doi ↗
- 6Liao XL Zhu YF Zhang WL Chen XL Liu K Zhao LY. Clinicopathological characteristics and prognosis of patients with small bowel tumors: A single center analysis of 220 cases. Chin J Gastrointestinal Surg. (2023) 26:467–74. doi: 10.3760/cma.j.cn 441530-20230228-00057, PMID: 37217355 · doi ↗ · pubmed ↗
- 7Li L Ma H Niu M Chen C Yu C Zhang H. Characterization of primary small intestinal lymphoma: a retrospective study based on double balloon endoscopy. BMC Gastroenterol. (2024) 24:116. doi: 10.1186/s 12876-024-03193-z, PMID: 38504190 PMC 10953079 · doi ↗ · pubmed ↗
- 8Kim EK Jang M Yang WI Yoon SO. Primary Gastrointestinal T/NK cell lymphoma. Cancers (Basel). (2021) 13. doi: 10.3390/cancers 13112679, PMID: 34072328 PMC 8199162 · doi ↗ · pubmed ↗