A meta-analysis of public RNA-Seq data identifies conserved stress responses in rainbow trout
Sayed Mashequl Bari, Muntasim Fuad, Md Jubayer Hossain, Ishtiaque Ahammad, Mahmuda Begum, Md Mostofa Uddin Helal

TL;DR
This study combines RNA-Seq data to find shared stress response genes in rainbow trout, revealing key pathways for improving aquaculture resilience.
Contribution
A meta-analysis of public RNA-Seq data identifies conserved stress response genes and pathways in rainbow trout.
Findings
1,006 differentially expressed genes were identified, with five commonly regulated under heat and hypoxia stress.
Key pathways include protein processing in the endoplasmic reticulum, p53-mediated cell-cycle arrest, and oxidative stress responses.
Gene ontology analysis linked stress responses to DNA metabolism, cell cycle, and membrane components.
Abstract
Rainbow trout (Oncorhynchus mykiss), a commercial aquaculture species, experiences physiological stress under environmental challenges. While several bulk RNA-Seq studies have investigated heat and hypoxic stress responses in rainbow trout, a comprehensive analysis identifying common genes and pathways is still lacking. This study addresses this need by analyzing four public RNA-Seq datasets from O. mykiss to identify conserved molecular responses to these stress. The meta-analysis identified 1,006 (555 upregulated and 451 downregulated) protein-coding differentially expressed genes (DEGs). Among them, five genes, cdkn1ba, znf395a, klf9, irs2b, and tsc22d3, were commonly regulated under both stress conditions, indicating their shared roles in cellular homeostasis. The meta-analysis revealed highly regulated heat shock protein (hsp) family genes and hypoxia-inducible factor (HIF) genes.…
Genes, proteins, chemicals, diseases, species, mutations and cell lines named across the full text — each resolved to its canonical identifier and authoritative record.
Click any figure to enlarge with its caption.
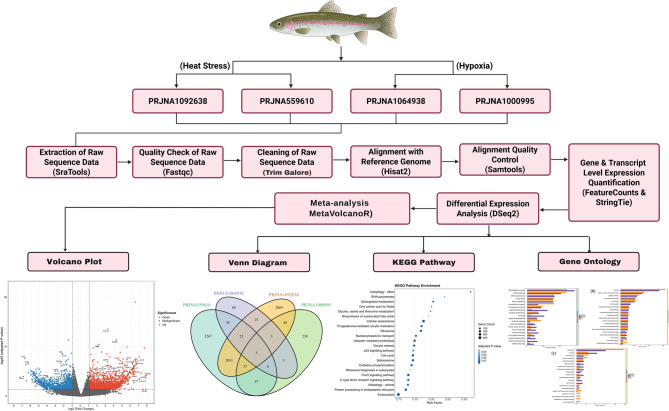 Figure 1
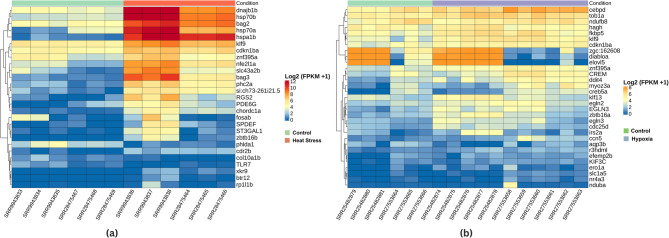 Figure 2
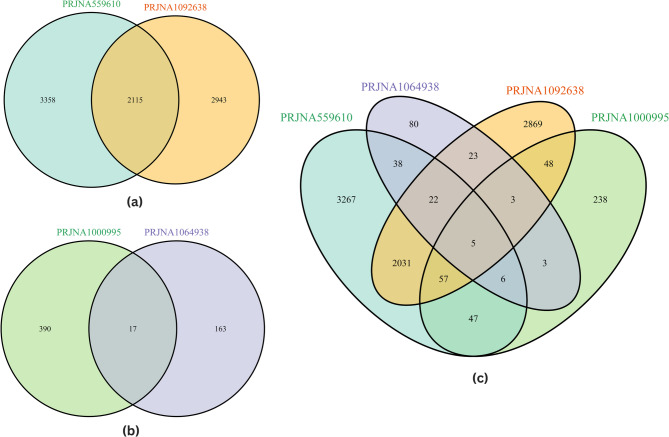 Figure 3
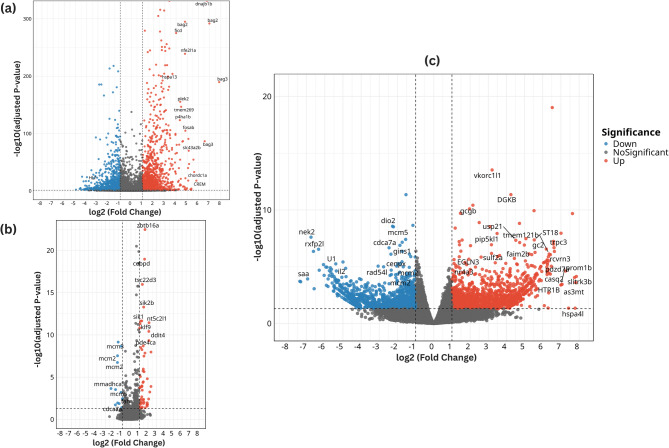 Figure 4
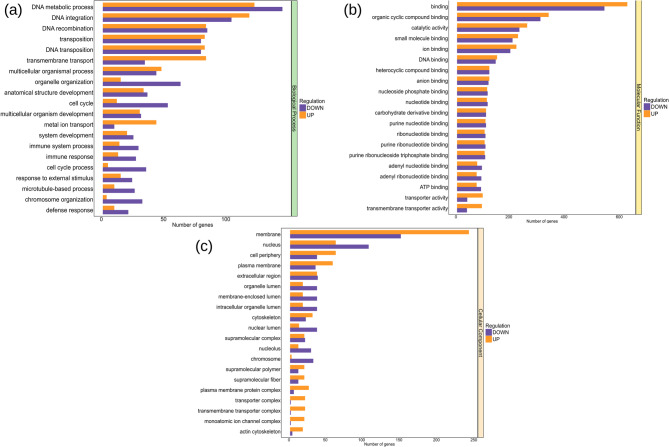 Figure 5
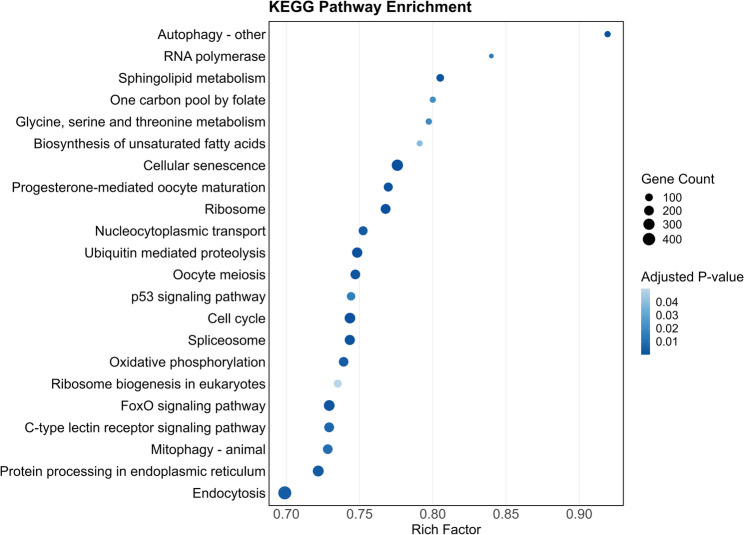 Figure 6
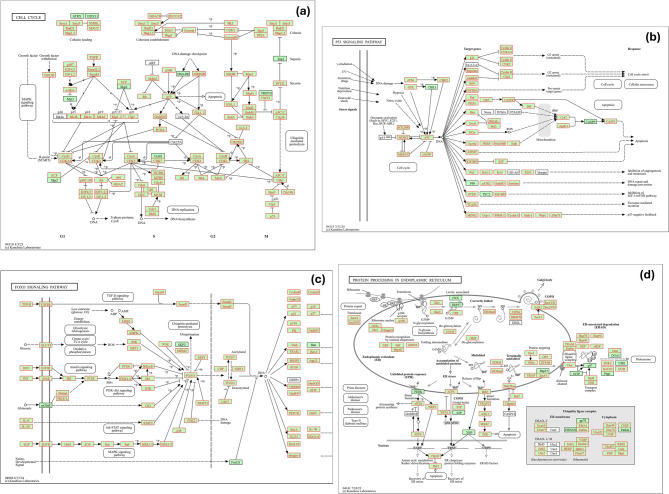 Figure 7
Peer Reviews
No public reviews on file for this paper yet. If you reviewed it on a platform where reviews are public (OpenReview, ICLR, NeurIPS, ICML), you can paste yours below so the community can read it here.
Videos
No videos yet. Explain this paper in a talk, walkthrough, or lecture? Add one.
Taxonomy
TopicsPhysiological and biochemical adaptations · Invertebrate Immune Response Mechanisms · Heat shock proteins research
Background
The rainbow trout (O. mykiss) is a cold-water aquaculture species with significant economic and ecological importance [1]. However, they are susceptible to abiotic stressors like heat [2] and hypoxia [3], which can negatively impact their physiology, immune function, and overall productivity. This species is widely farmed in freshwater environments across Europe and North America, thriving within a temperature range of 12–18 °C and requiring a dissolved oxygen level of approximately 8 mg/L for optimal health. However, when exposed to temperatures near 25 °C and dissolved oxygen levels below 4.5–3 mg/L, rainbow trout become vulnerable [4]. In recent decades, global warming and thermal shifts have presented significant challenges to commercial fish culture [5]. The increasing frequency of extreme heatwaves disrupts dissolved oxygen concentrations [6] and adversely affects fish growth, reproduction, and survival, heightening their susceptibility to both biotic and abiotic stressors [7, 8]. Rainbow trout are particularly at risk from climate change, seasonal fluctuations, and rising water temperatures in various aquaculture systems [9].
To cope with abiotic stress and maintain normal physiology, salmonid fishes like rainbow trout activate adaptive mechanisms primarily through gene expression [10]. In response to heat stress, they upregulate heat shock genes that encode various heat shock proteins (HSPs). For example, rainbow trout express hsp70 and hsp90 [11], while redband trout (Oncorhynchus mykiss gairdneri) express hsp47 alongside hsp70 and hsp90 [12] in response to thermal stress. Similarly, Atlantic salmon (Salmo salar) and Chinook salmon (Oncorhynchus tshawytscha) show upregulation of the hsp90a and serpinh1 genes [13, 14]. These HSPs basically act as molecular chaperones that ensure proper protein folding, prevent the aggregation of misfolded proteins, and assist in repairing or degrading damaged proteins [15]. Interestingly, these stress-induced proteins function either in independent or collaborative ways within various intracellular signaling pathways, including the protein and endoplasmic reticulum stress response [16], general metabolic processes [17], and cellular functions such as molecular binding and membrane integrity [18] in rainbow trout. In addition, fish survival under hypoxia depends on metabolic rate reduction and the activation of hypoxia-inducible genes, primarily regulated by hypoxia-inducible factors (HIFs) [19, 20]. In rainbow trout, adaptation to low-oxygen environments involves modulation of genes associated with changes in liver antioxidant metabolism, suppression of the cell cycle [21], inflammatory responses [10], and metabolic reprogramming [22].
The rainbow trout, often referred to as an aquatic lab rat, is a valuable model for various biological studies investigating stress responses [23]. Next-generation RNA-Seq serves as a powerful tool for examining stress-responsive DEGs , their encoded proteins, and the biological pathways involved in responses to thermal stress and anoxic conditions [24]. While several transcriptomic studies have explored the responses of rainbow trout to heat and hypoxia using high-quality Illumina sequencing, vary significantly in focus of experimental design, and data processing pipelines, which limit the reliability of cross-study comparisons. For example, Zhou et al. [25] identified lncRNA–mRNA regulatory pairs related to immune regulation, apoptosis, and metabolism under acute heat stress but limited their analysis to head kidney tissue and a single exposure duration. In another study, Sun et al. [26] reported numerous alternative splicing events in liver tissue under heat stress but did not evaluate their persistence across different conditions or individuals. Similarly, Wu et al. [27] examined metabolic and signaling changes during hypoxia and reoxygenation in the liver, while another study by Wu et al. [28] focused on lncRNA–miRNA–mRNA networks in hypoxia, emphasizing anaerobic metabolism and immune suppression; however, neither study incorporated heat stress responses.
Although these studies offer valuable insights, they often present divergent sets of DEGs with minimal overlap across conditions. To address these gaps, we conducted a systematic meta-analysis [29] of four publicly available RNA-Seq datasets involving heat and hypoxia exposure in rainbow trout. Our goal was to identify conserved DEGs and shared biological pathways that highlights general stress adaptation in this species, thereby providing new insights into the mechanisms of stress adaptation.
Methods
Gene expression data acquisition
Gene expression data related to heat stress and hypoxia were retrieved from the NCBI Gene Expression Omnibus (GEO) database (https://www.ncbi.nlm.nih.gov/geo/) [30]. To refine the search, we used keywords such as “rainbow trout,” “Oncorhynchus mykiss,” “heat stress,” “heat shock,” “thermal stress,” “heat-shock protein,” “hypoxia,” “hypoxic condition,” “anoxic condition,” and “anoxia,” along with the study type “expression profiling by high-throughput sequencing.” To ensure high quality and minimize technical bias, we selected RNA-Seq datasets from public repositories that were generated on the Illumina platform using fish weighing 200–400 g, collected under controlled conditions with at least three replicates, and were supported by metadata and detailed methodologies.
This meta-analysis incorporated four high-quality datasets: two heat stress and two hypoxic stress datasets. Each dataset was comprised of a minimum of three control samples and three to nine treatment samples. The four datasets (PRJNA1092638, PRJNA559610, PRJNA1064938, and PRJNA1000995) comprised 30 paired-end SRA samples, including 12 controls and 18 stress treatments. The anoxic samples were divided into chronic (4.5 mg/L oxygen) and acute (3 mg/L oxygen) groups, with controls at 8 mg/L. Heat stress samples were collected at 18 °C (control) and 24 °C (stress) after seven days. Detailed information on the RNA-Seq datasets, including the GEO ID, BioProject, SRA run, stress type, temperature, tissue, sampling duration, and the reference genome, is provided in Additional File 1: Table S1.
Data pre-processing
Raw fastq files from the Sequence Read Archive (SRA) were downloaded from NCBI GEO (https://www.ncbi.nlm.nih.gov/gds/) via SRAtools v3.2.1. Quality checks were performed with FastQC v0.12.1 [31], followed by trimming of low-quality bases and adapters via Trim Galore v0.6.3 (https://github.com/FelixKrueger/TrimGalore) and Cutadapt [32]. Cleaned reads were rechecked with FastQC and then aligned to the rainbow trout reference genome (Omyk_1.1) from Salmobase (https://salmobase.org/genomes/RainbowTrout/USDA_OmykA_1.1/overview) via HISAT2 v2.2.1 [33]. Sequence alignment files (SAM) were converted to sorted binary alignment files (BAM) with SAMtools v1.21 [34]. Transcript abundance was estimated with Stringtie v3.0.0 [35, 36], and FPKM (Fragments Per Kilobase of transcript per Million mapped reads) value was used to quantify transcript-level gene expression [37]. For differential expression analysis, read counts were obtained from sorted BAM files with Subread v2.0.8 (http://subread.sourceforge.net/), which were aligned against the OmykA_1.1 genomic annotation.
Differential gene expression analysis
Differential expression analysis was performed via the DESeq2 package (v1.30.1) in R 4.0.5 [38] (https://bioconductor.org/packages/release/bioc/html/DESeq2.html), and the negative binomial model was applied to normalize the raw read counts. Low-count genes were removed via DESeq2 default independent filtering. DEGs with adjusted P values < 0.05 (Benjamini‒Hochberg correction) and |log_2_FC| >1 were identified in each dataset. The surrogate variable analysis (SVA) using the R package sva (v3.50.0) were used to reduce potential batch effects. Principal Component Analysis (PCA) was performed on the expression matrices before and after batch effect removal to verify the effectiveness of batch effect corrections (Supplementary Figure S1). Shared and unique DEGs across the heat stress and hypoxia datasets were visualized via the VennDiagram package (v1.7.3) [39] (https://github.com/uclahs-cds/package-VennDiagram). To visualize the transcript level expression patterns, heatmaps were generated with ComplexHeatmap (v2.15.4) [40] (https://bioconductor.org/packages/release/bioc/html/ComplexHeatmap.html) via log_2_(FPKM + 1) transformed values. This transformation stabilized the variance and reduced the impact of zero-count values. The expression matrices were subsets to include only DEGs identified under each condition (adjusted P value < 0.05, |log_2_FC| >1). Hierarchical clustering was performed via Euclidean distance and complete linkage, with samples annotated by treatment.
Meta-analysis
A meta-analysis was performed via MetaVolcanoR (v1.4.0) (https://github.com/csbl-usp/MetaVolcanoR) to integrate DEG results across the four datasets. The random effect model (REM) was applied to combine log_2_(fold changes) while accounting for variance, generating summary p values. For the heat and hypoxia datasets, Fisher’s method was used to combine adjusted p values. The top 1% of the most consistently perturbed genes were identified via the ‘metathr’ parameter. Ensembl gene IDs for O. mykiss were annotated with the biomaRt (v3.21) (https://bioconductor.org/packages/release/bioc/html/biomaRt.html) R package. DEGs were defined as those with adjusted P < 0.05 and |log_2_FC| >1. Genes with log_2_FC >1 were considered significantly upregulated, whereas those with log_2_FC < − 1 were classified as significantly downregulated. Volcano plots were generated via ggplot2 (v3.5.2) (https://ggplot2.tidyverse.org/) [41] to visualize significant genes.
Gene ontology (GO) enrichment analysis
The GO enrichment analysis of DEGs was performed using the GO database (http://www.geneontology.org) [42] via the g:Profilerv(0.2.3) R package (https://cran.r-project.org/web/packages/gProfileR/index.html) [43]. GO terms with an adjusted p value < 0.05, corrected by the Benjamini–Hochberg false discovery rate (FDR) [44], were considered statistically significant.
KEGG pathway enrichment analysis
The Kyoto Encyclopedia of Genes and Genomes (KEGG) database (http://www.genome.jp/kegg/pathway.html) [45] was used for the DEG pathway analysis. The clusterProfiler (https://bioconductor.org/packages/release/bioc/html/clusterProfiler.html) R package was used to test the statistical enrichment of DEGs in KEGG pathways. Pathways with an adjusted p value < 0.05 (Benjamini‒Hochberg (BH) corrected) were used as a threshold for significantly enriched pathways.
Results
Retrieved RNA-Seq datasets
To investigate the transcriptomic responses of O. mykiss, four publicly available RNA-Seq datasets derived from liver and muscle tissues exposed to heat and hypoxic stress were curated and analyzed (Table 1). These datasets were retrieved from the NCBI Sequence Read Archive (SRA) and subjected to a standardized meta-analysis pipeline (Fig. 1). The selected datasets included two heat stress experiments (PRJNA1092638 and PRJNA559610) and two hypoxia related experiments (PRJNA1064938 and PRJNA1000995), each comprising six to nine samples. The rainbow trout reference genome OmykA_1.1_genomic.fna and gene set OmykA_1.1_genomic.gff, including 64,494 coding and noncoding genes, were used for expression quantification. The detailed information of RNA-Seq datasets, including GEO ID, Bio Project, SRA run, stress type, temperature, tissue, sampling duration, and reference genome, are provided in supplementary table S1.Table 1RNA-Seq meta-analysis datasets in response to heat and hypoxia stress in rainbow troutBio ProjectAccession NumberBiological CharacteristicsTechnical CharacteristicsReferencesBatch IDSample IDTissueWeight(gm)ConditionTimePlatformReference GenomePRJNA1092638GSE262612GSM8172384Liver40018 °C7 daysIllumina NovaSeq 6000Omyk_1.1[46], [47]GSM8172385Liver40018 °C7 daysGSM8172386Liver40018 °C7 daysGSM8172387Liver40024 °C7 daysGSM8172388Liver40024 °C7 daysGSM8172389Liver40024 °C7 daysPRJNA559610GSE135668GSM4025692Liver20018 °C7 daysIllumina HiSeq 4000[27]GSM4025693Liver20018 °C7 daysGSM4025694Liver20018 °C7 daysGSM4025695Liver20024 °C7 daysGSM4025696Liver20024 °C7 daysGSM4025697Liver20024 °C7 daysPRJNA1064938GSE253274GSM8017523Muscle2004.5 mg/L12 hIllumina NovaSeq 6000NAGSM8017524Muscle2004.5 mg/L12 hGSM8017525Muscle2004.5 mg/L12 hGSM8017526Muscle2003 mg/L12 hGSM8017527Muscle2003 mg/L12 hGSM8017528Muscle2003 mg/L12 hGSM8017529Muscle2008.5 mg/L12 hGSM8017530Muscle2008.5 mg/L12 hGSM8017531Muscle2008.5 mg/L12 hPRJNA1000995GSE239806GSM7673627Liver2004.5 mg/L12 hIllumina HiSeq 4000[48]GSM7673628Liver2004.5 mg/L12 hGSM7673629Liver2004.5 mg/L12 hGSM7673630Liver2003 mg/L12 hGSM7673631Liver2003 mg/L12 hGSM7673632Liver2003 mg/L12 hGSM7673633Liver2008.5 mg/L12 hGSM7673634Liver2008.5 mg/L12 hGSM7673635Liver2008.5 mg/L12 hFig. 1Meta-analysis workflow to investigate high-quality RNA-Seq datasets of rainbow trout
Expression profiling under stress conditions
To examine transcript-level responses to heat and hypoxic stress, two heatmaps (Fig. 2) were generated using log2(FPKM + 1) values across 30 samples. FPKM (Fragments Per Kilobase of transcript per Million mapped reads) is a normalization method in RNA-seq that accounts for gene length and sequencing depth, enabling accurate comparison of expression levels across genes and samples. Hierarchical clustering was performed on both genes and samples, as shown by the dendrograms above each heatmap, to assess whether samples group by treatment as expected. Under heat stress (Fig. 2a), a distinct cluster of genes, including dnajb1b, hsp70a/b, hspa1b, and bag2/3, exhibited strong upregulation compared to controls, indicating a classical heat shock response. Notably, the dendrogram shows clear and robust clustering of samples by treatment group: all heat-stressed samples (orange) form a cohesive cluster that is distinctly separated from the control samples (green). This demonstrates that the heat stress treatment is the primary driver of gene expression variation in these samples.
In response to hypoxia (Fig. 2b), genes such as cebpd, egln2/3, klf9, and cdkn1ba were notably upregulated, with hypoxia-treated samples (purple) and control samples (green) forming predominantly distinct clusters in the dendrogram. However, clustering by treatment in the hypoxia group shows slightly more heterogeneity than in the heat stress group; one or two samples do not strictly segregate according to treatment. This minor overlap may be due to inherent biological variability among individuals, variation in treatment response, or technical factors such as differences in RNA quality or sequencing depth. Such imperfect clustering is not uncommon in transcriptomics studies and does not affect the observation that treatment is the major source of expression variation. A complete list of FPKM values for all expressed genes across the samples is provided in Supplementary Table S2.Fig. 2. Heatmap showing log₂(FPKM + 1) expression levels across samples. A Samples are color coded as green (control) or orange (heat stress) B samples are color coded as green (control) or purple (hypoxia). Genes were hierarchically clustered on the basis of expression similarity, revealing distinct transcriptional profiles between the control and stress groups
Venn diagram of cumulative differential gene expression
Venn diagram analysis (Fig. 3) revealed both unique and overlapping patterns of DEGs across the heat and hypoxia stress datasets. A comparison of the two heat stress datasets (PRJNA559610 and PRJNA1092638) revealed that 2,115 DEGs were shared, whereas 3,358 and 2,943 DEGs were uniquely expressed in PRJNA559610 and PRJNA1092638, respectively (Fig. 3a), suggesting both conserved and dataset-specific responses to heat stress. For the hypoxia datasets (PRJNA1000995 and PRJNA1064938), only 17 overlapping DEGs were identified, with 390 and 163 DEGs unique to each dataset, respectively (Fig. 3b), indicating a more divergent transcriptional response under hypoxia. The integrated venn diagram (Table 2; Fig. 3c) revealed five DEGs (cdkn1ba, znf395a, klf9, irs2b, and tsc22d3) that were commonly found across all four stress conditions. A detailed list of combined intersecting genes is provided in supplementary table S3.Table 2. Commonly expressed genes among the four RNA-seq datasetsSNEnsemble IDGene Symbol AnnotationAdj PAverage_Log_2_FCEffect1ENSOMYG00000017016cdkn1baCyclin dependent Kinase inhibitor 1ba1.94568E-101.469990741Up2ENSOMYG00000022552znf395aZinc finger protein 3956.04783E-081.397240041Up3ENSOMYG00000028743klf9Kruppel like factor 98.05094E-111.965697087Up4ENSOMYG00000045565irs2binsulin receptor substrate 2b5.66E-111.479284258Up5ENSOMYG00000059646tsc22d3TSC22 domain family member 31.68E-2000.643931804UpFig. 3Venn diagrams illustrating the shared DEGs under thermal and hypoxic stress conditions. A Overlap of DEGs between two thermal stress RNA-Seq datasets (PRJNA559610 in greenish-blue and PRJNA1092638 in orange) B overlap of DEGs between two hypoxic stress RNA-Seq datasets (PRJNA1000995 in light green and PRJNA1064938 in purple), and C comprehensive four-set venn diagram combining both thermal (PRJNA559610 and PRJNA1092638) and hypoxic (PRJNA1000995 and PRJNA1064938) stress datasets. All genes included had an adjusted p value < 0.05 and an absolute log₂-fold change > 1
Meta-analysis of cumulative transcriptome data
Meta-analysis of the top 40 DEGs (20 upregulated and 20 downregulated; Table 3) revealed shared molecular responses to heat and hypoxia stress in rainbow trout. From the complete dataset, a total of 1,006 annotated DEGs were identified, including 555 upregulated and 451 downregulated genes. Among the top 20 upregulated genes were hspa1b, hspa4l, and hk2, reflecting enhanced proteostasis and glycolytic reprogramming. Additionally, the upregulation of scn1ba, trpc3, and casq2 suggested increased ion transport and calcium handling, potentially supporting cellular excitability and survival under thermal and hypoxic challenges. In contrast, several genes, including saa, nek2, lin28b, and pgm3, were significantly downregulated, implying the suppression of immune responses, cell cycle progression, and metabolic activity. The complete list of DEGs can be found in supplementary table S4.Table 3. List of the top DEGs identified in the meta-analysis. Each row represents a gene with its unique ensemble gene ID, gene symbol, log_2_-fold change (log_2_FC), adjusted p value (adj. P), direction of regulation (up or down), and a brief gene descriptionSNGene IDGeneSymbollog2FoldChangeadj.PRegulationGene Description1.ENSOMYG00000029610scn1ba20.723759031.0585E-25UPsodium channel, voltage-gated, type I, beta a2.ENSOMYG00000010447hspa1b8.1345925880.041275173UPheat shock protein family A (Hsp70) member 1B3.ENSOMYG00000005025slitrk3b7.8491976117.18516E-05UPSLIT and NTRK-like family, member 3b4.ENSOMYG00000034757hspa4l7.419213130.044692546UPheat shock protein 4 like5.ENSOMYG00000029994as3mt7.0633156890.000354443UParsenite methyltransferase6.ENSOMYG00000054931prom1b7.0093405740.000393343UPprominin 1 b7.ENSOMYG00000023837HTR1B7.0000907940.000400397UP5-hydroxytryptamine receptor 1B8.ENSOMYG00000036455trpc36.618117212.103E-07UPtransient receptor potential cation channel, subfamily C, member 39.ENSOMYG00000018660casq26.4166150994.40883E-05UPcalsequestrin 210.ENSOMYG00000062678tmem121b6.3526641257.66057E-07UPtransmembrane protein 121B11.ENSOMYG00000021686pdzd7a6.2571844266.36944E-06UPPDZ domain containing 7a12.ENSOMYG00000044394rcvrn36.2494109644.76288E-06UPrecoverin 313.ENSOMYG00000001466gc26.1938892962.77611E-07UPguanylyl cyclase 214.ENSOMYG00000053172prom1b6.1359623953.72423E-06UPprominin 1 b15.ENSOMYG00000032225hk25.8329013660.000132129UPhexokinase 216.ENSOMYG00000015551CA125.6379900860.001021395UPcarbonic anhydrase 1217.ENSOMYG00000015268SORCS15.5914897140.001138484UPsortilin related VPS10 domain containing receptor 118.ENSOMYG00000068944rbp1.15.5835884165.1952E-05UPretinol binding protein 1, cellular, tandem duplicate 119.ENSOMYG00000043818PURG5.5643999420.000107922UPpurine rich element binding protein G20.ENSOMYG00000025223ST185.5318577224.34161E-08UPST18 C2H2C-type zinc finger transcription factor21.ENSOMYG00000019786alx1−4.6029107980.014122604DOWNALX homeobox 122.ENSOMYG00000054259mettl25−4.6305523290.002410291DOWNmethyltransferase like 2523.ENSOMYG00000020940pgm3−4.6429768580.005804978DOWNphosphoglucomutase 324.ENSOMYG00000000542LIN28B−4.6586824990.006284585DOWNlin-28 homolog B25.ENSOMYG00000037656zgc:162,592−4.7589097380.000945816DOWNzgc:162,59226.ENSOMYG00000005318hs3st3l−4.7637249810.004096918DOWNheparan sulfate (glucosamine) 3-O-sulfotransferase 3-like27.ENSOMYG00000043108slc45a1−4.7814197830.000318668DOWNsolute carrier family 45 member 128.ENSOMYG00000031339atp2b3a−4.9105121580.007065779DOWNATPase plasma membrane Ca2 + transporting 3a29.ENSOMYG00000053698gng3−5.1731257240.00049838DOWNguanine nucleotide binding protein (G protein), gamma 330.ENSOMYG00000064868MINAR1−5.313775750.000166115DOWNmembrane integral NOTCH2 associated receptor 131.ENSOMYG00000061140tmtops3a−5.3260370770.002432341DOWNteleost multiple tissue opsin 3a32.ENSOMYG00000010229hsd17b2−5.3559426180.000142353DOWNhydroxysteroid (17-beta) dehydrogenase 233.ENSOMYG00000067015nphs1−5.3639979980.000160952DOWNNPHS1 adhesion molecule, nephrin34.ENSOMYG00000018854ebpl−5.4447517470.000109371DOWNEBP like35.ENSOMYG00000003145cryba4−5.4849702087.34676E-05DOWNcrystallin, beta A436.ENSOMYG00000018645aqp8b−5.504155040.000548403DOWNaquaporin 8b37.ENSOMYG00000024267adorb1a−5.5960012610.000272998DOWNadenosine receptor B1a38.ENSOMYG00000014689rxfp2l−6.3445294872.8946E-07DOWNrelaxin family peptide receptor 2, like39.ENSOMYG00000000907nek2−6.7602712772.50056E-08DOWNNIMA-related kinase 240.ENSOMYG00000061342saa−6.9472944660.000118632DOWNserum amyloid A
The volcano plot analysis in Fig. 4 offers a visual snapshot of differential gene expression, summarizing both the magnitude and significance of gene regulation across conditions. In the heat stress analysis (Fig. 4a), genes such as dnajb1b, hspa13, fosab, bag2, and chordc1a were upregulated, underscoring their key roles in protein folding and cellular stress management. Under hypoxic stress (Fig. 4b), highly expressed upregulated genes included ddit4, tsc22d3, klf9, and cebpd, reflecting crucial adaptive mechanisms to low oxygen availability. The cumulative meta-analysis volcano plot (Fig. 4c), which integrates data from multiple tissues and both stress conditions, revealed a broader and more consistent set of regulated genes, highlighting hspa4l, trpc3, casq2, prom1b, and htr1b as among the most significantly upregulated. This pattern reinforces the importance of heat shock proteins, calcium signaling, and neural processes in rainbow trout’s stress resilience. Whereas, several genes, including saa (inflammation suppression), nek2, mcm5 (cell cycle inhibition), and dio2 (thyroid hormone regulation), were strongly downregulated.Fig. 4. Volcano plots illustrating DEGs in rainbow trout (O. mykiss) under heat and hypoxic stress. Each plot presents the log₂ fold change (x-axis) against the –log₁₀ adjusted p-value (y-axis) A combined analysis of two heat stress datasets B combined analysis of two hypoxia stress datasets; and C cumulative analysis of all four datasets. Significantly upregulated genes (log₂FC > 1, adjusted p < 0.05) are shown in red, downregulated genes (log₂FC < − 1, adjusted p < 0.05) are shown in blue, and non-significant genes are shown in gray
Gene ontology (GO) analysis
Gene Ontology (GO) enrichment analysis of the DEGs revealed distinct patterns of biological adaptation under heat and hypoxia stress in rainbow trout liver and muscle tissues (Fig. 5; Table 4). The combined DEGs included 123 “biological processes,” 48 “cell components,” and 79 “molecular functions” terms. A complete list of 250 terms is provided in supplementary table S5.Table 4. List of the top 30 gene ontology (GO) terms enriched in the meta-analysis of the four RNA-seq datasetsSNGO IDGO Term DescriptionGO SourceGenes of GO Term Present in DataAdjust *p-value1.GO:0006259DNA metabolic processBP2605.497552e-042.GO:0015074DNA integrationBP2164.194433e-023.GO:0006310DNA recombinationBP1637.567125e-034.GO:0032196transpositionBP1571.334342e-025.GO:0006313DNA transpositionBP1571.334342e-026.GO:0055085transmembrane transportBP1148.257490e-037.GO:0032501multicellular organismal processBP886.289251e-038.GO:0006996organelle organizationBP753.105766e-039.GO:0048856anatomical structure developmentBP674.743953e-0210.GO:0007049cell cycleBP627.558401e-1311.GO:0005488bindingMF11512.556815e-1312.GO:0097159organic cyclic compound bindingMF6342.905729e-0713.GO:0003824catalytic activityMF4804.562375e-0314.GO:0036094small molecule bindingMF4221.953388e-0515.GO:0043167ion bindingMF4083.171005e-0516.GO:0003677DNA bindingMF2852.905729e-0717.GO:1,901,363heterocyclic compound bindingMF2343.930839e-0618.GO:0043168anion bindingMF2311.237496e-0619.GO:1,901,265nucleoside phosphate bindingMF2201.953388e-0520.GO:0000166nucleotide bindingMF2191.958613e-0521.GO:0016020membraneCC3878.785775e-1722.GO:0005634nucleusCC1662.907332e-0223.GO:0071944cell peripheryCC973.601206e-0624.GO:0005886plasma membraneCC915.200871e-0625.GO:0005576extracellular regionCC731.857881e-0526.GO:0070013intracellular organelle lumenCC539.636450e-0427.GO:0043233organelle lumenCC539.636450e-0428.GO:0031974membrane-enclosed lumenCC539.636450e-0429.GO:0005856cytoskeletonCC512.194427e-0330.GO:0031981nuclear lumenCC489.040712e-04 BP Biological process, MF Molecular function, CC Cellular functionFig. 5Gene Ontology (GO) enrichment analysis of DEGs under heat and hypoxia stress in rainbow trout. The analysis results were categorized into A biological processes (BP), B molecular functions (MF), and C cellular components (CC) categories. Bars represent the number of significantly upregulated (orange), and downregulated (purple) genes associated with each GO term. Only the top enriched GO terms with adjusted p-values < 0.05 are displayed for each category
Among them, the most biologically relevant and statistically significant term was the cell cycle (GO:0007049), which is highly enriched and reflects a core disruption in cellular proliferation, likely due to stress-induced growth arrest or DNA repair (Fig. 5a). Similarly, DNA metabolic process (GO:0006259) and DNA recombination (GO:0006310) terms indicate increased genomic maintenance activity, suggesting that heat and hypoxia trigger DNA damage responses and repair pathways essential for cell survival. The enrichment of transmembrane transport (GO:0055085) points to altered membrane dynamics, potentially related to the ionic and nutrient balance critical during oxygen limitation. In terms of molecular function (Fig. 5b), binding (GO:0005488) and catalytic activity (GO:0003824) are associated with an increase in enzymes and molecular interactions, which is consistent with metabolic adjustments under stress. The term “membrane” (GO:0016020) from the cellular component category (Fig. 5c) emphasized structural and signaling modifications likely associated with cell environment interactions during hypoxia and thermal stress.
KEGG pathway analysis
Integrated analysis of heat and hypoxia stress responses in rainbow trout revealed 22 significantly enriched KEGG pathways (Fig. 6; Table 5), highlighting the coordinated cellular mechanism underlying the adaptation to combined environmental stressors. Cellular senescence (Rich factor = 0.776, p.adjust = 1.7E-07), p53 signaling (0.744, 0.01643), and the cell cycle pathway (0.743, 0.00051) collectively indicated the activation of cell cycle arrest and damage control mechanisms. FoxO signaling (0.729, 0.00167) further supported a shift toward stress resistance and survival pathways. Additionally, the increase in oxidative phosphorylation (0.739, 0.00401) suggested the involvement of mitochondria in energy adaptation under hypoxia, whereas protein processing in the endoplasmic reticulum (0.722, 0.00347) reflects the activation of the unfolded protein response to maintain proteostasis under thermal stress. A detailed list of significantly enriched KEGG pathways identified from the meta-analysis is provided in supplementary table S6.Fig. 6KEGG pathway enrichment analysis of DEGs under heat and hypoxia stress in rainbow trout (O. mykiss). The bubble plot shows the most significantly enriched KEGG pathways. The y-axis lists the enriched pathways, and the x-axis represents the rich factor (the ratio of differentially expressed genes to total genes in a pathway). The bubble dot size corresponds to the number of DEGs involved in each pathway, and the color intensity represents the adjusted p-value, with darker shades indicating greater statistical significance
Table 5KEGG pathway enrichment analysis of DEGs. The table lists significantly top enriched biological pathways based on the KEGG databaseIDDescriptionGeneRatioRichFactorp.adjustCountomy04136Autophagy - other57/88970.919352.7E-0557omy03020RNA polymerase42/88970.840.0142342omy00600Sphingolipid metabolism95/88970.805080.0011295omy00670One carbon pool by folate56/88970.80.0209256omy00260Glycine, serine and threonine metabolism59/88970.79730.0197159omy01040Biosynthesis of unsaturated fatty acids53/88970.791040.0388453omy04218Cellular senescence308/88970.775821.7E-07308omy04914Progesterone-mediated oocyte maturation157/88970.769610.00082157omy03010Ribosome205/88970.767790.00014205omy03013Nucleocytoplasmic transport155/88970.752430.00347155omy04120Ubiquitin mediated proteolysis232/88970.748390.00051232omy04114Oocyte meiosis195/88970.747130.00158195omy04115p53 signaling pathway128/88970.744190.01643128omy04110Cell cycle255/88970.743440.00051255omy03040Spliceosome223/88970.743330.00112223omy00190Oxidative phosphorylation187/88970.739130.00401187omy03008Ribosome biogenesis in eukaryotes111/88970.73510.0495111omy04068FoxO signaling pathway264/88970.729280.00167264omy04625C-type lectin receptor signaling pathway202/88970.729240.00716202omy04137Mitophagy - animal193/88970.72830.0098193omy04141Protein processing in endoplasmic reticulum275/88970.721780.00347275omy04144Endocytosis462/88970.698940.00401462
The GO enrichment of DNA metabolic process (GO:0006259, adj. p = 5.5 × 10⁻⁴) and cell cycle (GO:0007049, adj. p = 7.6 × 10⁻¹³) closely aligns with KEGG pathways such as Cell cycle (omy04110, adj. p = 5.1 × 10⁻⁴), p53 signaling (omy04115), and FoxO signaling (omy04068), indicating coordinated regulation of genome maintenance and cell division. Similarly, GO terms for nucleotide binding and membrane organization correspond to KEGG pathways for RNA polymerase (omy03020), spliceosome (omy03040), oxidative phosphorylation (omy00190), and endocytosis (omy04144), highlighting the link between transcription, protein synthesis, energy production, and intracellular transport during stress adaptation.
Furthermore, to gain mechanistic insight into the most affected biological processes, Fig. 7 depicts four interconnected well-established signaling pathways: (a) the cell cycle, (b) the p53 signaling pathway, (c) the FoxO signaling pathway and (d) protein processing in endoplasmic reticulum. In the cell cycle (Fig. 7a), stress activates checkpoints at G1/S and G2/M phases by regulating key genes like cdkn1a (p21) and cyclins, delaying division to preserve genomic integrity. The p53 pathway (Fig. 7b) triggers DNA damage responses through effectors such as p21 and gadd45, causing cell cycle arrest or apoptosis. Meanwhile, FOXO transcription factors (Fig. 7c) induce autophagy genes like bnip3 and atg12 under nutrient and oxidative stress, controlled by kinases AMPK, JNK, and Akt. In parallel, the ER stress and unfolded protein response (UPR) pathways, including the ER-associated degradation (ERAD) system, are activated (Fig. 7d), with chaperones such as BiP (Hsp70), Hsp40, and Hsp90 upregulated to refold or degrade misfolded proteins.Fig. 7KEGG pathway maps of the four interconnected enriched pathways in response to heat and hypoxia stress in rainbow trout. Differentially expressed genes (DEGs), highlighted in red boxes, were identified through the meta-analysis and mapped onto four major signaling pathways A Cell cycle, B p53 signaling pathway, C FoxO signaling pathway, and D Protein processing in endoplasmic reticulum
Discussion
The study revealed several key molecular chaperones, including hspa1b, hspa4l, hspb3, serpinh1b, dnajb13, and hsf4, were consistently upregulated across datasets representing thermal and hypoxic challenges in O. mykiss. These genes belong to the hsp70, hsp40, small hsp, serpin, and hsf families, indicating a conserved proteostasis mechanism [48]. Specifically, both hspa1ba and hspa4l, which are part of the Hsp70/110 gene family, were found to be upregulated at the transcript and protein levels in liver and head kidney tissues during heat stress [49, 50]. The consistent upregulation of serpinh1b in the liver of rainbow trout suggests its protective role in maintaining extracellular matrix stability and facilitating tissue repair under thermal and pathogenic stress [51]. Additionally, functional studies in zebrafish demonstrate that hsf4 is crucial for tissue-specific proteostasis rather than for early embryonic lens formation [52]. The persistent upregulation of these chaperones underscores their central role in managing protein misfolding and reducing cellular damage in response to multifactorial environmental stress in O. mykiss, with similar patterns observed in zebrafish [53], mrigal [54], atlantic cod [55], yellow croaker [56], and goldfish [57]. The study also revealed hypoxia-responsive genes such as egln3, bnip3, hk2, pfkfb3, and glut1a reflect the activation of HIF-mediated metabolic pathways under stress [58]. In O. mykiss, egln3, an oxygen-sensing prolyl hydroxylase, is broadly expressed under normal conditions but downregulated by hypoxic condition in most tissues [59], where glut1a, a key glucose transporter, is upregulated to enhance cell viability [60]. In contrast, saa and nek2 were found as most down regulated genes, reflecting suppressed acute-phase immunity [61] and cell cycle activity [62]. The suppression of the acute-phase gene saa indicates an energy trade-off during prolonged stress, prioritizing essential metabolic and protective functions over immune defense.
The meta-analysis identified that the genes cdkn1b, znf395a, and klf9 were differentially expressed across all four datasets. Cdk inhibitors, such as cdkn1b (p27), enforce cell cycle arrest at the G1/S checkpoint, allowing time for DNA repair [63, 64]. Its upregulation in Tor putitora during heat stress highlights its role in thermotolerance and prevention of apoptosis [65]. In zebrafish, cdkn1c is regulated by Hedgehog signaling, which coordinates stress-induced differentiation with Myod during development [66]. Znf395a functions as a hypoxia-inducible transcription factor with zinc finger domains that regulate stress-responsive gene expression [67]. Its expression under cyclic and chronic hypoxia contributes to inflammation [68], tumor survival [69], and interacts with the HIF-1α [70] and NF-κB signaling pathways [71, 72], reinforcing its role in the stress-adaptive transcriptional network. Lastly, klf9, a conserved stress-responsive transcription factor, modulates development, apoptosis, and glucocorticoid signaling in response to oxidative and environmental stimuli [73]. Among these genes, knocking out cdkn1ba could clarify its specific role in cellular homeostasis and stress adaptation.
Pathway enrichment analysis reveals interconnected regulatory hubs, including p53 signaling, the cell cycle, and cellular senescence, which coordinate cellular stress responses by directing cell fate toward repair, apoptosis, or senescence. The enriched p53 signaling pathway is a central regulator of cell cycle arrest and apoptosis during DNA damage [74], which aligns with in vitro findings identifying p53 and γH2AX as sensitive biomarkers of genotoxic stress in O. mykiss [75]. This role of p53 is further supported across species, being activated by miR-34a under hypoxia in genetically improved tilapia [76], linked to cold stress responses in large the yellow croaker [77], and associated with disease resistance via cd82a-mediated regulation [78], highlighting its conserved importance in fish stress adaptation and immune defense. Following the activation of these core mechanisms, the enrichment of both the cell cycle and cellular senescence pathways indicates that stress first slows cell division through checkpoint arrest [79], and if damage continues, cells shift into a senescent state [80] to prevent further genomic instability [81], which eliminates damaged cells during development or environmental stress [82, 83]. In rainbow trout hepatocytes, senescence-like features have been observed under chronic chemical exposure [84]. The results of zebrafish further support its role in regeneration and adaptation to oxidative stress [85, 86]. Senescence also intersects with membrane dynamics and phospholipid remodeling, which are essential under temperature stress [87]. Moreover, the significant presence of protein processing in the endoplasmic reticulum and endocytosis pathways highlights the mechanisms that maintain proteostasis during heat-induced protein unfolding. Under thermal stress, rainbow trout liver cells activate ER-associated degradation (ERAD) and upregulate the expression of chaperones, ERAD components, and UPR genes to eliminate misfolded proteins and maintain cellular homeostasis [88]. Endocytosis, particularly fluid-phase endocytosis, is highly temperature sensitive but compensates in rainbow trout hepatocytes by modifying membrane lipids and vesicle trafficking proteins [89]. This ensures continuous nutrient and signal uptake across acclimation states, underscoring the importance of membrane remodeling in maintaining cellular function under thermal stress [90].
Another enriched FoxO signaling pathway involved in regulating autophagy, apoptosis, cell cycle arrest, and metabolic adaptation [91, 92]. FOXO transcription factors are primarily activated under stress rather than normal physiological conditions, enabling cells to maintain homeostasis during environmental and metabolic challenges [93]. In mammals, the link between FoxO signaling and autophagy is multifaceted; for example, FOXO3 can enhance FOXO1-driven autophagy via PIK3CA–AKT1 signaling [94], while acetylated FOXO1 directly interacts with atg7 to promote autophagic flux independent of transcription during hypoxia [95]. In fish, hypoxia-induced oxidative stress promotes autophagy in grass carp hepatocytes by inhibiting Akt phosphorylation and activating the FoxO1 pathway [96]. In skeletal muscle, FOXO3 initiates both lysosomal autophagy and proteasomal degradation, with bnip3 as a key effector independent of the proteasome [97, 98]. Similarly, FOXO1/3 reduce cardiomyocyte size under glucose starvation or ischemia by inducing autophagy through sirt1 and rab7a signaling [99]. These mechanisms highlight the conserved role of FOXO in regulating autophagy during metabolic stress [100, 101]. Moreover, In ectothermic species, FoxO signaling also integrates metabolic and apoptotic responses under temperature stress: cold exposure in zebrafish and tilapia reveals species-specific regulation of apoptosis via a FoxO-centered network [102], while in Tsinling lenok trout, thermal stress triggers FoxO-mediated mitochondrial apoptosis and impairs liver function [103]. Collectively, these findings support FoxO’s role as a central hub linking environmental stress to autophagy and apoptosis across vertebrates. Overall, the integrated analysis suggests that rainbow trout respond to both heat and hypoxia stress through a conserved network of cellular defense mechanisms converging on stress-sensing and metabolic regulatory pathways.
A limitation of this meta-analysis is that the included datasets represent a relatively narrow size range of rainbow trout (200–400 g) and are limited to liver and muscle tissues. This may not capture size or developmental stage specific transcriptional responses that could occur in smaller juveniles or larger adults and may also overlook tissue-specific stress adaptation mechanisms in other organs such as gills or brain, which are critical for thermal and hypoxia tolerance.
Conclusion
Rainbow trout responds and adapts itself to heat and hypoxia stress via a conserved network of cellular defense mechanisms, which is reflected in the coordinated regulation of DEGs. These genes, involved in the cell cycle, protein processing in the endoplasmic reticulum, FoxO signaling, and oxidative stress responses, form a shared molecular program that maintains proteostasis and cellular homeostasis under environmental stress. Overall, these findings deepen our understanding of rainbow trout’s molecular stress responses and provide promising targets for future functional studies to enhance aquaculture resilience.
Supplementary Information
Supplementary material 1.
Supplementary material 2.
Supplementary material 3.
Supplementary material 4.
Supplementary material 5.
Supplementary material 6.
The reference list from the paper itself. Each links out to its DOI / PubMed record.
- 1Andrews S. Fast QC: a quality control tool for high throughout sequence data. 2010. https://www.bioinformatics.babraham.ac.uk/projects/fastqc