TRIM8-associated non-coding RNA panel as a biomarker for Lupus nephritis activity
Mostafa Abdelnasier Abd Elgawad, Howayda Abdelhamid El Shinnawy, Sanaa Eissa, Nouran Abdelfattah Sayed Ali, Maha Abdelmoneim Behairy, Cherry Reda Kamel, Marwa Mostafa Kamel

TL;DR
This study identifies a panel of non-coding RNAs linked to the TRIM8 gene as potential non-invasive biomarkers for tracking lupus nephritis activity.
Contribution
The study introduces a novel TRIM8-associated non-coding RNA panel as a potential biomarker for lupus nephritis.
Findings
TRIM8 mRNA and lnc-SSBP2-1:1 are significantly upregulated in active lupus nephritis.
hsa-miR-126-5p is significantly downregulated in active lupus nephritis.
The biomarkers show high diagnostic accuracy (AUCs > 0.93) in distinguishing active from inactive lupus nephritis.
Abstract
Lupus nephritis (LN) represents a major complication in systemic lupus erythematosus (SLE). The objective of this study was to evaluate the TRIM8 gene and its associated non-coding RNAs (lnc-SSBP2-1:1 and hsa-miR-126-5p) as potential non-invasive biomarkers for LN activity. Bioinformatics analyses were initially employed to identify candidate mRNA and associated non-coding RNAs (ncRNAs) implicated in LN. Expression profiles of TRIM8lnc-SSBP2-1:1and hsa-miR-126-5p were validated in blood samples from 40 active LN, 30 inactive LN patients, and 20 healthy individuals via real-time PCR. TRIM8 mRNA and lnc-SSBP2-1:1 lncRNA levels were notably upregulated in active LN (p < 0.001), while hsa-miR-126-5p was reduced (p < 0.001). SLEDAI-2K scores correlated positively with TRIM8 mRNA and lnc-SSBP2-1:1, and negatively with hsa-miR-126-5p. This study highlights TRIM8-associated ncRNA regulatory…
Genes, proteins, chemicals, diseases, species, mutations and cell lines named across the full text — each resolved to its canonical identifier and authoritative record.
Click any figure to enlarge with its caption.
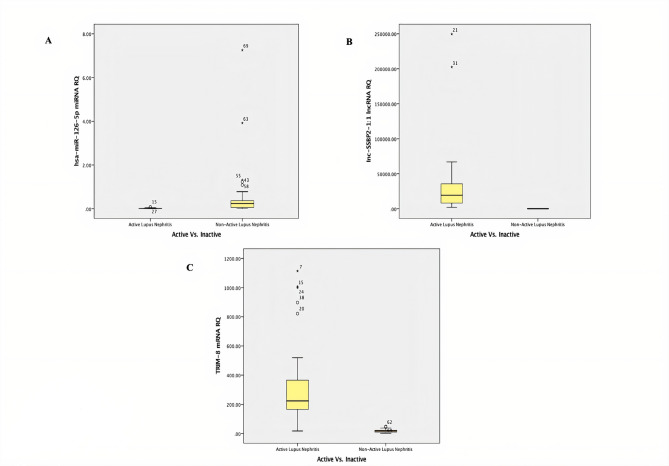 Figure 1
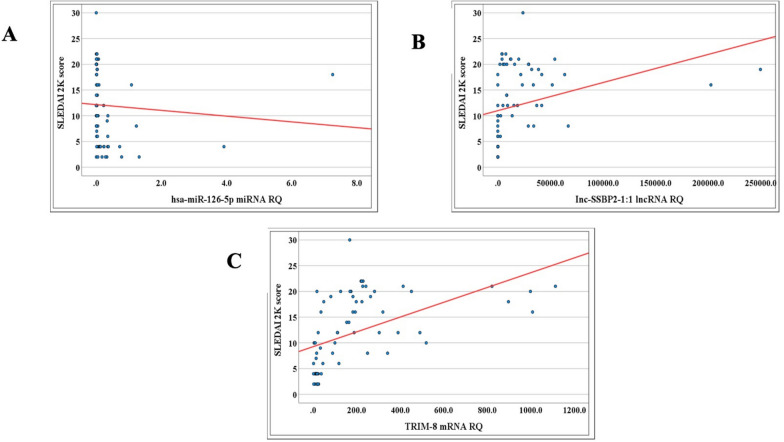 Figure 2
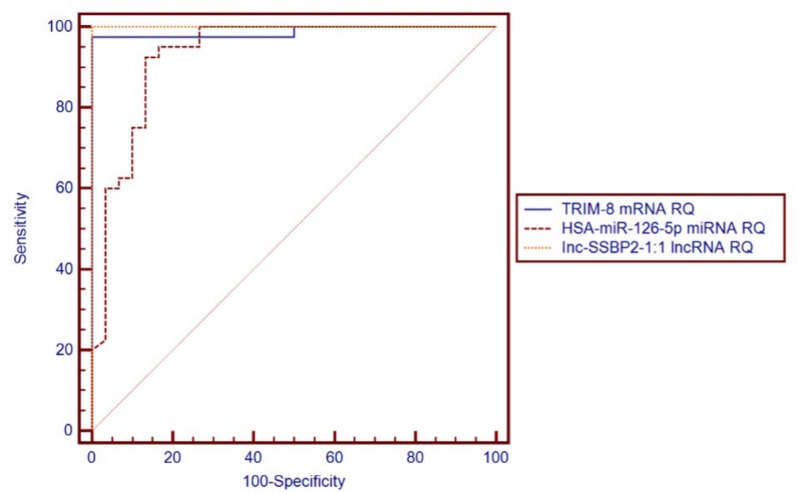 Figure 3
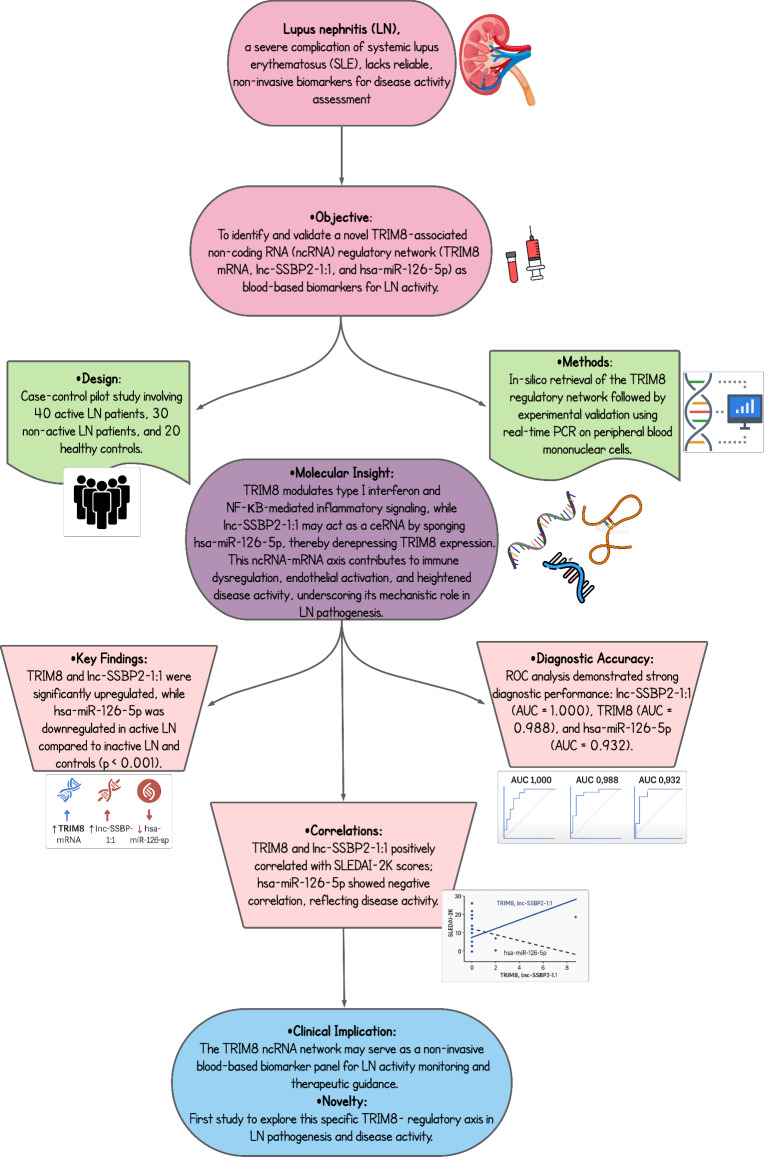 Figure 4
- —Ain Shams University
Peer Reviews
No public reviews on file for this paper yet. If you reviewed it on a platform where reviews are public (OpenReview, ICLR, NeurIPS, ICML), you can paste yours below so the community can read it here.
Videos
No videos yet. Explain this paper in a talk, walkthrough, or lecture? Add one.
Taxonomy
Topicsinterferon and immune responses · MicroRNA in disease regulation · RNA regulation and disease
Background
Lupus nephritis (LN) is known to be one of the most severe complications in systemic lupus erythematosus (SLE), affecting up to seventy percent of the individuals diagnosed with the disease. [1]. Despite existing treatments, about 10% of patients advance to end-stage kidney disease (ESKD), posing a major clinical and socioeconomic burden [2]. Traditional biomarkers, such as anti-dsDNA antibodies and complement (C3/C4), often lack sensitivity and specificity in tracking disease activity or predicting flares. Thus, identifying reliable non-invasive markers [3].
The tripartite motif-containing protein 8 (TRIM8), a member of the tripartite motif family, is a key regulator of immune responses through NF-κB and type-I interferon signaling [4–6]. Its role in IFN-γ hyper-responsiveness has been implicated in autoimmune conditions and renal inflammation [7, 8], suggesting relevance in LN pathogenesis. dysregulation of non-coding RNAs modulates these pathways and correlates with disease severity [9–12]. However, the role of TRIM8-associated ncRNA network in LN activity remains unexplored.
This study aimed to evaluate the expression of TRIM8 and its associated ncRNAs (lnc-SSBP2-1:1 and hsa-miR-126-5p) as potential biomarkers for LN activity and disease severity.
Patients and methods
Our study is a case–control pilot study including 40 active LN, 30 inactive LN, and 20 healthy controls at, internal medicine department of Ain Shams University Hospitals. All 70 patients fulfilled the 2019 EULAR/ACR classification criteria and had a biopsy confirming LN at the time of diagnosis [13].Active LN defined by proteinuria > 0.5 g/24h, active urinary sediments, or biopsy evidence. Inactive LN defined as remission with proteinuria < 0.5 g/24h.
Patients with diabetes, uncontrolled hypertension, ischemic heart disease, active infection, decompensated liver disease, malignancy, other auto-immune diseases, pregnancy, or on renal replacement therapy were excluded. Ethical approval was provided from Ain Shams University REC (FWA 000017585). Informed consent obtained.
Demographic and clinical data
Disease activity was scored using the systemic lupus erythematosus disease activity index 2000 (SLEDAI-2K) score, from zero activity, scores 1–5 mild activity, 6–10 moderate activity, 11–19 high activity, and scores exceeding 20 points are very high activity.
Additionally, the renal component of the Systemic Lupus Erythematosus Disease Activity Index (rSLEDAI) was applied to assess the renal involvement, it considers four renal parameters encompassing hematuria, pyuria, proteinuria, and urinary casts. Every one of these indicators adds four points to the total score, ranging from zero (signifying inactive renal disease) to 16 (representing the highest level of disease activity) [14].
Laboratory investigations
Included CBC, creatinine, eGFR (CKD-EPI 2021), complements, ANA, anti-dsDNA, CRP, protein/creatinine ratio, and urine microscopy [15].
Bioinformatics-based identification of novel genetic and epigenetic regulatory networks
Genetic network selection: initially, relevant molecular pathways associated with LN pathogenesis were identified using publicly available databases, including NCBI (https://www.ncbi.nlm.nih.gov/) and Reactome (https://reactome.org/). Next, we used these databases to retrieve novel genes related to the INF stimulator gene pathway (cGAS-STING Pathway), a highly implicated recent pathway in the pathogenesis of Lupus Nephritis. Filtering results identified the TRIM8 gene to be related to the Interferon response in LN. We verified the expression of the selected gene in relevant tissues (kidney and blood) using Human Protein Atlas database (https://www.proteinatlas.org/) and then verified gene ontology (function) from Uniprot database (https://www.uniprot.org/), to make sure it was involved in the disease pathogenesis. Finally, checked the novelty of the selected gene in lupus using PubMed (https://pubmed.ncbi.nlm.nih.gov/) as shown in Supp. Figure 1.
Selection of epigenetic regulators: Retrieval of novel miRNA and lncRNA related to the selected gene to complete the genetic regulatory network, where hsa-miR-126-5p was chosen from the mirDB database (https://mirdb.org/) and then confirmed the selected miRNA from another database miRBase database (https://www.mirbase.org/). Finally, the long non-coding RNA lnc-SSBP2-1:1 was selected based on its predicted interaction with miR-126-5p, as identified using the miRWalk2.0 database (http://mirwalk.umm.uni-heidelberg.de/), and the selection was subsequently confirmed using the LNCipedia database (https://lncipedia.org/). At last, we checked the novelty of both selected epigenetic regulatory networks (lncRNA and miRNA) using PubMed, as shown in Supp. Figure 2.
Validation of the novel TRIM8-associated ncRNA regulatory network in patients’ samples by molecular assay
Sample processing
Isolation of Peripheral blood mononuclear cells (PBMNCs) from EDTA-anticoagulated venous blood using the Lymphoprep™ (Axis-Shield PoC AS, Oslo, Norway). Blood samples were diluted with 0.9% NaCl and gently layered over Lymphoprep™, then underwent centrifugation at 800 × g at room temperature for 20 min. After centrifugation, the mononuclear cell layer at the interface was carefully collected. Plasma was removed, and white blood cells were transferred to a clean tube, diluted again with saline, and centrifuged at 250 × g for 10 min to pellet the cells. This protocol ensured effective PBMNC isolation for downstream analyses. Given the limitations of renal biopsy, blood-based biomarkers offer a promising non-invasive alternative for monitoring immune-mediated diseases [16, 17].
Quantification of RNA expression using RT-qPCR
Total RNA extraction
Total RNA, including lncRNA and miRNA, was extracted from PBMNCs using the miRNeasy Mini Kit (Qiagen, Cat. No. 217004) following the protocol of the manufacturer. A thermoscientific nanodrop spectrophotometer, with purity ratios ranging between 1.8 and 2.0, was used to assess RNA concentration and integrity.
Reverse transcription to cDNA
RNA templates were reverse transcribed into cDNA using the RT^2^ First Strand Kit (Qiagen, Cat. No. 330404) for mRNA and lncRNA, and the miRCURY LNA miRNA PCR Starter Kit (Qiagen, Cat. No. 339320) for miRNA. This reverse transcription process was conducted using the Thermo Hybrid PCR Express Thermal Cycler (Thermo Fisher, USA), in strict adherence to the manufacturer’s instructions.
Quantification of TRIM8-associated ncRNA regulatory network expression by RT-qPCR
An RT2 SYBR Green qPCR Mastermix Kit (Qiagen, Cat. No. 330502) and QuantiTect Primer Assays for TRIM-8 (Hs_TRIM8_1_SG QuantiTect Primer Assay) and Inc-SSBP2-1:1 (Hs_SSBP2_1_SG QuantiTect Primer Assay) (Qiagen, Cat. No. 249900) were utilized to quantify the mRNA expression of TRIM-8 and Inc-SSBP2 in peripheral blood mononuclear cells (PBMNCs), respectively. The (Hs_ACTB_1_SG QuantiTect Primer Assay) (Qiagen, Cat. No.6 249,900) served as the reference assay. To assess miR-126-5p expression in all samples, a miRCURY LNA SYBR PCR Starter Kit (Qiagen, Cat. No. 339320) was used along with a miRNA Primer Assay targeting mature miR-126-5p (MIMAT0000444). The miRNA Primer Assay targeting mature hsa-miR-103a-3p (MIMAT0000101) was used as an endogenous control assay, following the protocol of the manufacturer.
Quantitative PCR was performed using SYBR Green dye on the Applied Biosystems 7500 Real-Time PCR System (USA). The thermal cycling protocol included an initial 15 min denaturation at 95 °C, followed by 40 cycles of 10 s denaturation at 94 °C and 30 s annealing at 55 °C, with a 30 s final extension at 70 °C. Reactions were run in duplicate. CT values above 36 were considered negative. The 2^− ΔΔCt^ method was employed in determining the relative RNA expression levels, and melting curve analysis was conducted to verify amplification specificity [18].
Statistical analysis
Data were analyzed using IBM SPSS v28. Normality was tested with the Shapiro–Wilk and Kolmogorov–Smirnov tests. Parametric data are expressed as mean ± SD and analyzed using t-tests or ANOVA. Non-parametric data were evaluated with the Mann–Whitney test, and correlations were assessed using Pearson or Spearman methods based on distribution. Categorical variables were analyzed with Chi-square or Fisher’s Exact tests, applying Bonferroni correction when needed. ROC curve analysis determined the diagnostic performance of the studied markers, with statistical significance set at p ≤ 0.05.
Results
Demographics and disease characteristics
Gender distribution was similar across groups, with females representing 70% of the active LN group, 86.7% of the non-active LN group, and 75% of the control group. Mean age was 26.7 ± 8.2 years in the active LN group, 28.6 ± 6.9 years in the non-active group, and 29.0 ± 4.0 years in controls, without a significant difference. Most of the active LN patients were class IV (52.5%) and class III (37%), while non-active LN patients were 50% class III, 23% class IV, 13.3% class II, and 13.3% class V in renal biopsies taken at the initial time of diagnosis before the start of therapy. The active LN group had a significantly shorter SLE disease duration (p < 0.001), a higher prevalence of hypertension (p = 0.013), as well as a significantly higher renal SLEDAI and SLEDAI 2K scores (p < 0.001), as shown in Supp. Table 1.
Laboratory findings
In the active LN group, about 72.5% were anti-DNA positive. Statistically significant differences were found between the active LN and the non-active LN groups regarding the serum albumin level (mean ± SD 2.4 ± 0.5 vs 3.6 ± 0.3), C3 (mean ± SD 55.1 ± 24.8 vs 90.0 ± 21.0), and C4 (mean ± SD 9.0 ± 5.5 vs 21.3 ± 8.7). Serum albumin levels, C3, and C4 were significantly lower in the active LN group compared to the non-active group (p < 0.001), with lower eGFR (mean ± SD 71.2 ± 48.6 vs 96.6 ± 32.1) (p = 0.011). Also, results of the current study demonstrated significant differences between the active and non-active LN groups regarding serum creatinine level (mean ± SD 1.9 ± 1.5 vs 0.9 ± 0.3), serum BUN (mean ± SD 44.5 ± 30.1 vs 21.5 ± 8.3), Pr/Cr ratio (mean ± SD 3.5 ± 1.6 vs 0.3 ± 0.1) (p < 0.001). There were statistically significant differences between active and non-active LN regarding other studied parameters, including hemoglobin, and urine analysis of active sediments (p < 0.001). WBC count, platelets, CRP, or ANA titer showed no significant differences as shown in Table 1.Table 1. Comparison between the active and the non-active LN groups with regard to laboratory dataVariables(Mean ± SD)Active lupus nephritis(Total = 40)Non-active lupus nephritis(Total = 30)p-valueHemoglobin (gm/dL)9.3 ± 2.211.4 ± 1.9^ < 0.001WBC (× 10^3^/mL)6.7 ± 2.66.9 ± 3.0^0.708Platelets (× 10^3^/mL)257.5 ± 96.8246.9 ± 92.3^0.649Serum albumin (gm/dL)2.4 ± 0.53.6 ± 0.3^ < 0.001Serum creatinine (mg/dL)1.9 ± 1.50.9 ± 0.3^ < 0.001Serum BUN (mg/dL)44.5 ± 30.121.5 ± 8.3^ < 0.001eGFR (mL/min/1.73m^2^)71.2 ± 48.696.6 ± 32.1^0.011CRP (mg/dL)5.4 ± 3.44.6 ± 2.9^0.343C3 (mg/dL)55.1 ± 24.890.0 ± 21.0^ < 0.001C4 (mg/dL)9.0 ± 5.521.3 ± 8.7^ < 0.001ANA titer115.9 ± 61.496.0 ± 73.2^0.224Anti-DNA29 (72.5%)0 (0.0%)# < 0.001Pr/Cr ratio (gm/gm)3.5 ± 1.60.3 ± 0.1^ < 0.001Pus cells in urine (/HPF)25 (62.5%)0 (0.0%)# < 0.001RBCs in urine (/HPF)19 (47.5%)0 (0.0%)# < 0.001Urinary casts (/HPF)16 (40.0%)0 (0.0%)# < 0.001^*^ Significant p-value < 0.05. Mean ± SD. ^ Independent t-test. # Chi-square test
Validation of the novel genetic and epigenetic network in patients’ sample
The mean ranks of RQ of TRIM8 mRNA and lnc-SSBP2-1:1 lncRNA expression levels were significantly higher in the active LN group, whereas hsa-miR-126-5p expression was notably reduced compared to the non-active group (p < 0.001) as illustrated in Table 2 and Fig. 1. Significant positive correlations were found between global SLEDAI 2K scores and RQ of TRIM8 mRNA (r = 0.692, p = 0.001) and lnc-SSBP2-1:1 lncRNA expression (r = 0.600, p = 0.001), while hsa-miR-126-5p expression had a significant negative correlation (r = − 0.517, p = 0.001) as shown in Table 3 and Fig. 2.In the active LN group, RQ of hsa-miR-126-5p expression levels showed a negative correlation to serum albumin (r =− 0.521, p = 0.001), and lnc-SSBP2-1:1 expression level had a negative correlation to the duration of the disease (r = − 0.353, p = 0.026). RQ of TRIM8 mRNA and hsa-miR-126-5p expression levels were elevated in patients with positive anti-DNA antibodies (p = 0.013, p = 0.038, respectively) as shown in Supp. Table 2. In the non-active LN group, RQ of TRIM8 mRNA expression was significantly elevated among hypertensive patients (mean ± SD 32.3 ± 15.0) (p = 0.002), while lnc-SSBP2-1:1 expression showed a significant inverse correlation with ANA titer (r = − 0.437, p = 0.016) as shown in Supp. Tables 3 and 4.Table 2. Comparison between the active and non-active LN groups regarding the relative quantification (RQ) of the TRIM8-associated ncRNA regulatory network (hsa-miR-126-5p and lnc-SSBP2-1:1) expressionsMean rank of RQ of the studied genesActive lupusnephritis(Total = 40)Non-active lupus nephritis(Total = 30)Up-valueTRIM8 mRNA RQ50.1316.0015.00 < 0.001hsa-miR-126-5p* miRNA RQ22.5452.7881.50 < 0.001lnc-SSBP2-1:1* lncRNA RQ50.5015.500.00 < 0.001*Mann–Whitney Test. *SignificantFig. 1Boxplots showing differential expression (RQ) of the TRIM8-associated ncRNA regulatory network in active vs. inactive lupus nephritis (LN) patients measured by qRT-PCR: A
- hsa-miR-126-5p* miRNA (p < 0.001), B
- lnc-SSBP2-1:1* lncRNA (p < 0.001), C
- TRIM8* mRNA (p < 0.001). Boxes represent the interquartile range (IQR), horizontal lines represent the median, and whiskers indicate 1.5 × IQR. Circles denote outliers. Group differences were analyzed using the Mann–Whitney U testTable 3Correlations between RQ of TRIM8-associated ncRNA regulatory network expressions and SLEDAI 2K global activity score among SLE patientsRQ of the studied genesSLEDAI 2K scoreRp-valueTRIM8 mRNA RQ0.692 < 0.001hsa-miR-126-5p* miRNA RQ− 0.517 < 0.001lnc-SSBP2-1:1* lncRNA RQ0.600 < 0.001Total = 70, Spearman test. SignificantFig. 2Correlation between disease activity (SLEDAI-2K score) and expression levels of A hsa-miR-126-5p (r = − 0.517, p < 0.001), B
- lnc-SSBP2-1:1* (r = + 0.600, p < 0.001), and C
- TRIM8* mRNA (r = + 0.692, p < 0.001). Correlation analysis was performed using Spearman’s rho test. Red lines represent regression fit
The ROC curve analysis for the relative quantification (RQ) of TRIM8-associated ncRNA regulatory network markers revealed significant discriminatory power between active and non-active lupus nephritis patients. lnc-SSBP2-1:1 had an AUC of 1.000 (95% CI 1.000–1.000; p < 0.001) at a cut—off ≥ 478.63; TRIM8 had an AUC of 0.988 (95% CI 0.963–1.000; p < 0.001) at a cut—off ≥ 63.10; and hsa-miR-126-5p yielded an AUC of 0.932 (95% CI 0.867–0.997; p < 0.001) at a cut-off ≤ 0.07, as shown in Table 4 and Fig. 3.Table 4. Diagnostic performance of RQ of TRIM8-associated ncRNA regulatory network expressions in discriminating the active from the non-active LN groups:RQ of the studied GenesAUCSEp-value95% CICut-off pointTRIM8 mRNA RQ0.9880.013 < 0.0010.963–1.000 ≥ 63.10hsa-miR-126-5p* miRNA RQ0.9320.033 < 0.0010.867–0.997 ≤ 0.07lnc-SSBP2-1:1* lncRNA RQ1.0000.000 < 0.001*1.000–1.000 ≥ 478.63Total = 70, *significant p-value < 0.05; AUC, Area under the curve; SE, standard error; CI, confidence intervalFig. 3Receiver operating characteristic (ROC) curves of TRIM8-associated ncRNA regulatory 548 network expressions for distinguishing active from inactive LN patients. Area under the curve 549 (AUC) values: *TRIM8 *mRNA = 0.988 (95% CI 0.963–1.000, SE = 0.013, p < 0.001); *hsa-miR-*550 *126-5p *miRNA = 0.932 (95% CI 0.867–0.997, SE = 0.033, p < 0.001); *lnc-SSBP2-1:1 *lncRNA = 551 1.000 (95% CI 1.000–1.000, SE = 0.000, p < 0.001)
Additionally, ROC curve analysis of traditional biomarkers (serum creatinine, C3, and C4) showed AUC values of 0.329 (p = 0.015), 0.872 (p < 0.001), and 0.889 (p < 0.001), respectively. While C3 and C4 showed some discrimination, their limited specificity, along with the poor performance of creatinine, highlights the inadequacy of traditional markers for accurate LN monitoring (Supp. Figure 3).
The statistical analysis showed that lnc-SSBP2-1:1 had the highest diagnostic accuracy for distinguishing active from non-active LN, achieving 100% sensitivity and specificity. This was followed by TRIM8 mRNA with 97.5% sensitivity and 100% specificity, and hsa-miR-126-5p with 92.5% sensitivity and 86.7% specificity, as shown in Table 5.Table 5. Performance characteristics of the RQ of TRIM8-associated ncRNA regulatory network expressions using the calculated cut-off points in discriminating the active LN group from the non-active LN group:CharacteristicsTRIM-8 mRNA RQ ≥ 63.10 (%)hsa-miR-126-5p miRNA (%)RQ ≤ -0.07Inc-SSBP2-1:1 lncRNA (%)RQ ≥ 478.63Sensitivity97.5 (86.8–99.9%)92.5 (79.6–98.4%)100.0 (91.2–100.0%)Specificity100.0 (88.4–100.0%)86.7 (69.3–96.2%)100.0 (88.4–100.0%)Diagnostic accuracy98.6 (92.3–100.0%)90.0 (80.5–95.9%)100.0 (94.9–100.0%)Youden’s index97.5 (92.7–100.0%)79.2 (64.5–93.8%)100.0 (100.0–100.0%)Positive predictive value100.0 (91.0–100.0%)90.2 (76.9–97.3%)100.0 (91.2–100.0%)Negative predictive value96.8 (83.3–99.9%)89.7 (72.6–97.8%)100.0 (88.4–100.0%)Data expressed as values (95% confidence interval)
Discussion
Lupus nephritis, a severe complication affecting up to 70% of SLE patients, significantly contributes to morbidity, ESKD, and mortality despite advances in immunosuppressive therapies [19]. Recent data indicate that 10–20% of LN patients still progress to ESKD within 10 years, reflecting limitations of current monitoring and treatment strategies [20, 21]. The present study is among the first to identify and validate a TRIM8-associated ncRNA regulatory network in LN, showing that TRIM8 mRNA and lnc-SSBP2-1:1 are significantly upregulated, while hsa-miR-126-5p is downregulated in active disease.
Although these results are encouraging, it is still unclear how specific this biomarker panel is to LN. Current evidence supports plausibility but not exclusivity. TRIM8 is a ubiquitin E3 ligase that promoting TAK1 Lys63-ubiquitination (NF-κB) and relieving STAT inhibition via PIAS3 degradation (JAK/STAT) [5, 22], so elevated TRIM8 in active LN is biologically credible, but TRIM8 dysregulation can also occur in other autoimmune conditions such as OA and keratitis [23, 24] and non-autoimmune glomerulonephritis [25].
miR-126-5p is classically endothelial/immune-regulatory; its levels shift in vascular and renal injury across diseases as CKD [26–28]. Its downregulation in active LN may reflect endothelial dysfunction in inflamed glomeruli [29–31]. lnc-SSBP2-1:1 upregulation indicates a common mechanism for AS-lncRNAs, which is antisense lncRNA–sense gene regulatory coupling (chromatin/accessibility, transcriptional interference). This locus’s functional significance in immunity is conceivable but not yet established [32, 33]. Panel-level performance (TRIM8 + lnc-SSBP2-1:1 + miR-126-5p) is what may confer relative specificity to active LN versus quiescent SLE as shown in the current data.
A key player in LN pathogenesis, TRIM8 is a crucial regulator of type-I interferon (IFN-I) and NF-κB signaling [5, 6, 24]. TRIM8 increases immune complex-mediated kidney damage by stimulating the production of pro-inflammatory cytokines (TNF-α, IL-6, and IFN-γ) [24, 25]. Prior research has supported TRIM8’s significance in IFN-γ hyper-responsiveness by connecting its deregulation to renal cell cancer [7] and macrophage activation in systemic juvenile idiopathic arthritis [8]. Our results indicate TRIM8 as a potential therapeutic target and extend this evidence to LN. Its expression positively correlated with SLEDAI-2K scores, highlighting its potential as a disease activity biomarker.
Known for its function in inflammation and endothelial homeostasis [13, 29], hsa-miR-126-5p was significantly downregulated in active LN in our investigation. This decrease suggests a wider role in inflammatory renal disease and is consistent with observations of miR-126 downregulation in sepsis-associated AKI [31] and OA [24]. In our population, its inverse relationship with serum albumin might be a reflection of the degree of proteinuria and endothelial dysfunction.
Despite being infrequently examined, lnc-SSBP2-1:1 showed a high positive correlation with disease activity and superior diagnostic performance (AUC = 1.000). Prior studies have demonstrated that lncRNAs have a role in immunological regulation, specifically through Toll-like receptor signaling, which supports both the innate and adaptive immune responses [34]. Autoimmune illnesses such as rheumatoid arthritis, SLE, and Sjögren’s syndrome are significantly influenced by dysregulated long noncoding RNAs. They can impact the severity and progression of disease by affecting the production of inflammatory cytokines such as TNF-α, IL-6, IL-1β, and IFN-I [35].
Direct mechanistic interplay among these three biomarkers has not been shown in LN. Based on expression profiling, bioinformatics predictions and previous published evidence, there is a potential interplay between them. Our results lend credence to a possible ceRNA-based paradigm. Lnc-SSBP2-1:1 may function as a molecular sponge for hsa-miR-126-5p in this axis, decreasing its capacity to inhibit TRIM8. The resulting TRIM8 derepression may increase NF-κB and type I interferon signaling, which would increase the release of pro-inflammatory cytokines and endothelial dysfunction [36–38]. This interaction highlights the biological relevance of this ncRNA–mRNA network in LN pathogenesis and provides a tenable explanation for the correlations with disease activity that have been found.
Proteinuria, serum creatinine, C3/C4, and anti-dsDNA are current clinical indicators that are not sensitive or specific for disease activity [3]. Our ROC analysis, on the other hand, showed that the TRIM8-associated ncRNA panel outperformed conventional serological markers in terms of discriminatory power (AUCs > 0.93). When combined with well-known clinical indices as SLEDAI-2K, this indicates possible additional value [13, 14].
Compared to kidney biopsy, the use of qPCR-based RNA tests is both technically possible and reasonably priced. These tests could be used as non-invasive supplements to the current LN monitoring techniques if they are properly standardized. Furthermore, TRIM8 inhibition is a possible therapeutic strategy to reduce overactive IFN signaling, albeit these tactics are still in the preclinical stage.
Conclusion
This work represents one of the earliest investigations into the dysregulated expression of the TRIM8-associated non-coding RNA network—encompassing lnc-SSBP2-1:1 and hsa-miR-126-5p—in lupus nephritis. Our findings establish its ability to discriminate between active and inactive disease states and reveal a strong association with disease severity. These results suggest that this RNA panel holds significant promise as both a non-invasive biomarker and a potential therapeutic target. Furthermore, it may complement current monitoring strategies for lupus nephritis; however, rigorous validation in larger and more heterogeneous autoimmune and renal cohorts will be essential to confirm its specificity and advance its clinical applicability.
Key limitations and future directions
The study has some limitations, including a relatively small sample size and a cross-sectional design, which precludes causal inference or prediction of future flares. Future studies with larger, independent cohorts and mechanistic experiments across diverse renal and autoimmune diseases are needed to confirm the diagnostic and pathogenic roles of TRIM8, miR-126-5p, and lnc-SSBP2-1:1 in lupus nephritis.
Supplementary Information
Below is the link to the electronic supplementary material.Supplementary Material 1.
The reference list from the paper itself. Each links out to its DOI / PubMed record.
- 1Gladman DD, Ibañez D, Urowitz MB. Systemic lupus erythematosus disease activity index 2000. J Rheumatol. 2002, 2911838846 · pubmed ↗