Evolutionary Changes of GT1 Provide Insights Into the Adaptation of Butterflies to Plant Feeding
Jinyu Wu, Hengyu Yan, Wanjiang Tang, Zhengyang Li, Amrita Chakraborty, Zhengbo He, Cao Zhou, Shulin He

TL;DR
This study explores how glycosyltransferase 1 (GT1) genes evolved in butterflies and how they help butterflies adapt to plant feeding.
Contribution
The study reveals the evolutionary patterns of GT1 genes and their role in butterfly adaptation to host plants through duplication, selection, and expression divergence.
Findings
GT1 genes in butterflies show frequent tandem duplications and collinearity.
UGT33 and UGT40 subfamilies exhibit positive selection and functional diversification.
Gene expression patterns differ between adult antennae and larval guts, suggesting divergent roles.
Abstract
Glycosyltransferase 1 (GT1) genes are involved in insect detoxification, olfactory perception, and endogenous metabolic regulation, and they play a role in the adaptation of butterflies to their specific feeding habits. However, their evolutionary trajectories in butterflies remain elusive. To reveal the evolutionary histories of the GT1 gene family and its relationship with feeding niches in butterflies, we systematically identified GT1 genes across 69 butterfly genomes and inferred their duplication and loss events by reconciling the gene tree with a species tree. Subsequently, the duplication modes and collinearity of these genes were determined between four selected species, followed by tests of selection pressures on the sites and branches of GT1 genes. In addition, the expression patterns of different GT1 gene subfamilies in the larval gut and adult antenna of two representative…
Genes, proteins, chemicals, diseases, species, mutations and cell lines named across the full text — each resolved to its canonical identifier and authoritative record.
Click any figure to enlarge with its caption.
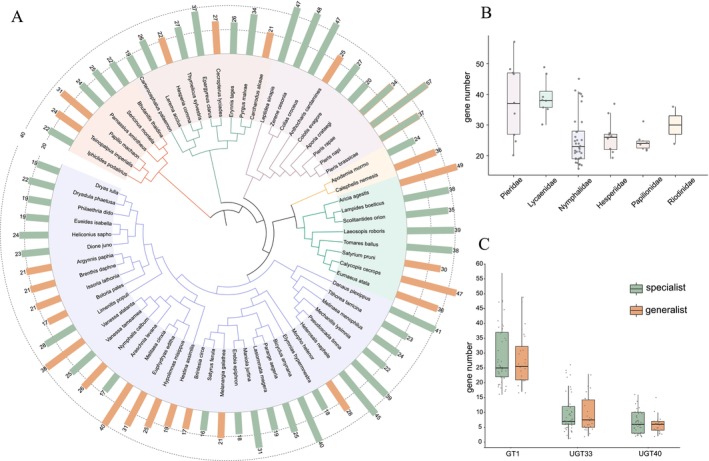 FIGURE 1
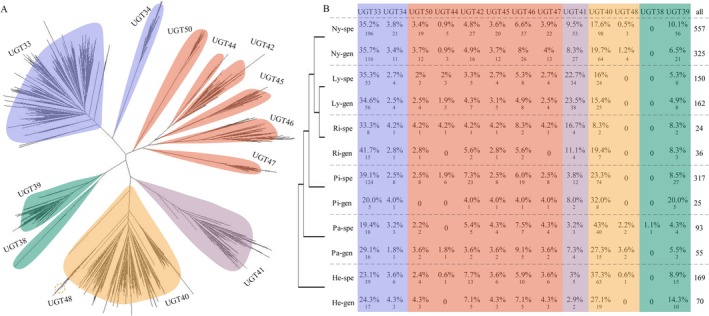 FIGURE 2
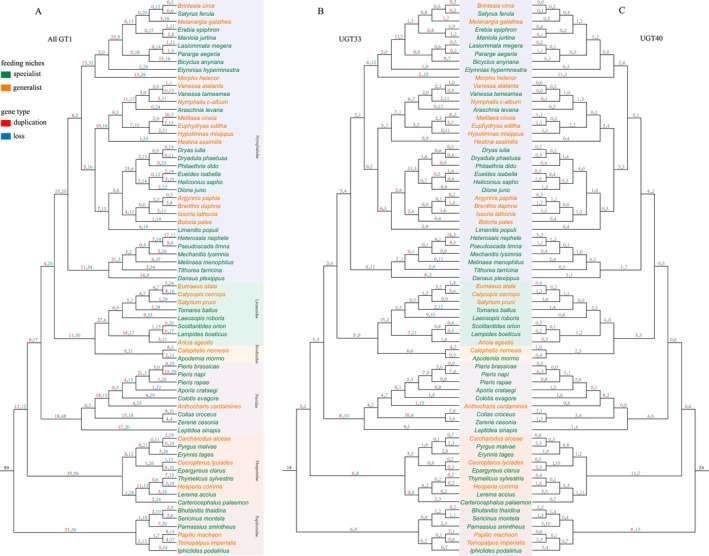 FIGURE 3
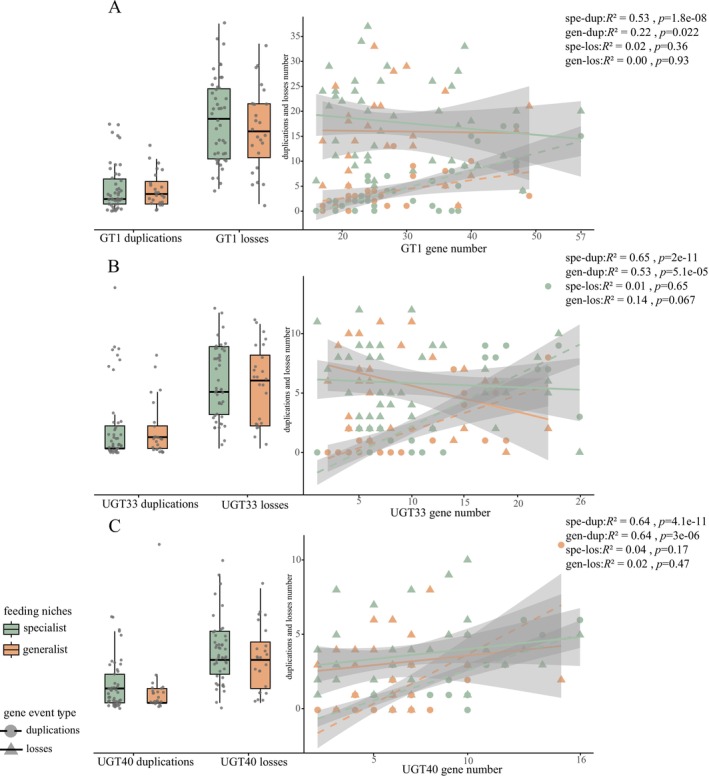 FIGURE 4
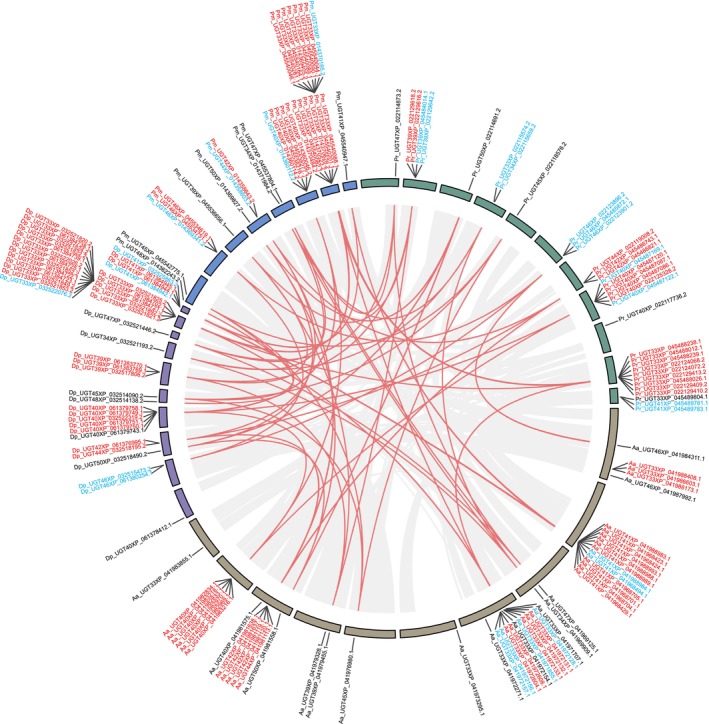 FIGURE 5
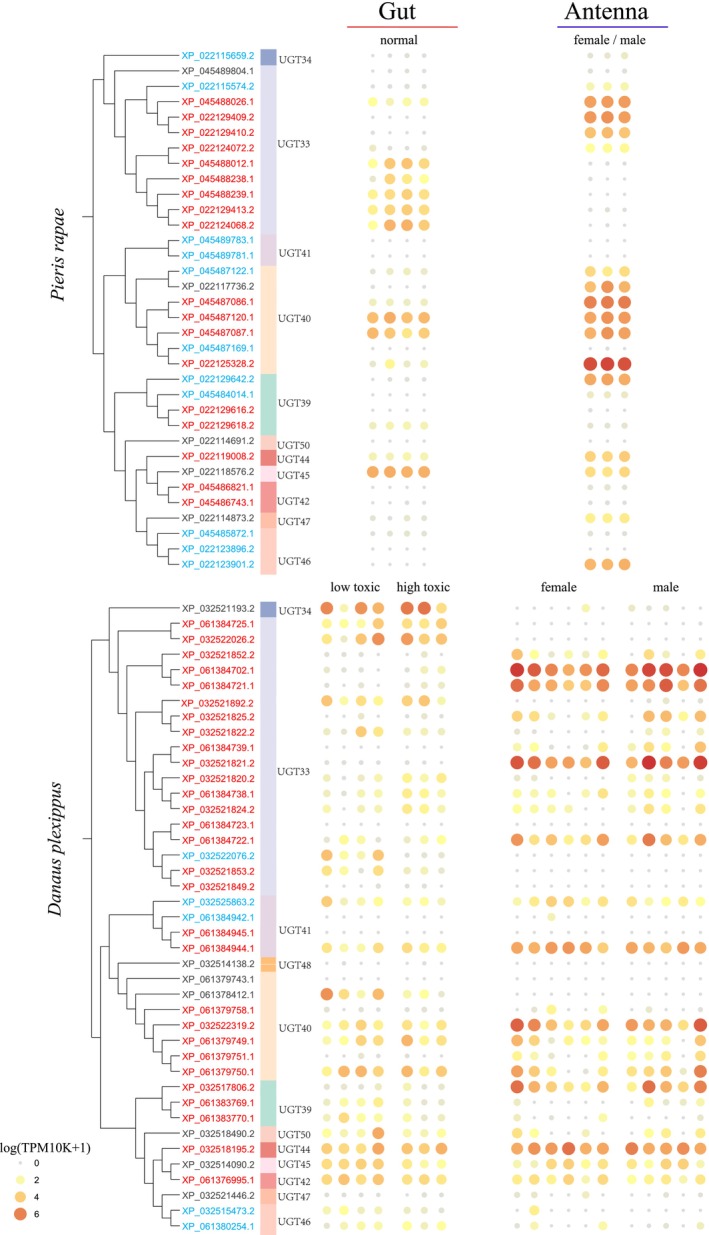 FIGURE 6
| UGT domain N‐terminal | UGT domain C‐terminal | non‐domain region | |
|---|---|---|---|
|
| 1276 | 659, 1562, 2185 | 37 |
|
| 135 | ||
|
| 603, 753, 1401, 1403, 1428 | 965 | 1212 |
|
| 150 | ||
|
| 1353 | ||
|
| 1017 | ||
|
| 456 | 51 | |
|
| 479 | ||
|
| 19 |
- —Science and Technology Research Program of Chongqing Municipal Education Commission
- —Natural Science Foundation of Chongqing Municipality10.13039/501100005230
- —Chongqing Normal University10.13039/100010338
Peer Reviews
No public reviews on file for this paper yet. If you reviewed it on a platform where reviews are public (OpenReview, ICLR, NeurIPS, ICML), you can paste yours below so the community can read it here.
Videos
No videos yet. Explain this paper in a talk, walkthrough, or lecture? Add one.
Taxonomy
TopicsNeurobiology and Insect Physiology Research · Insect-Plant Interactions and Control · Insect Resistance and Genetics
Introduction
1
The chemical interactions between herbivorous insects and their host plants are a classic model for studying adaptive evolution and coevolutionary processes. Plants have evolved diverse specialized metabolites, including alkaloids, glycosides, and terpenoids, as part of sophisticated chemical defense systems to deter herbivory. Insects, in turn, have developed a range of behavioral and physiological counter adaptations, such as selective oviposition and metabolic detoxification (Ehrlich and Raven 1964), which have driven lineage‐specific expansions and functional diversification of relevant gene families (Nallu et al. 2018). Among herbivorous insects, Lepidoptera, particularly butterflies, have emerged as important systems for investigating plant–insect coevolution due to their diversified host‐use strategies and specialized chemosensory adaptations (Brady et al. 2021).
The butterfly adults and larvae developed distinct strategies for plant utilization. Adults rely on antennal chemosensation to locate or select suitable oviposition host plants (Futuyma and Moreno 1988; Renwick and Lopez 1999), whereas larvae depend on detoxification genes in the gut to process ingested plant chemicals (Yu et al. 2016). Host selection is typically performed by adult females during oviposition and influenced by volatile and contact‐based chemical cues emitted by plants (Haribal and Renwick 1996, 1998; Reudler Talsma et al. 2008). For example, Melitaea cinxia females exhibited oviposition preference through contact chemoreception by selecting host plants rich in iridoid glycosides; similarly, the antennal responses of Papilio butterflies to different plant volatiles are closely linked to their oviposition choices (Inoue et al. 2023). Larval performance is subsequently constrained by the nutritional quality and chemical defenses of the selected host plants; preferred hosts would accelerate larval development and growth (Reudler Talsma et al. 2008). In some taxa, larvae not only tolerate toxic plant metabolites but also sequester them for their defense (Nishida 2002). For instance, Junonia coenia can feed on hosts containing iridoid glycosides and partially sequester them for defense (Richards et al. 2012); Heliconiini species can sequester cyanogenic glucosides and alkaloids from Passiflora plants for defense (Castro 2018).
Regarding larval feeding, butterflies can range from highly specialized in a single host plant to generalist across multiple host plant families, and this difference in diet breadth is assumed to be closely associated with their detoxification capabilities (Kawahara et al. 2023). For example, Danaus plexippus feeds almost exclusively on plants of Asclepias, particularly various species of milkweed containing cardenolides (Greenstein et al. 2022); Heliconius melpomene primarily utilizes Passiflora containing cyanogenic glucosides (Greenstein et al. 2022). In contrast, Vanessa can feed on the leaves of three host plants characterized by distinct specialized metabolites: willowherb (Epilobium; Onagraceae), common plantain ( Plantago lanceolata ; Plantaginaceae), and oxeye daisy ( Leucanthemum vulgare ; Asteraceae) (Gallon and Smilanich 2023). However, even generalists are not free to exploit any host at random: Shifts tend to occur among chemically similar plants, indicating that plant specialized metabolite structure acts as a filter on host use evolution (van der Linden et al. 2021). The diversification of butterfly host use is both driven by and contributes to gene and genome duplications, particularly in detoxification‐related gene families that enable adaptation to chemically diverse plants (Edger et al. 2015; Allio et al. 2021), such as carboxylesterases and glutathione‐S‐transferases (Breeschoten et al. 2022).
Insects often employ a three‐phase system to metabolize these plant‐derived compounds: detoxification, conjugation, and excretion (Després et al. 2007). As key Phase II enzymes, members of the glycosyltransferase 1 (GT1) gene family play multifunctional roles in mediating insect–plant interactions (He et al. 2017; Teze et al. 2022). In addition to basic cellular functions such as glycosylating cell membrane components (Nagare et al. 2021), it can catalyze the glycosylation of plant specialized lipophilic or unstable metabolites to water‐soluble stable products, which effectively neutralizes the toxic metabolites by increased solubility and facilitated excretion (Yonekura‐Sakakibara and Hanada 2011; Teze et al. 2022). Furthermore, GT1 genes are involved in olfactory and endogenous metabolic processes. Previous studies have demonstrated that gene duplication and loss in insect GT1 families are closely associated with host shifts (Rane et al. 2016; Wu et al. 2024). Notably, GT1 genes in Lepidoptera undergo frequent duplication and loss events, exhibiting highly dynamic lineage turnover, with their evolution closely associated with adaptation to angiosperm host plants (Wu et al. 2024). The complexity of host plant utilization strategies in butterflies may be influenced by the evolution of the detoxification enzyme GT1 and its expression patterns in host plant usage‐related tissues, gut, and antennae. While direct evidence for such a role in butterflies remains scarce, studies in other Lepidoptera have shown that UDP‐glycosyltransferases can act as key determinants of host plant range in the Spodoptera specialists and generalists (Wang et al. 2024). Moreover, host plant adaptation in Lepidoptera has been shaped by multiple, independent evolutionary events (Luo et al. 2025), providing repeated diversification of detoxification gene families such as GT1. However, systematic investigations on the GT1 gene evolutionary characteristics in butterfly species are still limited.
Based on our previous broad analyses of the GT1 gene family across insects, this study focused on 69 herbivorous butterfly species, systematically identified GT1 family members, investigated their evolutionary dynamics, and assessed related gene family expansions and signals of positive selection. By integrating transcriptomic data from larval guts and adult antennae, we revealed the expression patterns of GT1 subfamilies associated with oviposition preference and larval feeding behavior. Our results reveal that the evolutionary dynamics of certain GT1 genes have facilitated adaptive responses to host utilization and indicate the patterns of butterfly adaptation to host plants.
Materials and Methods
2
Data Collection
2.1
Genomic data of butterfly species were downloaded from NCBI (accessed on January 20, 2025). Genome assembly quality was assessed using BUSCO v5.4.3 with the “insecta_odb10” database; genomes with a complete BUSCO score below 95% were considered low‐quality assemblies and excluded from subsequent analyses (Waterhouse et al. 2018). A total of 69 lepidopteran genomes were selected, including 15 species from the RefSeq database and 54 species from the GenBank database (Table S1). In addition, UGT protein sequences from six moth species (Zygaena filipendulae, Helicoverpa armigera, Bombyx mori , Plutella xylostella, Spodoptera frugiperda , and Plutella xylostella) were downloaded from the UGT classification database and used as references to aid in the accurate classification of GT1 subfamilies.
Data on butterfly feeding niches were obtained from a previously published study (Kawahara et al. 2023). In the present study, we did not account for the specific composition or concentration of specialized metabolites in host plants. Instead, species were classified based solely on the taxonomic breadth of their host range. Species that feed exclusively on host plants within a single plant family were classified as specialists, whereas those that feed on host plants from multiple families were classified as generalists (Table S1).
GT1
Gene Identification
2.2
We identified GT1 genes separately for reference and nonreference genomes. For reference genomes retrieved from the RefSeq database, we first extracted the longest isoform of each gene based on the annotation file using the orthologr package (Drost et al. 2015). The corresponding protein sequences were then subjected to GT1 annotation using run_dbcan, which integrates HMMER, Diamond, and dbCAN_sub (Zheng et al. 2023). The annotation of GT1s was considered reliable only when all three tools produced the same prediction. Subsequently, the predicted GT1 protein sequences were clustered using CD‐HIT v4.8.1 to generate a non‐redundant GT1 protein database for nonreference identification analysis (Li and Godzik 2006). For genomes retrieved from the GenBank database, GT1 genes were first predicted by homology‐based search using genblastG against the constructed nonredundant GT1 protein database. Gene models lacking either start or stop codons were filtered out using GffRead v0.12.7, and redundant sequences were also removed (Pertea and Pertea 2020). In cases when GT1 gene models overlapped at the same genomic locus, only the one with the highest genblastG alignment score was retained. The coding and protein sequences of the retained gene models were then reannotated by run_dbcan, following the same criteria as for reference genomes, and only those predicted by all three methods were considered high‐confidence GT1 members.
Phylogenetic Analysis of the
GT1 Gene Family
2.3
To infer the phylogenetic relationships of GT1 genes in butterflies, we aligned the GT1 protein sequences using both MAFFT v7.520 and MUSCLE v5.1 (Katoh and Standley 2013; Edgar 2004). The alignments were then refined using RASCAL v1.34, and the original and refined alignments were evaluated with normd v1.2 (Thompson et al. 2003). The alignment with the highest score was selected for subsequent phylogenetic inference by maximum likelihood using IQ‐TREE v2.1.3. The resulting GT1 gene tree was visualized using Dendropscope (Nguyen et al. 2015). Finally, the total number of GT1 genes and the numbers of UGT33 and UGT40 subfamilies across species with different feeding habits were visualized using bar plots.
Gene Duplication and Loss Inference in Butterflies
2.4
To explore GT1 gene copy number variation during butterfly evolution, we reconciled the GT1 gene tree with the species tree using Notung v2.9.1.5 (Durand et al. 2006). The species tree from a previous study (Kawahara et al. 2023) was pruned to include only butterfly species of interest using the keep.tip function from the ape R package (Paradis and Schliep 2019). The reconciliation analysis was performed with the following parameters: gene loss cost = 1.0, duplication cost = 1.5, horizontal transfer cost = 3.0, codivergence cost = 0, and edge weight threshold = 90% of the maximum edge weight.
Duplicate Mode Inference and Collinearity Analysis
2.5
To represent phylogenetic and ecological diversity, we selected four butterfly species from the RefSeq database, with each representing a different family and covering both generalist and specialist feeding types: Aricia agestis (generalist, Lycaenidae), Danaus plexippus (specialist, Nymphalidae), Papilio machaon (generalist, Papilionidae), and Pieris rapae (specialist, Pieridae) for duplication and collinearity analyses. The duplication modes of GT1 genes in each species were inferred using the duplicate_gene_classifier script from MCScanX (Wang et al. 2012). Collinearity analysis was performed for four representative butterfly species (Aa, A. agestis; Pr, P. rapae ; Pm, P. machaon ; Dp, D. plexippus ) using MCScanX, and the results were visualized by Circos implemented in TBtools v2.119 (Chen et al. 2023).
Selection Pressure Analysis of
GT1 Genes
2.6
Selection pressure analysis of GT1 genes was conducted using HyPhy v2.5.62. Protein sequence alignments were converted into codon alignments using PAL2NAL v14 (Suyama et al. 2006). Site‐specific selection pressures were determined using FEL (Pond and Frost 2005) and MEME (Murrell et al. 2012) models to detect signals of pervasive and episodic positive selection across GT1 coding sequences. Sites were considered positively selected when they were under positive selection with p < 0.05 inferred in both FEL and MEME models.
Expression Profiling of
GT1 Genes
2.7
To exclude potential confounding effects, we only selected samples neither infected with pathogens nor treated with chemicals. The larval gut and adult antenna of D. plexippus (SRA Project No.: PRJNA382538; PRJNA961744) and P. rapae (SRA Project No.: PRJNA554441; PRJNA631907) were filtered using Fastp v0.23.2 (Chen 2023) to obtain high‐quality data. The filtered reads were then mapped to the reference genomes using HISAT2 v2.2.1 (Kim et al. 2019); mapped reads were processed with SAMtools v1.16 and FeatureCounts v2.0.6 to construct gene expression matrices (Danecek et al. 2021; Liao et al. 2014). Raw expression values were transformed into transcripts per million 10 K (TPM10K) as the product of TPM and the total number of genes in the reference transcriptome (Munro et al. 2022). This normalization corrects for variation in reference gene set size across species and thereby reduces biases in cross‐species comparisons. Subsequently, normalized expression levels were log‐transformed for visualization.
Statistical Analysis
2.8
To assess the correlation between the number of GT1 genes and the evolutionary trajectories of butterfly specialists and generalists, a time‐calibrated species tree with divergence times was used (Kawahara et al. 2023). The phylANOVA function in the phytools package was applied to test for statistical differences in the total number of GT1, UGT33, and UGT40 genes among species with different host plant preferences (Rohlfs and Nielsen 2015). In addition, ANOVA was performed to determine the statistical differences in the GT1 gene numbers among butterfly families.
Results
3
High Intra‐Lineage Variation in
GT1 Copy Number
3.1
The number of GT1 genes varies substantially among butterfly species, with an average of 29 gene copies. The highest number of GT1 genes (57) was found in P. napi , while the lowest (16) was found in Satyrus ferula (Figure 1A). At the family level, the average number of GT1 genes differs substantially (F_5‐63_ = 6.70, p = 4.58e‐05); 25 in Papilionidae and Nymphalidae, 27 in Hesperiidae, 30 in Riodinidae, 38 in Pieridae, and 39 in Lycaenidae. GT1 gene numbers were generally lower in Nymphalidae, but a few species exhibited large numbers, such as 45 in Heterosais nephele and 41 in D. plexippus ; whereas Lycaenidae generally harbors higher GT1 numbers. Hesperiidae and Papilionidae displayed relatively stable gene numbers; in contrast, Pieridae exhibited the greatest interspecific variation, ranging from 20 to 57. In addition to the variation observed across families, we also detected considerable differences in GT1 gene numbers within genera. For example, species within the genus Pieris differ by 20 GT1 gene copies, indicating that GT1 gene expansion or contraction may occur among closely related species. However, the average copy numbers of GT1 genes showed no obvious differences in gene counts between generalist and specialist butterflies (Figure 1C). To further investigate the relationship between GT1 gene copy number and dietary breadth (generalist vs. specialist) in butterflies, we performed phylANOVA analyses incorporating the butterfly phylogenetic framework. Specifically, we tested for differences in the total number of GT1 genes between generalist and specialist species and found no significant difference in total GT1 (F_1‐67_ = 0.19, p = 0.71).
Phylogenetic tree of 69 butterfly species visualized using iTOL (A). Inner branches and colors indicate family‐level taxonomy (Kawahara et al. 2023), while outer bar plots represent the copy number of GT1 genes. Orange and green bars denote generalist and specialist species, respectively. The total GT1 gene numbers and the numbers of UGT33 and UGT40 subfamilies between generalist and specialist butterfly species (B). The gene number of GT1, UGT33, and UGT40 subfamilies in butterfly families (C).
Divergent Expansion of UGT Subfamilies Across Butterfly Families
3.2
By constructing a phylogenetic tree that integrates GT1 gene sequences from butterflies and UGT sequences from a few studied moth species, we classified butterfly GT1 genes into distinct clades based on the tree topology and clustering patterns of different UGT subfamilies (Figure 2A). Overall, the GT1 genes could be divided into four major clades, each of which contained several subclades. UGT33 and UGT40 were the predominant GT1 subfamilies in butterflies, constituting about 55% of the GT1 gene numbers in each species. In contrast, UGT34, UGT38, UGT44, UGT45, UGT47, UGT48, and UGT50 exhibited relatively low copy numbers, and some of these subfamilies were completely absent in certain species.
Phylogenetic tree of GT1 genes from butterflies and UGT genes from other Lepidopteran species constructed using IQtree2 and visualized with Dendroscope (A). Based on UGT classification data and GT1 clade topology, butterfly GT1 genes were grouped into distinct subfamilies. To further investigate the distribution patterns of UGT gene lineages among butterfly taxa, we classified species into 12 groups based on their feeding type (generalist [gen] or specialist [spe]) and family affiliation (Nymphalidae [Ny], Lycaenidae [Ly], Riodinidae [Ri], Pieridae [Pi], Papilionidae [Pa], and Hesperiidae [He]) (B). For each of these 12 phylogenetic‐feeding groups (family × feeding type), we calculated the proportion of genes falling into each UGT phylogenetic clade to assess potential associations between specific UGT sublineages and butterfly ecological traits.
Considerable differences were also observed in UGT subfamily composition across butterfly families. Nymphalidae (Ny), Lycaenidae (Ly), Riodinidae (Ri), and Pieridae (Pi) generally harbor more UGT33 copies (33.3%–41.7%) but fewer UGT40 copies (8.3%–26.8%) than Hasperidae and Papillionidae (27.1%–43% UGT40; 19.4%–29.1% UGT33); within the generalist Pieridae category, which is represented by only a single species, the UGT33 copy number is lower (20%) while the UGT40 copy number is higher (32%) compared with the other families. Additionally, the UGT41 subfamily is more expanded in Lycaenidae (Ly) than in other families. Despite these taxonomic differences, no clear difference was detected between generalist and specialist species in terms of GT1 gene distribution across different UGT subfamilies (Figure 2B), including in the large subfamilies UGT33 (phylANOVA, F_1‐67_ = 0.052, p = 0.86) and UGT40 (phylANOVA, F_1‐67_ = 1.29, p = 0.34).
Frequent GT1 Gene Turnover Independent of Host Range
3.3
By reconciling the GT1 gene phylogeny with the phylogenetic tree of butterflies, we inferred the gene duplication and loss events during butterfly evolution (Figure 3). Our analysis revealed that the common ancestor of butterflies possessed a large number (89) of GT1 gene copies. Throughout butterfly diversification, GT1 genes underwent extensive duplications and losses, particularly during the divergence of major butterfly families. Substantial changes in GT1 gene copy numbers were observed in the lineages leading to Papilionidae (Duplications: 21, Losses: 56) and Hesperiidae (Duplications: 35, Losses: 56). For specific subfamilies, the ancestral gene number was estimated to be 14 for UGT33 and 24 for UGT40. Gene turnover also occurred frequently during species divergence, for example, in Morpho helenor (UGT33:2,10; UGT40:11,2) and Laeosopis roboris (UGT33:9,10; UGT40:0,8).
Duplication and loss events of GT1 (A), UGT33 (B), and UGT40 (C) genes in butterflies. Red numbers above branches indicate gene duplications, blue numbers for gene losses, and the black number at the root node for the ancestral GT1 gene copy number.
To test whether gene turnover was associated with host plant range, we examined the number of GT1, UGT33, and UGT40 duplications and losses along terminal branches representing generalist and specialist species. We found no clear differences in GT1 gene duplication or loss patterns between generalist and specialist butterflies (Figure 4A). Instead, rapid evolutionary dynamics characterized by frequent gene duplications and losses appear to be a general feature of GT1 genes across all butterfly lineages. Correlation analysis between gene count and the GT1, UGT33, and UGT40 genes across species reveals a significant positive correlation between gene duplication and gene number in both generalist and specialist species (Figure 4). However, no significant correlation was observed between gene loss and gene number in the terminal branches of species.
The correlation statistics for gene duplication and loss of GT1 (A), UGT33 (B), and UGT40 (C) genes on terminal branches are presented in the figure. The left Y‐axis shows the number of gene duplications and losses in both generalist and specialist species. The right Y‐axis represents the correlation analysis between gene count and gene duplications/losses.
Tandem Duplication Dominates
GT1 Expansion With Subfamily‐Specific Patterns
3.4
In all four tested species, GT1 genes were retained through gene duplication events. Among the identified duplication modes, tandem duplication (A. agestis [28 in 49], D. plexippus [29 in 41], P. machaon [21 in 31], P. rapae [18 in 34]) was the predominant mode contributing to GT1 gene expansion (Figure 5). In contrast, P. rapae exhibited a relatively high proportion of GT1 genes derived from proximal duplications. At the subfamily level, members of UGT33 and UGT40 predominantly underwent tandem duplications, whereas UGT34, UGT39, UGT45, UGT47, UGT48, and UGT50 were primarily dispersed duplications. Notably, an expansion of UGT41 genes was observed in A. agestis, with a greater number of GT1 genes located outside collinearity regions. Overall, most GT1 genes are located within collinearity blocks and originated through gene duplications.
Genomic localization and duplication modes of identified GT1 genes. Gene names consist of species abbreviations and gene IDs. The species include Aa (Aricia agestis), Dp ( Danaus plexippus ), Pm ( Papilio machaon ) and Pr ( Pieris rapae ). Gene colors represent duplication modes: red for tandem duplication, blue for proximal duplication, and black for dispersed duplication. Connecting lines indicate collinearity blocks between genomic segments, with red lines highlighting collinearity regions containing GT1 genes.
Positive Selection Targets Functional Domains in Multiple
GT1 Subfamilies
3.5
To investigate the selective pressure on the GT1 genes during evolution, we used the FEL and MEME models in HyPhy to detect positive selection at individual codon sites across GT1 subfamilies. Based on these analyses, we identified significant signals of positive selection (p < 0.05) in the majority of GT1 genes, suggesting that many members have undergone adaptive evolution (Table 1). In particular, multiple positively selected sites were detected in UGT33 (5) and UGT40 (7), indicating that these subfamilies have experienced functional selection. No positively selected sites were detected in UGT34, UGT44, or UGT46. Notably, positively selected sites were primarily located within the functional domains of GT1 genes, with widespread distribution across both the N‐terminal substrate‐binding region and the C‐terminal donor‐binding region. UGT33 primarily exhibited positive selection at the C‐terminal (659, 1562, 2185), while UGT40 showed more positively selected amino acid sites at the N‐terminal (603, 753, 1401, 1403, 1428). This suggests that both functional domains may have been subject to selective pressures during evolution.
Subfamily‐Specific Expression in Larval Gut and Adult Antenna
3.6
To further explore how different GT1 genes are expressed in larval gut and adult antenna, the two main tissues associated with plant adaptation, we performed a combined analysis integrating gene expression data with GT1 phylogenetic trees in D. plexippus and P. rapae . The overall expression of GT1 genes showed a similar pattern in these two species, with genes highly expressed in adult antennae generally showing low expression in larval gut (Figure 6). UGT44 and UGT45 generally exhibited high expression levels, whereas UGT41, UGT46, and UGT47 showed overall low expression in both tissues.
Expression profiles of GT1 genes in the larval gut of the specialist species Pieris rapae and Danaus plexippus feeding on host plants with varying toxicity are presented. In addition, GT1 gene expression in the antennae of adult butterflies of both species was compared. The color of each gene indicates its mode of duplication.
Within UGT33 and UGT40, the two largest gene subfamilies, considerable variation in expression was observed among different genes. UGT33s (XP_022124072.2, XP_022129410.2, and XP_022129409.2) as well as UGT40s (XP_022117736.2, XP_022125328.2, XP_022117736.2, and XP_045487122.1) in P. rapae showed high expression in adult antennae but low expression in the larval gut. Similarly, UGT33s (XP_061384721.1, XP_061384702.1, XP_061384722.1, and XP_032521821.2) in D. plexippus were predominantly expressed in adult antennae. In contrast, other UGT33s in P. rapae (XP_022124068.2, XP_022129413.2, XP_045488239.1, XP_045488238.1, XP_045488012.1) and in D. plexippus (XP_032522026.2, XP_061384725.1, XP_032521892.2) exhibited high expression in the larval gut.
Interestingly, several genes closely located within the same phylogenetic branch exhibited markedly different expression patterns, such as UGT40 genes in P. rapae (XP_045487169.1 and XP_022125328.2), UGT33 genes (XP_032521821.2 and XP_061384739.1; XP_061384722.1 and XP_061384723.1), and UGT41 genes (XP_061384944.1 and XP_061384945.1) in D. plexippus .
In contrast, some tandem duplicated genes maintained high expression in adult antennae, for example, UGT33s (XP_045488239.1, XP_045488238.1, and XP_045488012.1) and UGT40 (XP_022125328.2) in P. rapae , and UGT33 (XP_061384721.1; XP_061384702.1) in D. plexippus . In addition, certain genes, such as UGT40s in P. rapae (XP_045487087.1 and XP_045487120.1) and in D. plexippus (XP_061379750.1, XP_061379749.1, XP_032522319.2), maintained high expression in both adult antennae and larval gut after tandem duplication.
Discussion
4
The interaction between butterflies and plants has been a focal point of evolutionary biology due to their coevolutionary processes, which involve the specialized metabolites in plants and the detoxification and plant‐feeding related enzymes in insects (Ehrlich and Raven 1964; Kawecki 1998; Janz and Nylin 1998). Among them, GT1 genes play important roles in various pathways, including metabolite digestion and host selection, and consequently contribute significantly to the adaptation of insects to host plants. In this study, we systematically identified and analyzed the evolutionary patterns of the GT1 gene family in butterflies, aiming to reveal its association with feeding habits, generalists and specialists of butterflies. The similar overall GT1 gene numbers between generalist and specialist species suggest that butterflies shared a similar GT1 repertoire for adaptation to host plant utilization. However, notable differences in the GT1 copy numbers were observed between species as well as species within the same genus. This variation is not only reflected in the overall number of GT1 genes but also in the GT1 subfamilies of UGT33 and UGT44, suggesting a complex evolutionary history of this family across butterfly species.
The GT1 gene family in butterflies exhibits significant changes during evolution. Our analysis inferred a relatively high number of GT1 gene copies in the common ancestor of butterflies (89), consistent with our previous studies and indicating an expanded GT1 gene number in ancestral butterflies (Wu et al. 2024). Notably, both UGT33 and UGT40 genes exhibited large copy numbers in most butterfly species, indicating their functions in the adaptation of butterflies to plant feeding (Ahn et al. 2012). The UGT33 and UGT40 family members have been related to the adaptation of moths to different host diets with varied specialized chemicals (Israni et al. 2020; Wang et al. 2024). Further evidence revealed different expansion patterns of both subfamilies in butterfly families; several butterfly families, such as Nymphalidae, Lycaenidae, Riodinidae, and Pieridae, primarily had expanded UGT33, while others, including Papilionidae and Hesperiidae, had expanded UGT40. In addition, the considerable expansion of UGT39 and UGT41 in butterflies compared with other lepidopteran species indicates lineage‐specific gene duplications (Wang et al. 2024). These varied GT1 subfamily expansions indicate diverse adaptive evolutionary traits of the GT1 family in various butterfly lineages in response to ecological pressures, such as differences in host plant chemistry.
In contrast, several UGT subfamilies experienced a reduction in copy numbers during evolution. However, the number of gene losses in the terminal branches did not significantly correlate with the GT1 gene number across species; instead, the duplication events in the terminal branches were positively correlated with the GT1 copy numbers. This may be associated with small‐scale gene duplications and subsequent genomic rearrangements and deletions that occurred in the ancestral lepidopteran lineages and internal branches (Roelofs et al. 2020). The extensive small‐scale gene duplications in ancestral lepidopteran lineages, coupled with subsequent gene specialization and selective retention, likely contributed to the adaptive evolutionary arms race between butterflies and their host plants (Edger et al. 2015). Butterflies did not show a continuous expansion or contraction in their host ranges, but exhibited alternating appearances of special and general feeding, which reflect oscillations in the host utilization range (Janz et al. 2006; Ferrer‐Paris et al. 2013) with some lineages returning to the primitive host plants (Janz et al. 2006). These frequent host preference shifts likely led to the retention of some key UGTs during host adaptation and may also have driven the dynamic gene duplications and losses observed in UGT families as a molecular mechanism to cope with fluctuating host chemical defenses (Luo et al. 2025).
Most of the butterfly GT1 genes were produced through tandem duplication in collinear regions, and this rapid amplification of gene copies likely promotes functional diversification (Zhou et al. 2019; Rogers et al. 2015), which may facilitate the adaptation of butterflies to different specialized chemicals related to shifted host plants. Recent work on the UGTs in the fall armyworm showed that the neofunctionalization of tandem duplications in the UGT33 subfamily contributed to the varied toleration to host plant specialized chemicals (Luo et al. 2025). Furthermore, these tandemly duplicated genes support that a small number of duplications following gene losses in their ancestors shaped the GT1 gene repertoire. Although the core function of GT1 enzymes is to catalyze glycosyl transfer reactions in insects, several family members are also involved in various metabolic pathways by substrate diversity and tissue‐specific expression, including plant specialized metabolite transformation, odorant signal regulation, and detoxification responses (Ahmad et al. 1996; Ahn et al. 2012; He et al. 2017; Huang et al. 2008; Israni et al. 2020; Song et al. 2021).
The functional diversification or substrate diversity of GT1s in butterflies may be related to adaptive changes of specific sites in the GT1 enzymes. The selection pressure analyses showed at least one positively selected site in most subfamilies, suggesting that GT1 genes had undergone adaptive evolution during the ecological diversification of butterfly species. The UGT domain typically consists of two functional regions, the N‐terminal region and the C‐terminal region. The N‐terminal region, responsible for substrate recognition and binding, exhibits high sequence variability among family members; the C‐terminal region, binding sugar donors such as UDP‐glucose, is generally conserved (Arriaza et al. 2023; Ahn et al. 2012). Using FEL and MEME models implemented in HyPhy, we identified several positively selected sites located within the functional domains, distributed across both the N‐terminal regions and C‐terminal regions. These results demonstrate that adaptive evolution in the UGT family involves not only diversification of substrate‐binding regions but also changes in donor‐binding regions (Arriaza et al. 2023). These positive selections may have driven functional divergence in both substrate and donor recognition capacities of certain UGT genes, contributing to host plant adaptation by binding diverse specialized metabolites or utilizing diverse sugar donors. In addition, mutations in a nonfunctional region can also contribute to the host range, as previous work on the fall armyworm showed the hindered related detoxification ability of host specialized chemicals and the reduced host width by a nonfunctional mutation (Wang et al. 2024). Furthermore, several UGT genes contain multiple GT1 domains; the presence of multiple UGT domains in some genes may further increase the complexity of substrate recognition and functional regulation.
Gene duplication and subsequent changes in selective pressures may be coupled with tissue‐specific expression, facilitating the functional diversification of GT1 genes (Innan and Kondrashov 2010; Gu et al. 2002; Genes 2000). Young duplicated genes often show tissue‐biased expression and gradually expand to other tissues in Drosophila (Jiang and Assis 2017; Assis and Bachtrog 2013); WGD‐derived gene duplications display more pronounced expression differences among tissues compared with single‐copy genes in Arabidopsis (Panchy et al. 2019; Wang et al. 2013). A similar pattern is observed in the GT1 gene family. The GT1 genes expressed in the larval gut mostly differ from those in adult antennae, indicating substantial functional divergence among UGT genes. This expression of GT1 genes in the adult antennae and the larval gut likely reflects the different ecological roles of adult and larval stages in host utilization (Futuyma and Moreno 1988). For example, a UGT33 highly expressed in S. frugiperda gut was primarily involved in larval detoxification capacity and adaptation to benzoxazinoids via glucosylation (Israni et al. 2020); while a UGT46A6 highly expressed in S. littoralis antennae played a role in protecting the olfactory organs from xenobiotic compounds (Bozzolan et al. 2014). Notably, several GT1 genes displayed generally high constitutive expression in the adult antennae, supporting their potential roles in host selection by chemical sensing or odorant perception (Bock 2016; Zhang et al. 2017). In addition, the high expression of a certain GT1 gene in insect antennae is also related to sex recognition. A UGT36 specifically expressed in Drosophila melanogaster antennae modulated sex pheromone discrimination and clearance (Fraichard et al. 2020). However, UGT44 and UGT45 exhibited high expression in both tissues, indicating their functions in both detoxification and sensory perception of plant secondary metabolites at different butterfly developmental stages.
GT1 genes are broadly involved in detoxification processes in the gut, but only a few genes showed regulated expression under different feeding conditions (Tan et al. 2019). This is consistent with previous studies on host adaptation in butterflies, which showed a small number of GT1 genes exhibiting changed expression when exposed to different plant specialized metabolites (Yu et al. 2016; Tan et al. 2019; Koenig et al. 2015). This suggests that the expression of limited rather than overall GT1 genes was involved in butterfly adaptation to plant specialized metabolites through transcriptional changes. As their detoxification genes enable them to handle not only host plant specialized metabolites but also other specialized metabolites (Koenig et al. 2015), the detoxification capacity of plant specialized metabolites might not be the only limiting factor for butterflies in host selection.
Overall, the evolutionary changes of the GT1 gene family, particularly the dynamic changes of gene copies and the positive selection in functional domains of different subfamilies, likely reflect their adaptation to diverse plant specialized metabolites in butterflies. Although no significant correlation was detected with host plant breadth, GT1 copy numbers vary substantially across species. In addition, the divergent expression of GT1 genes in the larval gut and adult antennae further supports that some GT1 genes have undergone functional specialization to cope with plant‐derived chemical stressors. However, relatively conserved GT1 gene expression patterns between the two representative species from two butterfly families indicate that GT1 expression captures a limited spectrum of adaptations. Instead, positive selection of specific GT1 genes in functional domains may be the main pathway facilitating adaptation to plant chemical defenses in butterflies.
However, this study has several limitations. Species were classified as generalists or specialists based on the number of host plant families. While this binary framework provides an initial comparative basis, the chemical profiles and morphological traits of host plants are similar across certain different families; consequently, generalist species may experience selective pressures comparable to those of specialists (Ali and Agrawal 2012). Furthermore, plants rarely rely on a single defense mechanism; multiple traits, such as chemical toxins, structural barriers, or nutrient limitation, are often employed simultaneously (Walling 2000). For instance, Poaceae not only produce benzoxazinoids as chemical deterrents but also develop silica‐based physical defenses (Massey et al. 2006; Wouters et al. 2014). Therefore, future work incorporating plant metabolite diversity and multitrait resistance strategies will be essential for fully elucidating the evolutionary dynamics of butterfly–host coadaptation.
Author Contributions
Jinyu Wu: data curation (equal), formal analysis (equal), writing – original draft (equal), writing – review and editing (equal). Hengyu Yan: data curation (equal), formal analysis (equal). Wanjiang Tang: data curation (equal), formal analysis (equal). Zhengyang Li: data curation (equal), formal analysis (equal). Amrita Chakraborty: resources (equal), writing – review and editing (equal). Zhengbo He: resources (equal), writing – review and editing (equal). Cao Zhou: resources (equal), writing – review and editing (equal). Shulin He: resources (equal), writing – review and editing (equal).
Conflicts of Interest
The authors declare no conflicts of interest.
Supporting information
Data S1: ece372291‐sup‐0001‐Supinfo1.rar.
Data S2: ece372291‐sup‐0002‐Supinfo2.rar.
Data S3: ece372291‐sup‐0003‐TableS1.xlsx.
The reference list from the paper itself. Each links out to its DOI / PubMed record.
- 1Ahmad, S. A. , T. L. Hopkins , and K. J. Kramer . 1996. “Tyrosine β‐Glucosyltransferase in the Tobacco Hornworm, Manduca sexta (L.): Properties, Tissue Localization, and Developmental Profile.” Insect Biochemistry and Molecular Biology 26, no. 1: 49–57.
- 2Ahn, S.‐J. , H. Vogel , and D. G. Heckel . 2012. “Comparative Analysis of the UDP‐Glycosyltransferase Multigene Family in Insects.” Insect Biochemistry and Molecular Biology 42, no. 2: 133–147.22155036 10.1016/j.ibmb.2011.11.006 · doi ↗ · pubmed ↗
- 3Ali, J. G. , and A. A. Agrawal . 2012. “Specialist Versus Generalist Insect Herbivores and Plant Defense.” Trends in Plant Science 17: 293–302.22425020 10.1016/j.tplants.2012.02.006 · doi ↗ · pubmed ↗
- 4Allio, R. , B. Nabholz , S. Wanke , et al. 2021. “Genome‐Wide Macroevolutionary Signatures of Key Innovations in Butterflies Colonizing New Host Plants.” Nature Communications 12: 354.10.1038/s 41467-020-20507-3PMC 780699433441560 · doi ↗ · pubmed ↗
- 5Arriaza, R. H. , B. Abiskaroon , M. Patel , et al. 2023. “Structural and Functional Studies Reveal the Molecular Basis of Substrate Promiscuity of a Glycosyltransferase Originating From a Major Agricultural Pest.” Journal of Biological Chemistry 299, no. 12: 105421.37923139 10.1016/j.jbc.2023.105421 PMC 10731231 · doi ↗ · pubmed ↗
- 6Assis, R. , and D. Bachtrog . 2013. “Neofunctionalization of Young Duplicate Genes In Drosophila.” Proceedings of the National Academy of Sciences 110: 17409–17414.10.1073/pnas.1313759110 PMC 380861424101476 · doi ↗ · pubmed ↗
- 7Bock, K. W. 2016. “The UDP‐Glycosyltransferase (UGT) Superfamily Expressed in Humans, Insects and Plants: Animal Plant Arms‐Race and Co‐Evolution.” Biochemical Pharmacology 99: 11–17.26453144 10.1016/j.bcp.2015.10.001 · doi ↗ · pubmed ↗
- 8Bozzolan, F. , D. Siaussat , A. Maria , et al. 2014. “Antennal Uridine Diphosphate (UDP)‐Glycosyltransferases in a Pest Insect: Diversity and Putative Function in Odorant and Xenobiotics Clearance.” Insect Molecular Biology 23: 539–549.24698447 10.1111/imb.12100 · doi ↗ · pubmed ↗