Prevention of Cardiovascular Disease Events and Deaths Among Black Adults Via Systolic Blood Pressure Equity
Shakia T. Hardy, Lei Huang, Lisandro D. Colantonio, Oluwasegun P. Akinyelure, Kathryn Foti, Lama Ghazi, Timothy B. Plante, Monika M. Safford, Paul Muntner

TL;DR
Reducing blood pressure disparities between Black and White adults in the US could prevent thousands of heart disease events and deaths over 10 years.
Contribution
The study quantifies the potential impact of achieving systolic blood pressure equity on cardiovascular outcomes in non-Hispanic Black adults.
Findings
Achieving SBP equity could prevent over 170,000 CVD events and 75,000 deaths in non-Hispanic Black adults over 10 years.
More than half of the prevented events occur in individuals aged 45 to 64 years.
SBP equity could reduce CVD events and deaths even among those already on antihypertensive medication.
Abstract
What number of cardiovascular disease (CVD) events and deaths could be prevented among US non-Hispanic Black adults if their mean systolic blood pressure (SBP) were lowered to equal that of non-Hispanic White adults? In this modeling study of 10.1 million US Black adults, achieving SBP equity was projected to prevent more than 170 000 CVD events and 75 000 CVD deaths during 10 years among non-Hispanic Black adults 45 years or older, with more than half of the reductions occurring in individuals aged 45 to 64 years. These findings suggest that achieving SBP equity between Black and White adults could substantially reduce CVD burden and may have a substantial impact on equity-focused prevention. This modeling study estimates the number of cardiovascular disease (CVD) events and deaths that could be prevented among non-Hispanic Black adults in the US by achieving systolic blood pressure…
Genes, proteins, chemicals, diseases, species, mutations and cell lines named across the full text — each resolved to its canonical identifier and authoritative record.
Click any figure to enlarge with its caption.
 Figure
| Characteristic | Not taking antihypertensive medication, % (95% CI) | Taking antihypertensive medication, % (95% CI) | ||
|---|---|---|---|---|
| Non-Hispanic White adults (n = 1330) | Non-Hispanic Black adults (n = 688) | Non-Hispanic White adults (n = 887) | Non-Hispanic Black adults (n = 824) | |
| Age, y | ||||
| 45-64 | 71.5 (67.3-75.4) | 81.2 (77.9-84.2) | 48.3 (44.4-52.1) | 64.1 (60.1-68.0) |
| 65-74 | 19.0 (15.7-22.7) | 12.5 (9.6-15.8) | 31.4 (27.0-36.0) | 22.1 (19.3-25.1) |
| ≥75 | 9.5 (7.8-11.4) | 6.3 (4.6-8.4) | 20.3 (17.7-23.1) | 13.7 (11.0-16.8) |
| Sex | ||||
| Men | 46.3 (43.6-49.0) | 48.5 (44.5- 52.5) | 44.1 (40.1- 48.1) | 38.7 (35.2-42.3) |
| Women | 53.7 (51.0-56.4) | 51.5 (47.5-55.5) | 55.9 (51.9-59.9) | 61.3 (57.7-64.8) |
| BMI | ||||
| Healthy weight (<25) | 29.9 (26.2-33.8) | 25.5 (21.7-29.6) | 14.5 (11.8-17.5) | 14.0 (11.2-17.1) |
| Overweight (25-29.9) | 37.7 (34.3-41.3) | 34.2 (30.4-38.0) | 32.1 (27.4-37.0) | 25.0 (22.0-28.2) |
| Obesity (≥30) | 32.4 (29.7-35.1) | 40.3 (36.4-44.4) | 53.4 (49.0-57.8) | 61.0 (57.0-65.0) |
| Diabetes | 8.0 (6.0-10.5) | 12.0 (9.7-14.7) | 24.0 (21.2-27.0) | 35.3 (31.8-38.9) |
| Poverty-to-income ratio | ||||
| <1.30 | 8.9 (7.1-10.9) | 26.1 (21.4-31.2) | 11.0 (8.4-14.1) | 31.3 (27.6-35.1) |
| 1.30-3.49 | 26.8 (22.9-31.0) | 40.6 (35.7-45.8) | 36.2 (32.5-39.9) | 36.0 (31.6-40.6) |
| ≥3.50 | 64.4 (60.1-68.5) | 33.3 (27.3-39.7) | 52.8 (48.1-57.5) | 32.7 (26.8-39.2) |
| Health insurance | ||||
| Private | 55.0 (50.3-59.6) | 43.8 (37.7-49.9) | 36.5 (32.4-40.8) | 32.9 (28.2-38.0) |
| Medicare | 21.8 (18.6-25.3) | 16.1 (13.4-19.1) | 38.1 (34.2-42.1) | 23.6 (20.1-27.4) |
| Medicaid | 3.6 (2.5-4.9) | 12.5 (8.9-16.9) | 4.7 (3.2-6.6) | 17.4 (14.0-21.1) |
| Other government | 13.4 (10.7-16.3) | 13.0 (9.7-16.9) | 17.3 (14.3-20.7) | 18.3 (15.6-21.2) |
| Uninsured | 6.2 (4.4-8.6) | 14.6 (12.0-17.5) | 3.4 (2.2-4.8) | 7.8 (5.8-10.1) |
| Current smoking | 13.2 (11.4-15.3) | 23.7 (20.0-27.7) | 13.2 (10.0-16.9) | 20.1 (17.1-23.5) |
| Alcohol consumption | ||||
| Heavy | 9.2 (7.0-11.9) | 7.5 (5.1-10.7) | 7.8 (5.6-10.5) | 6.8 (5.2-8.9) |
| Moderate | 67.2 (63.2-70.9) | 62.1 (58.1-66.0) | 62.9 (57.4-68.0) | 53.2 (49.1-57.3) |
| None | 23.6 (20.5-26.9) | 30.4 (26.6-34.4) | 29.4 (24.9-34.2) | 40.0 (36.3-43.7) |
| ≥150 min of Physical activity per week | 67.2 (64.2-70.0) | 52.7 (48.9-56.5) | 53.4 (48.5-58.2) | 48.3 (43.8-52.9) |
| SBP, mean (95% CI), mm Hg | 124.2 (123.1-125.3) | 130.7 (129.0-132.5) | 131.2 (129.7-132.7) | 137.8 (135.8-139.8) |
| DBP, mean (95% CI), mm Hg | 72.2 (71.5-72.9) | 75.2 (74.3-76.2) | 71.3 (70.3-72.3) | 75.4 (73.8-76.9) |
| Age, y | SBP, mm Hg | Difference in SBP, mm Hg | DBP, mm Hg | Difference in DBP, mm Hg | ||
|---|---|---|---|---|---|---|
| Non-Hispanic White adults | Non-Hispanic Black adults | Non-Hispanic White adults | Non-Hispanic Black adults | |||
|
| ||||||
| All | ||||||
| 45-64 | 122.0 (120.8-123.2) | 128.6 (126.8-130.3) | 6.5 (4.5-8.6) | 73.6 (72.9-74.4) | 75.9 (74.8-77.0) | 2.2 (1.0-3.5) |
| 65-74 | 126.7 (124.4-128.9) | 137.7 (133.1-142.3) | 11.0 (5.5-16.5) | 69.5 (67.9-71.2) | 75.0 (72.7-77.4) | 5.5 (2.8-8.1) |
| ≥75 | 135.7 (132.9-138.5) | 145.0 (138.8-151.2) | 9.3 (2.7-15.9) | 66.6 (65.2-68.0) | 67.1 (63.1-71.1) | 0.5 (−3.9-4.9) |
| Overall | 124.2 (123.1-125.3) | 130.7 (129.0-132.5) | 6.5 (4.5-8.5) | 72.2 (71.5-72.9) | 75.2 (74.3-76.2) | 3.0 (1.8-4.2) |
| Men | ||||||
| 45-64 | 124.3 (122.9-125.6) | 130.1 (127.9-132.3) | 5.8 (3.4-8.3) | 75.3 (74.2-76.4) | 76.7 (75.3-78.2) | 1.4 (−0.1-3.0) |
| 65-74 | 125.5 (122.7-128.3) | 135.5 (130.2-140.9) | 10.0 (3.6-16.3) | 70.0 (67.8-72.2) | 74.6 (71.4-77.9) | 4.6 (1.0-8.3) |
| ≥75 | 132.4 (129.9-134.9) | 140.8 (134.2-147.3) | 8.3 (1.3-15.4) | 65.3 (63.3-67.3) | 68.7 (62.5-74.9) | 3.5 (−2.9-9.8) |
| Overall | 125.2 (123.9-126.5) | 131.6 (129.3-133.9) | 6.4 (4.0-8.9) | 73.4 (72.4-74.4) | 75.9 (74.7-77.0) | 2.4 (1.0-3.9) |
| Women | ||||||
| 45-64 | 120.1 (118.3-121.8) | 127.2 (124.4-130.0) | 7.1 (3.6-10.7) | 72.2 (71.3-73.1) | 75.1 (73.2-77.1) | 2.9 (0.8-5.1) |
| 65-74 | 127.8 (124.2-131.3) | 140.5 (133.2-147.8) | 12.7 (4.9-20.6) | 69.1 (67.0-71.2) | 75.5 (72.3-78.7) | 6.4 (2.7-10.0) |
| ≥75 | 137.9 (133.6-142.1) | 149.7 (138.0-161.4) | 11.9 (−0.1-23.8) | 67.5 (65.6-69.5) | 65.2 (60.2-70.3) | −2.3 (−7.8-3.2) |
| Overall | 123.4 (121.6-125.1) | 129.9 (126.8-132.9) | 6.5 (2.9-10.1) | 71.1 (70.3-72.0) | 74.6 (72.9-76.3) | 3.5 (1.6-5.4) |
|
| ||||||
| All | ||||||
| 45-64 | 126.9 (124.9-128.8) | 134.9 (132.8-137.1) | 8.1 (5.4-10.7) | 74.3 (73.1-75.5) | 77.7 (75.8-79.6) | 3.4 (0.9-5.9) |
| 65-74 | 132.8 (130.0-135.7) | 138.8 (136.4-141.1) | 5.9 (2.3-9.5) | 69.7 (67.4-72.0) | 72.1 (70.2-74.0) | 2.4 (−1.2-6.0) |
| ≥75 | 139.0 (136.0-142.0) | 149.3 (143.4-155.1) | 10.3 (4.3-16.2) | 66.8 (65.1-68.4) | 69.6 (66.2-73.1) | 2.9 (−0.9-6.6) |
| Overall | 131.2 (129.7-132.7) | 137.8 (135.8-139.8) | 6.5 (4.0-9.1) | 71.3 (70.3-72.3) | 75.4 (73.8-76.9) | 4.0 (1.9-6.1) |
| Men | ||||||
| 45-64 | 127.7 (125.0-130.4) | 137.7 (135.9-139.5) | 10.0 (6.5-13.4) | 74.5 (72.9-76.1) | 79.6 (76.8-82.3) | 5.1 (1.6-8.6) |
| 65-74 | 132.2 (128.3-136.1) | 138.1 (133.4-142.9) | 5.9 (−0.4-12.2) | 70.0 (67.4-72.6) | 73.6 (71.6-75.6) | 3.6 (0.1-7.1) |
| ≥75 | 135.8 (133.0-138.7) | 141.1 (135.1-147.1) | 5.2 (−1.3-11.8) | 66.6 (64.5-68.6) | 66.8 (63.4-70.2) | 0.3 (−3.8-4.4) |
| Overall | 130.5 (128.7-132.3) | 138.2 (136.4-139.9) | 7.7 (5.2-10.1) | 71.8 (70.7-72.8) | 76.9 (74.7-79.2) | 5.2 (2.5-7.9) |
| Women | ||||||
| 45-64 | 126.1 (123.4-128.8) | 133.0 (130.0-136.0) | 7.0 (3.3-10.6) | 74.1 (72.4-75.8) | 76.4 (74.6-78.2) | 2.3 (−0.4-5.0) |
| 65-74 | 133.3 (129.6-137.0) | 139.1 (136.1-142.2) | 5.8 (1.3-10.4) | 69.5 (66.3-72.6) | 71.2 (68.3-74.1) | 1.7 (−3.1-6.5) |
| ≥75 | 141.0 (137.0-145.0) | 152.7 (145.6-159.9) | 11.8 (4.5-19.1) | 66.9 (64.6-69.1) | 70.8 (66.4-75.2) | 3.9 (−0.9-8.7) |
| Overall | 131.8 (129.8-133.8) | 137.5 (134.9-140.1) | 5.7 (2.4-9.0) | 70.9 (69.5-72.4) | 74.4 (72.7-76.0) | 3.4 (1.0-5.8) |
| Age, y | Ten-y Cumulative incidence, % (95% CI) | |||||
|---|---|---|---|---|---|---|
| Not taking antihypertensive medication | Taking antihypertensive medication | |||||
| Overall | Non-Hispanic Black men | Non-Hispanic Black women | Overall | Non-Hispanic Black men | Non-Hispanic Black women | |
| CVD events | ||||||
| 45-64 | 6.2 (5.1-7.4) | 9.0 (7.4-11.1) | 4.2 (3.1-5.5) | 14.1 (13.0-15.3) | 17.1 (15.2-19.2) | 12.5 (11.0-14.2) |
| 65-74 | 11.9 (10.1-14.0) | 14.5 (11.9-17.8) | 9.6 (7.5-12.3) | 20.4 (18.8-22.2) | 22.1 (19.8-24.7) | 19.5 (17.6-21.5) |
| ≥75 | 17.7 (14.5-21.6) | 20.0 (15.5-26.0) | 15.5 (11.7-20.5) | 21.9 (19.7-24.3) | 23.9 (20.3-28.3) | 20.7 (17.9-23.9) |
| Overall | 9.4 (8.5-10.3) | 12.3 (10.8-14.0) | 7.1 (6.0-8.3) | 17.6 (16.6-18.6) | 20.1 (18.5-21.8) | 16.2 (15.3-17.3) |
| CVD deaths | ||||||
| 45-64 | 2.3 (1.7-3.0) | 3.5 (2.5-5.0) | 1.4 (0.9-2.2) | 6.7 (5.9-7.7) | 9.6 (8.1-11.5) | 5.2 (4.2-6.4) |
| 65-74 | 7.4 (6.0-9.1) | 8.7 (6.4-11.8) | 6.3 (4.4-8.9) | 10.7 (9.3-12.3) | 13.5 (11.4-16.0) | 9.1 (7.7-10.7) |
| ≥75 | 17.7 (14.3-21.9) | 20.1 (15.5-26.2) | 15.4 (11.8-20.0) | 18.3 (16.1-20.8) | 21.3 (17.9-25.3) | 16.5 (14.0-19.5) |
| Overall | 5.9 (5.1-6.7) | 7.6 (6.5-9.0) | 4.5 (3.7-5.6) | 10.1 (9.4-10.8) | 13.1 (11.9-14.4) | 8.4 (7.6-9.3) |
| Age, y | Overall events | Men | Women | ||||||
|---|---|---|---|---|---|---|---|---|---|
| No. in millions (95% CI) | Difference, No. (95% CI) | No. in millions (95% CI) | Difference, No. (95% CI) | No. in millions (95% CI) | Difference, No. (95% CI) | ||||
| Current SBP | SBP equity | Current SBP | SBP equity | Current SBP | SBP equity | ||||
|
| |||||||||
| Antihypertensive medication use | |||||||||
| 45-64 | 0.25 (0.21-0.29) | 0.22 (0.18-0.26) | 27 759 (17 704-42 052) | 0.16 (0.13-0.20) | 0.15 (0.12-0.18) | 17 030 (8786-36 794) | 0.09 (0.07-0.11) | 0.07 (0.06-0.10) | 10 729 (5713-17 785) |
| 65-74 | 0.07 (0.06-0.09) | 0.06 (0.05-0.07) | 13 656 (7696-21 832) | 0.05 (0.04-0.06) | 0.04 (0.03-0.05) | 8380 (3684-15 362) | 0.02 (0.02-0.03) | 0.02 (0.02-0.03) | 5276 (2195-9218) |
| ≥75 | 0.05 (0.04-0.06) | 0.04 (0.04-0.06) | 9019 (3391-15 959) | 0.03 (0.02-0.04) | 0.03 (0.02-0.04) | 4658 (1068-9879) | 0.02 (0.02-0.03) | 0.02 (0.01-0.02) | 4361 (90-9237) |
| Total | 0.38 (0.33-0.42) | 0.33 (0.28-0.37) | 50 434 (33 985-71 137) | 0.24 (0.21-0.30) | 0.21 (0.18-0.25) | 30 068 (19 134-45 102) | 0.13 (0.11-0.16) | 0.11 (0.09-0.14) | 20 366 (12 232-31 022) |
| Antihypertensive medication nonuse | |||||||||
| 45-64 | 0.49 (0.45-0.53) | 0.42 (0.37-0.46) | 71 789 (45 183-101 755) | 0.24 (0.21-0.27) | 0.20 (0.17-0.23) | 40 977 (26 220-59 994) | 0.25 (0.22-0.29) | 0.22 (0.19-0.26) | 30 813 (14 016-53 690) |
| 65-74 | 0.24 (0.22-0.26) | 0.21 (0.19-0.24) | 25 151 (10 462-43 603) | 0.10 (0.09-0.11) | 0.09 (0.07-0.10) | 10 209 (673-20 959) | 0.14 (0.13-0.16) | 0.13 (0.11-0.15) | 14 943 (3894-30 445) |
| ≥75 | 0.16 (0.14-0.18) | 0.13 (0.16-0.21) | 25 941 (11 427-43 981) | 0.05 (0.04-0.06) | 0.05 (0.04-0.06) | 4.909 (−1189-11 992) | 0.11 (0.09-0.12) | 0.08 (0.07-0.11) | 21 032 (7594-36 953) |
| Total | 0.89 (0.84-0.93) | 0.76 (0.70-0.82) | 122 881 (83 220-176 826) | 0.39 (0.36-0.42) | 0.33 (0.30-0.36) | 56 094 (35 455-82 179) | 0.50 (0.47-0.54) | 0.43 (0.39-0.48) | 66 787 (40 125-104 098) |
|
| |||||||||
| Antihypertensive medication use | |||||||||
| 45-64 | 0.09 (0.07-0.12) | 0.08 (0.06-0.11) | 7960 (2231-12 572) | 0.06 (0.04-0.09) | 0.06 (0.04-0.09) | 5178 (1625-10 970) | 0.03 (0.02-0.04) | 0.03 (0.02-0.04) | 2782 (853-6481) |
| 65-74 | 0.05 (0.04-0.06) | 0.04 (0.03-0.05) | 6657 (2170-13 686) | 0.03 (0.02-0.04) | 0.03 (0.02-0.04) | 3947 (1287-9472) | 0.02 (0.01-0.02) | 0.01 (0.01-0.02) | 2711 (783-6438) |
| ≥75 | 0.05 (0.04-0.06) | 0.05 (0.04-0.06) | 7085 (1708-15 542) | 0.03 (0.02-0.04) | 0.03 (0.02-0.04) | 3662 (599-9651) | 0.02 (0.02-0.03) | 0.02 (0.01-0.03) | 3423 (164-9334) |
| Total | 0.19 (0.16-0.22) | 0.17 (0.14-0.20) | 21 703 (7313-40 278) | 0.13 (0.10-0.15) | 0.11 (0.09-0.14) | 12 787 (4352-24 754) | 0.07 (0.05-0.08) | 0.06 (0.04-0.07) | 8916 (2849-18 245) |
| Antihypertensive medication nonuse | |||||||||
| 45-64 | 0.24 (0.21-0.27) | 0.21 (0.18-0.25) | 28 102 (9696-51 558) | 0.13 (0.11-0.16) | 0.12 (0.09-0.14) | 18 123 (6185-33 283) | 0.10 (0.08-0.13) | 0.09 (0.07-0.12) | 9979 (3125-23 432) |
| 65-74 | 0.13 (0.11-0.14) | 0.12 (0.10-0.13) | 10 291 (3220-23 863) | 0.06 (0.05-0.07) | 0.05 (0.04-0.07) | 4859 (613-13 171) | 0.07 (0.06-0.08) | 0.06 (0.05-0.07) | 5432 (1292-14 664) |
| ≥75 | 0.13 (0.12-0.15) | 0.11 (0.09-0.13) | 16 662 (5229-37 515) | 0.05 (0.04-0.06) | 0.04 (0.03-0.05) | 3401 (−336-10 681) | 0.08 (0.07-0.10) | 0.07 (0.05-0.09) | 13 262 (3559-28 870) |
| Total | 0.50 (0.46-0.53) | 0.44 (0.39-0.49) | 55 055 (19 823-99 693) | 0.24 (0.21-0.27) | 0.21 (0.18-0.24) | 26 382 (9373-49 031) | 0.26 (0.23-0.29) | 0.23 (0.19-0.26) | 28 672 (10 152-57 705) |
Peer Reviews
No public reviews on file for this paper yet. If you reviewed it on a platform where reviews are public (OpenReview, ICLR, NeurIPS, ICML), you can paste yours below so the community can read it here.
Videos
No videos yet. Explain this paper in a talk, walkthrough, or lecture? Add one.
Taxonomy
TopicsBlood Pressure and Hypertension Studies · Cardiovascular Health and Risk Factors · Medication Adherence and Compliance
Introduction
High blood pressure (BP) contributes to more cardiovascular disease (CVD) events and deaths than any other modifiable risk factor in the US and worldwide.^1,2,3^ Randomized clinical trials have demonstrated the efficacy of nonpharmacologic interventions and antihypertensive medication for lowering BP and preventing CVD.^4,5^ Despite the availability of approaches to reduce BP among all racial and ethnic groups, racial disparities in systolic BP (SBP) have persisted for decades, contributing to a higher rate of CVD events and mortality among non-Hispanic Black compared with non-Hispanic White US adults.^6,7,8^
Disparities in hypertension and BP control can be eliminated. A prior analysis of the Reasons for Geographic and Racial Differences in Stroke (REGARDS) study^9^ found that modifiable social and behavioral factors explained most of the higher incidence of hypertension among Black compared with White adults. In the Systolic Blood Pressure Intervention Trial (SPRINT),^10^ which included adults with hypertension, non-Hispanic Black and White participants achieved comparable SBP levels and the same reduction in CVD after intensive antihypertensive medication treatment to a goal of 120 mm Hg or less.
The purpose of the present study was to estimate the number of CVD events and deaths that could be prevented among non-Hispanic Black adults by achieving SBP equity (ie, the same mean SBP as experienced by non-Hispanic White adults in the US). To accomplish this goal, we analyzed data from the National Health and Nutrition Examination Survey (NHANES) as the reference standard for nationally representative BP data, the REGARDS study for contemporary estimates of CVD incidences in the US, and published estimates of the reduction in CVD events and CVD mortality with BP lowering from the Blood Pressure Lowering Treatment Trialists Collaboration (BPLTTC).^11^
Methods
Data Sources
This modeling study followed the Strengthening the Reporting of Observational Studies in Epidemiology (STROBE) reporting guideline. NHANES was designed to assess the health and nutritional status of the noninstitutionalized US population. Since the 1999-2000 cycle, the National Center for Health Statistics has conducted NHANES in 2-year cycles using a multistage probability sampling design.^12^ The publicly available data files for the NHANES 2015-2016 and 2017-2020 cycles were pooled for the current analysis. The National Center for Health Statistics Institutional Review Board approved the study protocol for each NHANES cycle, and written informed consent was obtained from each participant.
The REGARDS study enrolled a population-based cohort of 30 239 non-Hispanic Black and White US adults 45 years or older from the 48 contiguous US states and Washington, DC.^13^ The REGARDS study participants completed a baseline visit between 2003 and 2007 and have been followed up for CVD events and mortality. The REGARDS study was approved by the institutional review boards of all participating institutions, and all participants provided written informed consent.
The BPLTTC has published estimates of the reduction in CVD events and mortality rates associated with 5–mm Hg lower SBP through antihypertensive medication treatment using individual participant data from more than 50 large-scale outcome trials.^11^ Estimates from participants without a history of CVD were used in the present analysis. The BPLTTC obtained ethics review approval from the Oxford Central Ethics University Research Committee.
Data Collection
NHANES
NHANES data were collected during an in-home interview and a study visit at a mobile examination center. Of relevance to the current analysis, age, sex, race and ethnicity, income-to-poverty ratio, type of health insurance, smoking status, alcohol intake, and physical activity were self-reported and assessed using standardized questionnaires. Using calibrated equipment, height and weight were measured during the NHANES examination following a standardized protocol. Body mass index was calculated as weight in kilograms divided by height in meters squared. Glycated hemoglobin level was measured using standard methods. Diabetes was defined as glycated hemoglobin levels of 6.5% or greater or self-reported use of insulin or oral medication to lower glucose levels.
Trained physicians measured BP following a standardized protocol. After 5 minutes of seated rest, as many as 3 BP measurements were obtained at 30-second intervals using an appropriately sized BP cuff and a mercury sphygmomanometer in the NHANES 2015-2016 cycle and a validated oscillometric device in the NHANES 2017-2020 cycle. Based on the evaluation of the differences in mean SBP and diastolic BP (DBP) when measured by the 2 devices, we calibrated the oscillometric device values to the mercury device values by adding 1.5 mm Hg to oscillometric-measured SBP and subtracting 1.3 mm Hg from oscillometric-measured DBP for participants in the NHANES 2017-2020 cycle.^14^
NHANES study participants who were 45 years or older, attended the interview and examination, had at least 1 SBP and 1 DBP measurement, had self-reported information on antihypertensive medication use, and had self-reported being non-Hispanic Black or non-Hispanic White were included in the analysis (eFigure 1 in Supplement 1). We excluded participants who self-reported a history of CHD, stroke, or heart failure.
REGARDS Study
At baseline, data were collected by trained research staff through computer-assisted telephone interviews and by trained technicians during a subsequent in-home study visit.^13^ REGARDS study participants were included in this analysis if they had at least 1 SBP and 1 DBP measurement at baseline, had self-reported information on antihypertensive medication use and follow-up data for outcomes, and had no CVD, including self-reported CHD, stroke, or suspected heart failure at baseline. The final sample size was 28 574 participants (eFigure 2 in Supplement 1).^15^
During twice-annual phone calls, participants or their proxies were asked to report hospitalizations, and proxies were asked to report details surrounding the deaths of participants. Medical records for suspected heart disease or stroke hospitalizations were retrieved for adjudication. Expert clinician adjudication of CVD events in the REGARDS study, including fatal or nonfatal stroke, CHD defined by fatal and nonfatal myocardial infarction or CHD death, and fatal or nonfatal heart failure hospitalizations, have been described previously and followed national guidelines.^16^
BPLTTC
We abstracted the relative risk (RR) for CVD, including stroke, CHD, or heart failure, and CVD mortality associated with a 5–mm Hg reduction in SBP with initiation and intensification of antihypertensive medication use among those without a history of CVD from the BPLTTC publication.^11^ The BPLTTC defined CHD as fatal or nonfatal myocardial infarction or ischemic heart disease, stroke as a composite of fatal or nonfatal stroke, and heart failure as death or hospital admission due to heart failure.
Statistical Analysis
Data were analyzed from June 22, 2022, to August 13, 2025. All analyses were stratified by age (45-64, 65-74, and ≥75 years), race and ethnicity, and sex. Using NHANES 2015-2020 data, we estimated the number, characteristics, and, separately, mean SBP and DBP for non-Hispanic Black and White US adults who were and were not taking antihypertensive medication.
Using data from the REGARDS study, we estimated the overall and age- and sex-specific 10-year cumulative incidence of CVD, stroke, CHD, heart failure, and CVD mortality among non-Hispanic Black adults who were and were not taking antihypertensive medication. For analyses of CVD, stroke, CHD, and heart failure, we accounted for the competing risk of death using a semiparametric Fine-Gray model.^17^ For analyses of CVD mortality, we accounted for the competing risk of non-CVD mortality.
The following analyses were completed separately for those not taking and taking antihypertensive medication. The analysis for US adults not taking antihypertensive medication is detailed later in this section and was repeated for US adults taking antihypertensive medication. We estimated the number of CVD events expected to occur during 10 years among non-Hispanic Black US adults with their current SBP levels. To do so, we calculated the number of US non-Hispanic Black adults not taking antihypertensive medication within each age-sex subgroup from the NHANES 2015-2020 cycles. We multiplied the number of US Black adults not taking antihypertensive medication within age and sex subgroup by the age- and sex-specific 10-year cumulative incidence of CVD from the REGARDS study. We summed the number of events across age and sex subgroups to estimate the total number of CVD events expected with current SBP levels among non-Hispanic Black adults.
We conducted the following 2 steps to estimate the number of CVD events expected during the next 10 years among US Black adults if SBP equity was achieved. First, we calibrated the RR for CVD from the BPLTTC to reflect the difference in SBP between Black and White adults from NHANES 2015-2020 cycles using the following equation:
Second, within each age and sex subgroup, we multiplied the number of non-Hispanic Black US adults not taking antihypertensive medication by the 10-year cumulative incidence of CVD among non-Hispanic Black adults and the calibrated RR estimated in step 1.
Among non-Hispanic Black adults, we subtracted the number of CVD events expected with SBP equity from the number of CVD events expected with current SBP levels (ie, the natural course). We summed the number of CVD events across age and sex subgroups to estimate the total number of CVD events expected with SBP equity among non-Hispanic Black adults. We estimated 95% CIs for the projected number of preventable cardiovascular events using 1000-iteration Monte-Carlo simulations. In each iteration, we sampled from the assumed normal distributions of the NHANES estimates, 10-year cumulative incidence estimates, and RRs from the BPLTTC and reran the aforementioned analytic steps. Bias-corrected 95% CIs were obtained from the resulting distributions. These analyses were repeated for the following outcomes: stroke, CHD, heart failure, and CVD mortality. Given potential issues with transportability of the RRs from the BPLTTC to the US population, we conducted a sensitivity analysis that assumed a 10% increase and 10% decrease in the effectiveness of BP lowering on CVD events among the US population compared with the BPLTTC population. The analysis of NHANES data accounted for the multistage approach to selecting participants and were weighted to provide estimates for the noninstitutionalized US population. All analyses were conducted using SAS, version 9.2 (SAS Institute Inc), and R, version 4.3.2 (R Program for Statistical Computing).
Results
A total of 82.3 million US adults were included in the study; 37.2 million (45.3%) were men, 45.0 million (54.7%) were women, 10.1 million (12.2%) were non-Hispanic Black, and 72.2 million (87.8%) were non-Hispanic White. The mean (SD) age was 60.8 (0.3) years. In the NHANES 2015-2020 cycles, non-Hispanic Black adults not taking and taking antihypertensive medication were more likely than non-Hispanic White adults to be 45 to 64 years of age vs 65 to 74 years or 75 years and older; to have obesity, diabetes, and an income-to-poverty ratio less than 1.30; to be current smokers; and not to consume alcohol. Non-Hispanic Black adults were less likely than non-Hispanic White adults to have at least 150 minutes of physical activity per week (Table 1).
Mean SBP and DBP Using NHANES 2015-2020 Data
Among non-Hispanic Black and non-Hispanic White US adults, the mean SBP was 130.7 (95% CI, 129.0-132.5) and 124.2 (95% CI, 123.1-125.3) mm Hg, respectively (difference, 6.5 [95% CI, 4.5-8.5] mm Hg), for those not taking antihypertensive medication and 137.8 (95% CI, 135.8-139.8) and 131.2 (95% CI, 129.7-132.7) mm Hg, respectively (difference, 6.5 [95% CI, 4.0-9.1] mm Hg) for those taking antihypertensive medication (Table 2). The mean SBP was higher among non-Hispanic Black compared with non-Hispanic White men and women in each age group. The mean DBP by antihypertensive medication status, age, race and ethnicity, and sex is also shown in Table 2.
Number of US Adults 45 Years and Older, NHANES 2015-2020 Data
In 2015 to 2020 in the US, there were 2.3 (95% CI, 1.9-2.7) million non-Hispanic Black men and 2.4 (95% CI, 1.8-3.1) million non-Hispanic Black women 45 years and older not taking antihypertensive medication. There were 2.1 (95% CI, 1.6-2.5) million non-Hispanic Black men and 3.3 (95% CI, 2.5-4.0) million non-Hispanic Black women 45 years and older taking antihypertensive medication (eTable 1 in Supplement 1).
Ten-Year Cumulative Incidence of CVD and CVD Mortality Using REGARDS Data
The 10-year cumulative incidence of CVD events was 9.4% (95% CI, 8.5%-10.3%) among non-Hispanic Black adults 45 years and older not taking antihypertensive medication and 17.6% (95% CI, 16.6%-18.6%) among those taking antihypertensive medication (Table 3). The 10-year cumulative incidence of CVD deaths among non-Hispanic Black adults 45 years and older not taking antihypertensive medication was 5.9% (95% CI, 5.1%-6.7%); among those taking antihypertensive medication, it was 10.1% (95% CI, 9.4%-10.8%). For non-Hispanic Black adults not taking and taking antihypertensive medication, the 10-year cumulative incidence of CVD events and CVD mortality was higher among men compared with women and increased with age. The 10-year cumulative incidence of CHD, stroke, and heart failure among non-Hispanic Black men and women are reported in eTable 2 in Supplement 1.
Reduction in Incident Events and Deaths With Achievement of Equity in SBP
The RRs of incident CVD, stroke, CHD, and heart failure and CVD mortality associated with a 5–mm Hg reduction in SBP from the BPLTTC and calibrated to reflect the difference in SBP between non-Hispanic Black and non-Hispanic White US adults are shown in eTable 3 in Supplement 1. Achieving equity in SBP between non-Hispanic Black and White adults was projected to reduce the number of CVD events during 10 years by 50 434 (95% CI, 33 985-71 137) among non-Hispanic Black US adults not taking antihypertensive medication and 122 881 (95% CI, 83 220-176 826) among non-Hispanic Black adults taking antihypertensive medication (Table 4). Achieving equity in SBP between non-Hispanic Black and White adults was projected to reduce the number of CVD deaths during 10 years by 21 703 (95% CI, 7313-40 278) among non-Hispanic Black US adults not taking antihypertensive medication and 55 055 (95% CI, 19 823-99 693) among non-Hispanic Black adults taking antihypertensive medication.
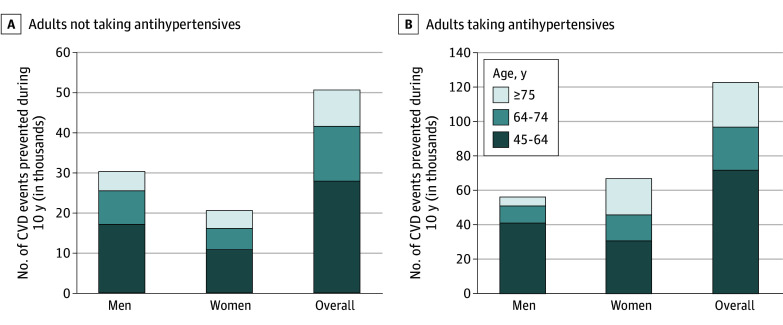
The largest proportion of CVD events among non-Hispanic Black adults not taking and taking antihypertensive medications were prevented among those aged 45 to 64 years (55% and 58%, respectively) (Figure). An estimated 37% and 51% of CVD deaths prevented would occur among non-Hispanic Black adults aged 45 to 64 years not taking and taking antihypertensive medication, respectively (eFigure 3 in Supplement 1).
Preventable Cardiovascular Disease (CVD) Events Among Non-Hispanic Black Adults by Achieving Systolic Blood Pressure Equity With White Adults Data are stratified between those not taking (A) and taking (B) antihypertensive medication by sex and age.
The estimated number of CVD events among non-Hispanic Black adults prevented by achieving SBP equity between non-Hispanic Black and White adults for CHD, stroke, and heart failure are shown in eTables 4 to 6 in Supplement 1. Smaller and larger effectiveness of the intervention in the US population compared with the BPLTTC are shown in eTables 7 to 16 in Supplement 1.
Discussion
In this nationally representative modeling study, mean SBP was higher among non-Hispanic Black compared with White US adults not taking and taking antihypertensive medication. Our findings suggest that if SBP among non-Hispanic Black adults was the same as among non-Hispanic White adults, more than 170 000 CVD events and 75 000 CVD deaths among non-Hispanic Black adults could be prevented. More than half of the CVD events could be prevented among Black adults 45 to 64 years of age.
The risk for CVD increases with higher SBP, even within the range considered normal by current guidelines.^5^ Consistent with prior studies, SBP was higher among non-Hispanic Black US adults compared with non-Hispanic White US adults not taking antihypertensive medication.^7^ The substantial number of CVD events and deaths that could be prevented among non-Hispanic Black adults not taking antihypertensive medication if equity in SBP was achieved emphasizes the value of the prevention of hypertension. Randomized clinical trials have demonstrated that physical activity, adherence to the Dietary Approaches to Stop Hypertension diet, weight loss, reduction in dietary sodium levels, and increased dietary potassium levels lower BP among adults with and without hypertension.^4,5,18^ Few studies have translated results from these trials into implementable community-based hypertension prevention programs or tailored interventions for Black communities.^19,20^ Current initiatives, including the American Heart Association RESTORE (Addressing Social Determinants to Prevent Hypertension) network,^21^ are testing approaches to increase equity in hypertension prevention in Black communities by addressing social determinants of health and meeting individuals where they work, pray, and live.
Analyses of NHANES data have shown that BP control among US adults with hypertension has declined during the past decade, with a consistently lower percentage of non-Hispanic Black adults achieving controlled BP compared with non-Hispanic White adults.^22,23^ In the present study, achieving the same BP level for non-Hispanic Black and non-Hispanic White adults would result in the mean SBP being close to the 2025 American College of Cardiology–American Heart Association BP guideline goal among those taking antihypertensive medication, thus improving control rates. The large number of incident CVD events and deaths that could be prevented by achieving SBP equity and controlling SBP identified in the present study highlights a substantial opportunity for BP control initiatives to increase equity in health. Health systems have implemented quality improvement programs using the Kaiser Permanente Northern California model.^24^ These interventions centered around team-based care led by community health workers have achieved high levels of BP control for both Black and White patients and could be more widely implemented to increase equity in BP.^25^
Previous studies have shown that 45% to 60% of health disparities are attributable to socioeconomic, behavioral, and environmental determinants.^26,27^ Interventions and policies that address social and structural root causes of disparities in BP have a substantial opportunity to create BP equity. Developing interventions with the goal of reducing the impact of structural racism and social determinants of health on BP control and connecting patients with community programs and resources that address social determinants of health could aid in increasing equity in BP. Furthermore, changing policies and laws that perpetuate poverty and limit economic opportunity in Black communities may have a large impact on achieving equity by targeting upstream root causes rather than focusing on individual- or even community-level interventions.
Our findings suggest that approximately half the estimated incident CVD events and deaths that could be prevented by achieving equity in SBP would occur among non-Hispanic Black adults aged 45 to 64 years. These results suggest that public health interventions and policies to improve disparities in adverse BP outcomes may benefit from focusing on healthy aging across the life course. Hypertension develops at younger ages among non-Hispanic Black compared with non-Hispanic White populations and disparities in BP emerge during adolescence.^28,29^ Prior studies suggest that engaging in guideline-recommended physical activity and adhering to the Dietary Approaches to Stop Hypertension diet lowers BP across all age groups.^30,31^ Extending lifestyle education on health behaviors traditionally provided by primary care clinicians and dieticians to other advocates such as community health workers could increase reach and awareness of recommended lifestyle behavior change to younger populations.^32^
Strengths and Limitations
Strengths of this study include the use of nationally representative data from NHANES, which provides estimates of mean SBP, assessed following a rigorous protocol. Additionally, the large sample of Black adults from across the US in the REGARDS study provided reliable estimates of CVD incidence and mortality rates following a rigorous adjudication process.
Our findings should be considered in the context of several limitations. Each participant’s BP was measured at a single study visit, and guidelines recommend obtaining a mean using multiple BP measurements obtained during 2 or more visits.^5^ Although inequities in BP between non-Hispanic Black and non-Hispanic White populations arise at early ages, the present study was restricted to those 45 years or older due to the REGARDS study not including children or young adults. However, CVD incidence and mortality rates are very low among those younger than 45 years.^33^ This analysis assumed that RR estimates from the BPLTTC are applicable to the general US population represented in NHANES and to the REGARDS study cohort. Differences in demographic, socioeconomic, and clinical characteristics across these data sources could influence the magnitude of observed associations and may limit the transportability of trial-based estimates. However, the RR in the BPLLTC has been shown to be remarkably consistent across levels of predicted risk, for women and men and for age groups.^34,35,36^ In addition, the BPLTTC includes 51 trials, many conducted in the US, ensuring a high degree of generalizability. While the present study quantifies the benefits of achieving equity in SBP on incident CVD events and deaths, the advantages would likely extend to increasing equity in life expectancy, health care costs, and morbidity in the US.^37^
Conclusions
In this modeling study, achieving SBP equity between non-Hispanic Black and non-Hispanic White US adults was estimated to prevent more than 170 000 incident CVD events and 75 000 CVD deaths during the next decade among non-Hispanic Black US adults. Our findings suggest that approximately half of these CVD events and deaths could be prevented among non-Hispanic Black adults aged 45 to 64 years. The large number of incident CVD events and deaths that could be prevented among middle-aged Black adults suggests that initiatives to maintain normal BP among those without hypertension and achieve BP control for those with hypertension could have a substantial impact on health equity in the US.
The reference list from the paper itself. Each links out to its DOI / PubMed record.
- 1Franklin SS, Wong ND. Hypertension and cardiovascular disease: contributions of the Framingham Heart Study. Glob Heart. 2013;8(1):49-57. doi:10.1016/j.gheart.2012.12.004 25690263 · doi ↗ · pubmed ↗
- 2Danaei G, Ding EL, Mozaffarian D, . The preventable causes of death in the United States: comparative risk assessment of dietary, lifestyle, and metabolic risk factors. P Lo S Med. 2009;6(4):e 1000058. doi:10.1371/journal.pmed.1000058 19399161 PMC 2667673 · doi ↗ · pubmed ↗
- 3Murray CJ, Atkinson C, Bhalla K, ; US Burden of Disease Collaborators. The state of US health, 1990-2010: burden of diseases, injuries, and risk factors. JAMA. 2013;310(6):591-608. doi:10.1001/jama.2013.13805 23842577 PMC 5436627 · doi ↗ · pubmed ↗
- 4Mc Guire HL, Svetkey LP, Harsha DW, Elmer PJ, Appel LJ, Ard JD. Comprehensive lifestyle modification and blood pressure control: a review of the PREMIER trial. J Clin Hypertens (Greenwich). 2004;6(7):383-390. doi:10.1111/j.1524-6175.2004.03147.x 15249794 PMC 8109651 · doi ↗ · pubmed ↗
- 5Jones DW, Ferdinand KC, Taler SJ, . 2025 AHA/ACC/AANP/AAPA/ABC/ACCP/ACPM/AGS/AMA/ASPC/NMA/PCNA/SGIM Guideline for the Prevention, Detection, Evaluation and Management of High Blood Pressure in Adults: a report of the American College of Cardiology/American Heart Association Joint Committee on Clinical Practice Guidelines. Circulation. 2025;152(11):e 114-e 218. 40811497 10.1161/CIR.0000000000001356 · doi ↗ · pubmed ↗
- 6Fiscella K, Holt K. Racial disparity in hypertension control: tallying the death toll. Ann Fam Med. 2008;6(6):497-502. doi:10.1370/afm.873 19001301 PMC 2582461 · doi ↗ · pubmed ↗
- 7Hardy ST, Chen L, Cherrington AL, . Racial and ethnic differences in blood pressure among US adults, 1999-2018. Hypertension. 2021;78(6):1730-1741. doi:10.1161/HYPERTENSIONAHA.121.18086 34719937 PMC 8851685 · doi ↗ · pubmed ↗
- 8Tajeu GS, Safford MM, Howard G, . Black-White differences in cardiovascular disease mortality: a prospective US study, 2003-2017. Am J Public Health. 2020;110(5):696-703. doi:10.2105/AJPH.2019.305543 32191519 PMC 7144446 · doi ↗ · pubmed ↗