Systems biology-driven identification of biomarkers and significant pathways in radiation-induced hormone-sensitive cancers
Suvitha Anbarasu, Sathyanarayan Balaji, Sudha Ramaiah, Anand Anbarasu

TL;DR
This study identifies biomarkers and pathways linked to hormone-sensitive cancers caused by radiation exposure.
Contribution
The study proposes novel radiation-sensitive biomarkers specific to hormone-sensitive cancers using systems biology approaches.
Findings
Hub genes like TNF, STAT3, and CTNNB1 were identified as hypoxic signatures in hormone-sensitive cancers.
MYC and STAT3 in breast cancer, CTNNB1 in prostate cancer, and BRCA1 in ovarian cancer showed significant dysregulation.
Mutational profiling validated MYC with 18% and STAT3 with 2.6% mutation frequencies.
Abstract
Radiation-induced damage to nucleic acid and other important cellular constituents could likely cause cancer. The present study has analyzed mutated genes with dysregulated expression signatures due to radiation. We have predicted biomarkers specific to hormone-sensitive cancers (HSCs) namely breast cancer (BC), prostate cancer (PC), ovarian cancer (OC), and endometrial cancer (EC). The study has also attempted to prospect the pathways associated with HSCs and radiation exposure through network analysis and functional enrichment analysis. An overlap of important cell cycle pathways, DNA binding, and transcription activity pathways were found in comparison with HSCs and the radiation hallmark pathways. Hub genes TNF, STAT3, CTNNB1, and MYC in BC; IL1B, CTNNB1, ESR1, and SRC in PC; CTNNB1, BRCA1, JUN, and KRAS in OC; PIK3CA, PTEN, and ESR1 in EC were found as hypoxic signatures due to…
Genes, proteins, chemicals, diseases, species, mutations and cell lines named across the full text — each resolved to its canonical identifier and authoritative record.
Click any figure to enlarge with its caption.
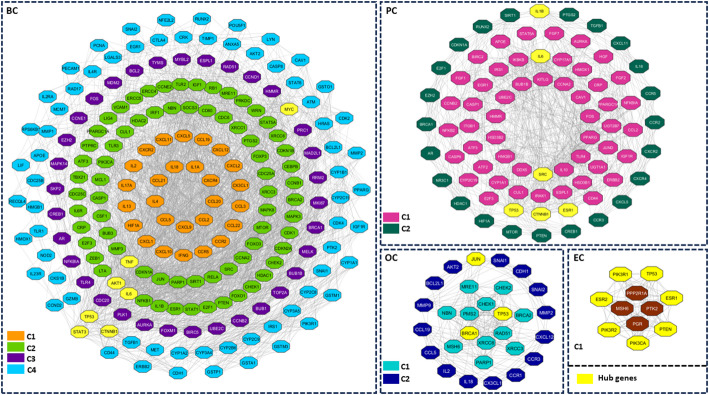 Figure 1
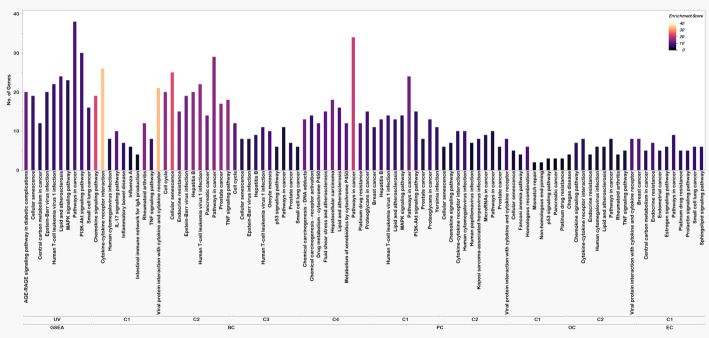 Figure 2
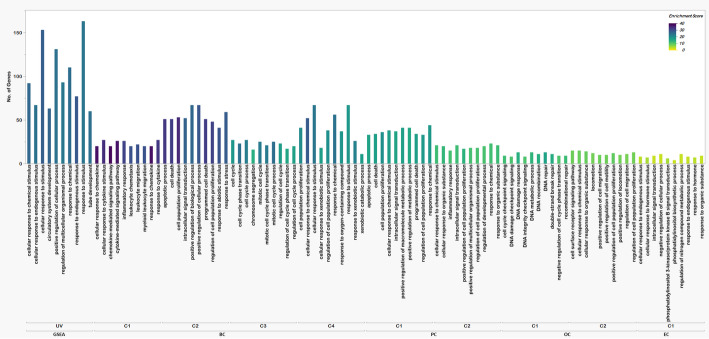 Figure 3
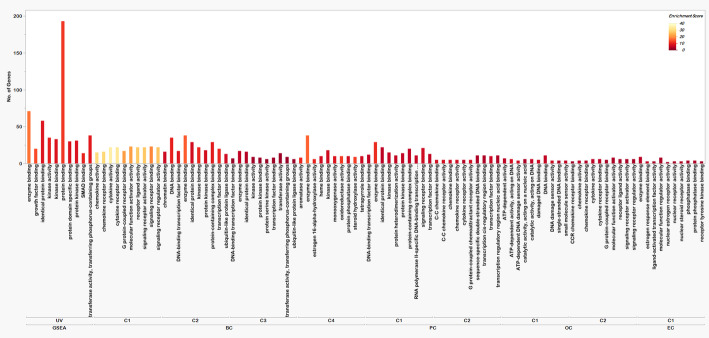 Figure 4
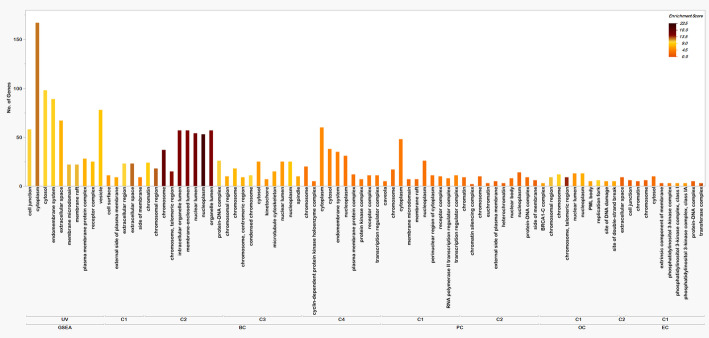 Figure 5
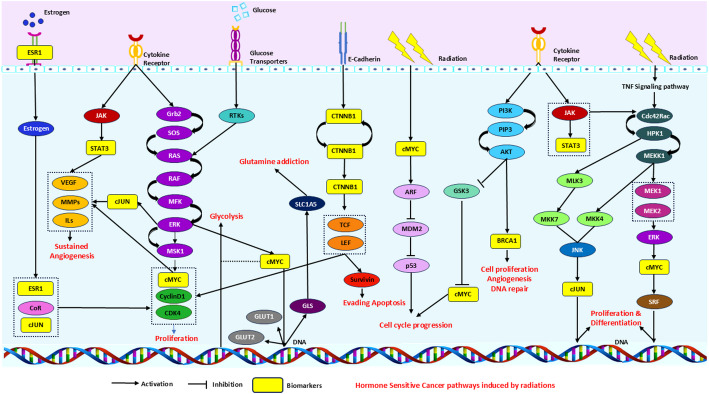 Figure 6
- —Vellore Institute of Technology, Vellore
Peer Reviews
No public reviews on file for this paper yet. If you reviewed it on a platform where reviews are public (OpenReview, ICLR, NeurIPS, ICML), you can paste yours below so the community can read it here.
Videos
No videos yet. Explain this paper in a talk, walkthrough, or lecture? Add one.
Taxonomy
TopicsEffects of Radiation Exposure · Cytokine Signaling Pathways and Interactions · Breast Cancer Treatment Studies
Introduction
The health effects of ionizing radiation have been known for years since the discovery of X-rays. The exposure has led to epilation, skin burns, and tissue damage. Carcinogenesis due to radiation majorly depends on the dosage of the radiation. Although high doses are proven to have cancer risk, low doses are not understood clearly yet they are responsible for causing carcinogenic effects [1]. The response to these radiations can be categorized into three aspects namely, radio-sensitivity (noncancerous effects after high doses), radio-susceptibility (cancerous even at low doses), and radio-degeneration (noncancerous, but attributed to other health hazards) [2]. Radiation exposure could occur either in the workplace or the environment or through diagnostic medicines. Uncovering a universal model on how these radiations are affecting human life at different scales from the molecular level to the organism level is quite complicated. Yet radiobiological data available on the biological responses to radiation give us better insights into understanding the impacts of this radiation on the human body. In general, these radiations are mutagenic and harmful. Fundamentally these radiations damage the DNA resulting in mutations and chromosomal aberrations further resulting in several diseased conditions including cancer. A scientific assumption that prolonged exposure to these radiations with a linear increase in dosages can result in cancer has been defined. Interestingly later the nonlinear responses were also found to be known as non-targeted effects which might be due to epigenetic changes, leading to dysregulation of genes and their expression resulting in cancerous conditions [3].
The current research focuses on studying the major genes affected by the radiation. The pathways associated with these genes were also investigated, thereby understanding the mechanisms through which radiation-induced mutated genes could cause cancer and how they contribute to further consequences of cancer. Among different cancers, we focused only on hormone-sensitive cancers (HSCs) namely, breast cancer (BC), prostate cancer (PC), ovarian cancer (OC), and endometrial cancer (EC). All these cancers are common and frequent and the incidence and death rates keep increasing every year [4]. Ionizing radiation exposure had an increased risk of acquiring breast cancer, especially among females who had a family history of cancer and might already have the pre-deposited mutations even smaller doses of radiation can contribute to acquiring breast cancer.
Factors including hormones, lifestyles, environmental factors, and genetic factors can cause breast cancer [5]. The association between occupational exposure to radiation and breast cancer was found to increase the risk of breast cancer among healthcare workers. Additionally, long-duration exposure to non-ionizing radiations can slowly lead to cancer in the future [6].
Similar to breast cancer, ionizing radiation plays a major role in ovarian cancer also. BRCA1 and BRCA2 are well-established significant mutations in ovarian cancer. These genes are found to be mutated upon DNA damage by ionizing radiations and are involved in disrupting major cellular functions and pathways [7]. The ovary normally has a high probability of acquiring radiation-induced damage as it has female germline cells. The radiation-induced genetic mutations can be carried over to the next generations making the offspring more susceptible to cancer and vulnerable to radiation-based diagnosis [8]. Radiation exposure can cause oncologic conditions with cervical and endometrial cancers with improved survival potency in these cancers [9]. Radiation therapy for cervical cancer was found attributing to endometrial polyps which can later become endometrial cancers [10]. Prostate cells normally have pro-oncogenic factors which makes them more susceptible to acquiring cancer [11]. Additionally, diagnostic procedures involving radiation have also shown an increased risk of prostate cancer [12].
The cancer cells can alter various signaling pathways to stress response and can easily adapt to the tumor microenvironments (TME). One of the TME conditions is deprived oxygen levels in the cell known as hypoxia which can further help in the angiogenesis process for cancer cells. The condition also contributes to major cancer pathways including the mTOR pathway, PI3K pathway, and AMP pathways. Hypoxia also helps in the regulation of autophagy to resist interferon-gamma and tumor necrosis factor-induced cytotoxicity [13]. Hypoxia and Oxic cells are both important signature conditions associated with radiation exposure. Further, the need to identify a biomarker for cancers induced by radiation is important to decide whether to proceed with radiation therapy as a treatment option. The following study employs a systems biology approach to discover the major pathways associated with the mutated genes as well as to elucidate the key biomarkers in HSCs that can act as a diagnostic marker and in the selection of treatment strategies to treat the associated HSCs.
Materials and methods
Data retrieval
The Comparative Toxicogenomics Database (CTD), 2023 (https://ctdbase.org/) is a platform that provides insights into the effect of environmental exposure on the health of human. It is a manually curated database that interrelates data on chemicals, genes, phenotypes, diseases, and exposure content derived from published studies [14]. The genes associated with neoplasm induced by radiation were retrieved by searching the keywords “neoplasm”, “radiation” and “cancer” through the accession ID D009381 available in the disease tab followed by the genes tab on the CTD home page. The Cancer Genetics Web database, 2020 provides comprehensive information about genes and their genetic mutation associated with cancer (http://www.cancerindex.org/geneweb/) [15]. The mutated genes in each of the cancers BC, PC, EC, and OC were manually retrieved by searching concerned cancer under each chromosome available at the chromosome icon on the homepage. The redundant genes from CTD were excluded and the genes which are uniquely present in the mutation gene dataset were selected for further studies. The gene signatures that are altered due to radiation exposure under oxic and hypoxic conditions were retrieved from RadiationGeneSigDB at (https://github.com/vmsatya/RadiationGeneSigDB) [16]. The hallmark genes up-regulated and down-regulated in response to ultraviolet (UV) radiation were obtained from the Gene Set Enrichment Analysis (GSEA) database (https://www.gsea-msigdb.org/gsea/index.jsp) [17]. The radiation datasets acquired from Radiation Gene Sig DB and GSEA databases were used for comparative validations of the mutated gene dataset.
Hub gene identification
The gene set filtered out from the mutation dataset for all four cancers was submitted to STRING v 12.0, 2023 (Search Tool for the Retrieval of Interacting Genes) with a confidence score of 0.7 and based on evidence of the nodes, gene interaction networks (GIN) were constructed. The STRING database serves as a repository of computationally predicted, knowledge transfers across different organisms and interaction information from primary databases [18]. For EC, there were less significant genes in STRING, thus two-fold options were used to obtain more genes associated with the input genes. The gene dataset from the GSEA database was also subjected to GIN construction. Cytoscape a software platform for analyzing the GIN was used For the identification of hub genes [19]. The GIN from STRING was visualized and analyzed for hub genes using the cytoHubba plugin in Cytoscape which helps in the exploration of fragile and important nodes in a network [20]. The hub genes were identified using topology and centrality algorithms such as degree, Edge Percolated Component (EPC), closeness, and betweenness, from the GIN of BC, PC, EC, OC, and GSEA gene sets respectively.
Network clustering
The network clustering for the GIN of the cancers and GSEA gene dataset was performed in Cytoscape using the MCODE (Molecular Complex Detection) cluster algorithm that detects densely connected regions in large GIN that may represent molecular complexes [21]. The optimum clusters were obtained with k-means value >3, clustering score ≥ 5.0, and number of nodes >10 parameters in MCODE.
Functional enrichment analysis
The functional enrichment for all the clusters obtained from MCODE was profiled for Gene Ontology (GO) and pathway enrichment using g: Profiler, 2023 webserver (https://biit.cs.ut.ee/gprofiler/gost). It is a high-throughput web server designed for the characterization of manipulating genes, including their ontology, pathway, and transcription factor binding site enrichment [22]. For the current study, the KEGG pathway enrichment analysis was performed, where the overlapping of pathways associated with the genes in the HSCs and the pathways associated with mutated genes driven by radiation demonstrates that the genes may follow similar mechanisms to induce cancer. The GO enrichment of the clusters involves the annotation of biological process (BP), molecular function (MF), and cellular component (CC). Similarly, the overlapping gene ontologies were observed confirming the mechanisms through which the genes contribute to the HSCs. Furthermore, the pathway enrichment was performed with Kyoto Encyclopedia of Genes and Genomes (KEGG) database sources in the web server [23]. The analysis results from this server were validated using the hypergeometric P-values to identify the significant terms corresponding to the cluster genes [24].
Comparative analysis
The oxic and hypoxic gene signatures in the radiation gene dataset obtained from the RadiationGeneSigDB were used to compare and see if the cluster genes of different cancers are oxic/hypoxic gene signatures. This was performed by constructing a Venn diagram for oxic genes, and hypoxic genes in correlation to the cluster genes using Bioinformatics and evolutionary genomics webserver (BEG), (https://bioinformatics.psb.ugent.be/webtools/Venn/) [25]. Further, the presence of hub genes was also validated for the radiation gene set to find the oxic and hypoxic gene signatures.
Gene expression analysis
The expression level of hub genes across different tumor tissues taken in this study were analyzed using the TNM plot webserver, 2021 (https://tnmplot.com/analysis/) to assess their regulatory pattern. This is an integrated database built using transcriptome-level datasets to compare gene expression across normal, tumor, and metastatic tissues [26]. This analysis included examining of differential expression of the hub genes obtained for the four cancer types in normal and tumor tissues based on the median expression value of the genes in tumor and normal tissue, median fold change value obtained for each gene in their respective tumor tissue [27].
Survival prognosis
Survival analysis is a crucial study in medical research, focusing on data derived from clinical outcomes and treatment efficacy. A web portal, cBio Cancer Genomics portal (http://cbioportal.org/), v6.3.5 is an interactive resource to explore the multidimensional cancer genomic data sets used to construct the Kaplan-Meier survival (KM-plot) plot for all the hub genes across the four cancers studied [28]. Due to data insufficiency for EC and OC for survival analysis, the uterus and ovarian cancer dataset studies were combined for the survival curve construction for the hub genes of these corresponding cancers. The KM-plot generates survival curves using Cox proportional hazards analysis to predict survival outcomes [29]. The hub genes were screened based on their default hazard ratio (HR >1.0) and median survival months (MSM) when compared to unaltered gene survival months.
Validation
The validation for the genes that were screened from the survival analysis was performed by analyzing their mutation profile for each of the genes in their appropriate cancer dataset in the cBioPortal [28]. This analysis was performed to validate the established gene mutations present in the hub genes correlated to radiation exposure according to this study. The OncoPrint feature in the portal displayed the types and extent of genetic alteration in those genes corresponding to their cancer type. The KEGG pathway enrichment analysis was performed for each identified biomarker, allowing for comparative analysis to identify significant pathways related to cancer pathways in the respective HSCs.
Results
Retrieved data
The CTD database had 6965 genes under the neoplasms induced by radiation. From the cancer genetics web, 1232 mutated genes were obtained for BC, 622 for PC, 343 for OC, and 41 for EC. The common genes in both databases were taken for network construction which had 700 genes in BC, 343 for PC, 177 for OC, and 24 genes in EC. The GSEA database which had two hallmark gene-sets for upregulated and downregulated genes under UV radiation was also retrieved with 302 genes. The hypoxic and Oxic gene signatures due to radiation contained 3779 and 1144 genes respectively, were retrieved from the RadiationGeneSigDB which were all used for comparative analysis.
Hub gene identification
The filtered genes were subjected to network construction of high confidence score (0.7) and found a BC network with 658 nodes and 13,886 edges, a PC network with 307 nodes and 3388 edges, an OC network with 142 nodes and 914 edges, and an EC network with 31 nodes and 248 edges (after a two-fold increase in the network). The GSEA UV gene-set network had 204 nodes and 950 edges at the same confidence. The networks were exported to Cytoscape and cytoHubba found the hub genes with four parameters namely degree, closeness, betweenness, and EPC. The Hub gene rank and score with each parameter are documented in Table 1.
Table 1. Identified hub gene parameters and scores for four cancers and UV GSEA gene datasetData typeHub genesFunctionTopology scoresCentrality scoresDegreeEPCBetweennessClosenessBC TP53 Multifunctional transcription factor (TF)414.00188.2866052.91419.25 AKT1 AKT – kinase – Cellular regulation304.00186.2126504.35391.92 IL6 IL6 signalling pathway – Cytokine regulation286.00183.8715282.55379.08 TNF Tumor cell growth regulation274.00182.4116568.99375.25 STAT3 Signal transducer and acivation274.00184.0416178.53381.00 CTNNB1 Wnt signalling pathway – downstream regulator270.00182.5735273.93381.33 MYC Non- specific DNA binding TF256.00182.7017974.41376.25PC TP53 Multifunctional transcription factor (TF)194.0045.4020937.13191.92 IL6 IL6 signalling pathway – Cytokine regulation154.0044.388338.02179.83 IL1B Pro -inflammatory cytokine regulation124.0041.746492.41170.83 CTNNB1 Wnt signalling pathway – downstream regulator118.0039.989869.27171.75 ESR1 Multifunctional nuclear hormone receptor98.0039.276872.02166.42 SRC Non-protein receptor tyrosine kinase regulation98.0038.975363.68164.67OC TP53 Multifunctional transcription factor (TF)100.0031.265890.7088.20 CTNNB1 Wnt signalling pathway – downstream regulator60.0027.593299.9977.03 BRCA1 Ubiquitin-protein ligase – DNA damage responses60.0028.611541.7775.20 JUN Multifunctional TF – binding to DNA52.0027.351864.4374.95 HSP90AA1 Multifunctional molecular chaperone44.0024.281625.3470.82 KRAS Ras protein driven oncogenic event regulation44.0025.091634.3272.20 ERBB2 Protein tyrosine kinase – transcriptional regulation42.0026.051592.4372.70EC PIK3CA Phosphoinositide-3-kinase (PI3K) phosphorylates phosphatidylinositol (PI)38.0082.9482.9424.33 PTEN Dual-specificity protein phosphatase38.0093.2993.2924.33 PIK3R1 Phosphoinositide-3-Kinase Regulatory Subunit 138.00123.54123.5424.33 ESR1 Multifunctional nuclear hormone receptor36.00128.90128.9024.00 TP53 Multifunctional transcription factor (TF)34.00103.11103.1123.50 PIK3R2 Phosphoinositide-3-Kinase Regulatory Subunit 230.0046.8546.8522.17 ESR2 Multifunctional nuclear hormone receptor28.0066.7166.7121.83 ARID1A Involved in transcriptional activation and repression20.0043.0243.0219.67UV GSEA PTEN Dual-specificity protein phosphatase54.0026.543752.3482.92 IL6 IL6 signalling pathway – Cytokine regulation50.0026.242371.2080.92 FOS Nuclear phosphoprotein – regulating cell signalling44.0025.312753.0980.73 CASP3 Thiol protease - major effector caspase in apoptosis42.0025.143036.1478.22 CAV1 Scaffolding protein within caveolar membranes42.0023.613490.2178.58 NFKB1 NF-kappa-B, multifunctional TF – cell regulation32.0023.541878.5777.10 MYC Non- specific DNA binding TF42.0024.66-77.73 ERBB2 Protein tyrosine kinase – transcriptional regulation42.0025.82-77.82
Clustered subnetworks
The BC network found four clusters, cluster 1 (C1) with 27 nodes and 542 edges and a clustering score of 20.846, cluster 2 (C2) with 72 nodes and 1128 edges and a score of 15.887, cluster 3 (C3) with 34 genes and 478 edges and a score of 14.485, and cluster 4 (C4) with 69 nodes and 622 edges and a score of 9.147. The PC network found two clusters, C1 with 55 nodes and 498 edges and a score of 9.222, and cluster C2 with 24 nodes and 184 edges and a score of 8.0. The OC network found two clusters, C1 with 13 nodes, and 142 edges and a score of 11.833, and C2 with 16 nodes and 184 edges and a score of 8.0. The EC network found one cluster with 11 nodes and 86 edges and a score of 8.6. All the subnetworks are represented in Fig. 1.
Fig. 1. Clusters in HSC. BC - Breast Cancer; PC - Prostate Cancer; OC - Ovarian Cancer; EC - Endometrial Cancer; Hub genes are represented in yellow color
Functional enrichment
The functionally enriched pathways of the four cancers were compared to the functionally enriched pathways of the GSEA gene set and found certain similar pathways. As well as the gene ontologies (GO) were also compared and most of the pathways were related to DNA or protein binding and activity, at most of the membrane regions and in major processes like reaction to stimuli and important regulatory pathways. The BP, MF, CC, and KEGG pathways with the number of genes and the enrichment score (negative logarithm of adjusted P value) are represented in Figs. 2, 3 and 4, and 5 respectively.
Fig. 2KEGG pathway analysis for HSCs. The X-axis shows the enriched pathways in different clusters of all four cancers and for UV radiation-based pathways, the Y-axis shows the number of genes involved in each of the pathways and the color range from dark purple to red to peach represents the enrichment score of each pathway (Low to high)
Fig. 3. Bioprocess in HSC clusters and UV hallmark genes. The X-axis shows the enriched bioprocesses in different clusters of all four cancers and for UV radiation-based bioprocesses, the Y-axis shows the number of genes involved in each of the bioprocesses and the color range from Yellow to teal green to dark violet represents the enrichment score of each pathway (Low to high)
Fig. 4. Molecular functions in HSC clusters and UV hallmark genes. The X-axis shows the enriched molecular functions in different clusters of all four cancers and for UV radiation-based molecular functions, the Y-axis shows the number of genes involved in each of the molecular functions, and the color range from maroon to faded yellow represents the enrichment score of each function (Low to high)
Fig. 5. Cellular Components in HSC clusters and UV hallmark genes. The X-axis shows the enriched cellular components in different clusters of all four cancers and for UV radiation-based cellular components, the Y-axis shows the number of genes involved in each of the cellular components and the color range from Orange to yellow to brown represents the enrichment score of each cellular component (Low to high)
Comparative analysis
The comparison of the presence of the oxic and hypoxic genes in each of the clusters was plotted as a Venn diagram (Figure S1). Based on the comparison between the hub genes, hypoxic and oxic signatures, TNF,* STAT3*,* CTNNB1*, and MYC were screened for BC, IL1B,* CTNNB1*,* ESR1*, and SRC were screened for PC, CTNNB1,* BRCA1*,* JUN*, and KRAS was screened for OC and PIK3CA,* PTEN*, and ESR1 was screened for EC for further expression and survival analysis.
Gene expression analysis
The hub gene expression analysis of the respective cancers was performed with a TNM plot webserver. This analysis compared the gene expression levels between normal and tumor tissues using the median expression and median fold change values (Table 2). Genes with a median expression level higher than that of normal tissue, combined with a median fold change greater than 1.0, are considered upregulated in the respective tissue. All the hub genes showed different expression profiles across all tumor tissues. In BC, the genes STAT3,* CTNNB1*, and MYC were upregulated, while TNF was downregulated in tumor tissues. In PC, the genes ESR1 and SRC exhibited overexpression in tumor tissues, whereas IL1B and CTNNB1 showed reduced expression. In EC, ESR1 was the only hub gene upregulated in uterine tissues, with PIK3CA and PTEN being downregulated. In OC, KRAS was downregulated, whereas the other hub genes CTNNB1,* BRCA1*, and JUN were upregulated in ovarian tumor tissues.
Table 2. Gene expression profile of the hub genes in four cancer typesCancer typeGene nameP valueMedianFold changeDifferential expressionNormalTumorBC TNF 5.31E-01110960.87Downregulated STAT3 3.01E-12302637281.23Upregulated CTNNB1 9.52E-151878.527221.45Upregulated MYC 9.23E-01124113641.1UpregulatedPC IL1B 9.23E-03283.52270.8Downregulated CTNNB1 1.93E-03291123750.82Downregulated ESR1 1.28E-014655751.24Upregulated SRC 6.08E-01303.53301.09UpregulatedOC CTNNB1 3.65E-091548.532822.12Upregulated BRCA1 1.38E-07109203.51.87Upregulated JUN 6.50E-01308226671.07Upregulated KRAS 7.12E-0187860.99DownregulatedEC PIK3CA 6.76E-04477300.50.63Downregulated PTEN 4.64E-033282680.82Downregulated ESR1 2.52E-01921710777.51.17Upregulated
Survival prognosis
The survival analysis of each hub gene across all four cancer tissues was performed by constructing a KM-plot, which provides hazard ratios, and the median survival means (MSM) associated with each gene. The genes whose hazard ratio (HR) > 1.0 and MSM were shorter than that of the unaltered group were considered crucial for survival in each of the cancers. Based on the above analogy, the genes TNF,* STAT3*, and MYC were observed to be critical for survival with unaltered group MSM of 169.6 and CTNNB1 came out to be insignificant in terms of BC. In PC, the genes IL1B,* SRC*, and ESR1 were insignificant but CTNNB1 was observed to be pivotal for survival MSM of the altered group (56.09) was less than that of unaltered MSM (107.2). Notably, CTNNB1 was significant with 1.59 h in PC despite being downregulated based on expression analysis. In EC, ESR1 was the only gene identified as important for survival with an HR of 1.11 and an MSM of 47.67 whereas unaltered MSM was 55.39 in both OC and EC. In OC, CTNNB1 and KRAS were not significant as they lacked notable HR and MSM values. However, the genes JUN and BRCA1 were found to be pivotal for survival. The descriptive details obtained from survival analysis including the number of samples, HR, and MSM of altered and unaltered groups are presented in Table 3. The detailed survival plot based on the probability of survival and survival months of the hub genes in the cancer tissues is illustrated in Figure S2. From this analysis, the genes STAT3,* MYC*,* CTNNB1*,* ESR1*,* JUN*, and BRCA1 were identified for further validation as potential biomarkers.
Table 3. Survival analysis of the hub genesCancerGeneNumber at riskNo of unaltered groupMedian CI (95%)HRP-valueAltered groupsUnaltered groupsBC TNF 123778125.9169.61.6333.08E-05 STAT3 42100.871.34 CTNNB1 16NA0.507 MYC 801135.31.322PC IL1B 82190NA107.21.6982.37E-02 CTNNB1 8456.091.589 ESR1 151581.009 SRC 12NANAEC PIK3CA 14068367.255.390.7891.53E-05 PTEN 72125.460.481 ESR1 2147.671.111OC CTNNB1 1758.110.684 BRCA1 2140.971.517 JUN 832.851.74 KRAS 5436.33NA
Validation
The validation for the predicted biomarkers for different cancers with radiation exposure was performed, and genetic alterations of the identified critical survival genes were profiled. The observed genetic alterations were as follows: STAT3-2.6%, MYC-18%, CTNNB1-4%, ESR1-4%, JUN-4%, and BRCA1-4% (Figure S3). Most of these genetic alterations involved gene amplification and fewer deep deletions. The KEGG pathway comparative analysis identified several critical pathways for each cancer type, from which the top 10 pathways, specifically involving the biomarkers, were selected based on enrichment scores. The analysis revealed that STAT3, MYC, CTNNB1, BRCA1, JUN, and ESR1 are involved in key pathways of significance relevant to HSCs (Table 4).
Table 4KEGG pathway enrichment analysis data of biomarkersKEGG pathway enrichmentClusterEnrich-ment scorePathwaysGenesBC C311.11Cell cycleESPL1, BUB1B, MDM2, CDC20, CCNB2, PLK1, BUB1, MYC, MAD2L1, SKP2, CCND1, CCNE15.39Cellular senescenceFOXM1, MDM2, MAPK14, CCNB2, MYBL2, MYC, CCND1, CCNE14.04Pathways in cancerFOS,* MDM2*, BCL2, RAD51, BIRC5, NFKBIA,* AR*, MYC, SKP2, CCND1, CCNE13.23Chemical carcinogenesis - receptor activationFOS,* BCL2*, BIRC5, AR, MYC, CREB1, CCND12.67PI3K-Akt signaling pathwayMDM2, BCL2, TLR4, MYC, CREB1, CCND1, CCNE1, BRCA12.15MicroRNAs in cancerMDM2, BCL2, MYC, EZH2, CCND1, CCNE1, BRCA1 C421.80Pathways in cancerCDK2, RPS6KB1, PPARG,* IL23R*,* IL2RA*, STAT3, NFE2L2, GSTP1, MMP2, GSTO1, CCND2, IGF1R,* ERBB2*, HMOX1, GSTM3, GSTA1, GSTM1, PIK3R1, CDH1, CDK4, AKT2, MET,* CASP8*, MMP1, CRK,* HRAS*,* STAT6*, IL4R,* BCL2L1*, CKS1B,* CTNNB1*, PTK2, TP53, TGFB17.42Chemical carcinogenesis - receptor activationRPS6KB1, STAT3, GSTO1, GSTM3, GSTA1, GSTM1, PIK3R1, CYP1A1, CYP1A2, AKT2, HRAS,* CYP3A4*, CYP2B6, CYP1B15.57JAK-STAT signaling pathwayLIF,* IL23R*,* IL2RA*, STAT3, CCND2, PIK3R1, AKT2, HRAS,* STAT6*, IL4R,* BCL2L15.27MicroRNAs in cancerSTAT3*, CD44, CCND2, ERBB2, HMOX1, PIK3R1, MET,* CRK*,* HRAS*,* CDC25B*,* IRS1*, ATM,* CYP1B1*, TP53PC C113.10Pathways in cancerKITLG,* CCNA2*, PPARG,* FOS*,* IL6*, HMOX1, ITGB1, IKBKB,* CUL1*, FGF1, E2F3, NFKB2, TP53, CASP9, FGF7, ESR1, NFKBIA,* BIRC2*, FGF2, CTNNB1, ERBB2, STAT5A,* HGF*,* IGF1R7.70Proteoglycans in cancerCAV1*, SRC,* TLR4*, DDX5, ITGB1, TP53, ESR1, CD44, FGF2, CTNNB1, ERBB2, HGF,* IGF1R7.00Breast cancerFOS*,* FGF1*, E2F3, NFKB2, TP53, FGF7, ESR1, FGF2, CTNNB1, ERBB2, IGF1R4.97Prostate cancerIKBKB,* E2F3*, TP53, CASP9, NFKBIA, CTNNB1, ERBB2, IGF1R1.42Endometrial cancerTP53, CASP9, CTNNB1, ERBB2OC C19.10Homologous recombinationBRCA1, RAD51, NBN,* XRCC3*, MRE11, BRCA22.07Platinum drug resistanceBRCA1, TP53, MSH6 C24.03TNF signaling pathwayMMP9, AKT2, CCL5, JUN, CX3CL13.96Pathways in cancerIL2, MMP9, AKT2, MMP2, BCL2L1, CDH1, JUN, CXCL122.82Endocrine resistanceMMP9, AKT2, MMP2, JUN2.30Relaxin signaling pathwayMMP9, AKT2, MMP2, JUN2.21Estrogen signaling pathwayMMP9,AKT2,MMP2, JUNEC C110.21Breast cancerPTEN,* PIK3R2*, ESR1, TP53, ESR2, PIK3R1, PIK3CA,* PGR9.48Endocrine resistancePIK3R2*, ESR1, TP53, ESR2, PIK3R1, PTK2, PIK3CA7.43Pathways in cancerMSH6, PTEN,* PIK3R2*, ESR1, TP53, ESR2, PIK3R1, PTK2, PIK3CA6.41Estrogen signaling pathwayPIK3R2, ESR1, ESR2, PIK3R1, PIK3CA,* PGR6.06Prolactin signaling pathwayPIK3R2*, ESR1, ESR2, PIK3R1, PIK3CA5.34Proteoglycans in cancerPIK3R2, ESR1, TP53, PIK3R1, PTK2, PIK3CA5.27Chemical carcinogenesis - receptor activationPIK3R2, ESR1, ESR2, PIK3R1, PIK3CA,* PGR4.86Thyroid hormone signaling pathwayPIK3R2*, ESR1, TP53, PIK3R1, PIK3CAThe genes represented in bold are the identified hub genes involved in the respective pathways
Discussion
Cancer is a multifactorial disease that can be influenced by ionizing and non-ionizing radiation. The United Nations Scientific Committee on the Effects of Atomic Radiation (UNSCEAR) report suggested that ionizing radiations promote the accelerated growth of pre-cancerous clones, and these changes are usually driven by the oxygen conditions of the cells [30, 31]. Thus, the current study has attempted to understand the functional pathway mechanisms through which these radiations might induce cancer as well as the prediction of a diagnostic biomarker from aspects of oxic and hypoxic conditions of a cell. The biological mechanisms through which these radiations could contribute to cancer are currently under research. Predicting a radiation-induced cancer biomarker in cancer could be of great assistance in understanding the role of radiation in cancer.
The mutated gene list retrieved from the cancer genetics web was encompassed with the radiation-induced neoplasms gene set. The hub genes for each cancer were identified (Table 1) and the functional enrichment analysis found the presence of the hub genes in various important pathways driving cancer progression (Fig. 6).
Fig. 6. The pathways prominent in radiation-induced HSCs specific to the identified biomarkers. The hub genes are represented in yellow color
Studies on neoplasms induced by ionizing radiations found similar pathways namely cell cycle, cell signaling, and DNA repair mechanisms which correlated with our study [32, 33, 35]. Kinases like MAPK, AKT, and PKA phosphorylated CREB upon radiation induced neuroendocrine differentiation in PC [34] which correlated with this study as well. ARID1A, one of the hub genes in EC was studied for its mechanisms in DNA damage leading to EC. The study found that radiation-induced DNA damage is difficult to repair and can significantly contribute to endometrial cancer [36]. From the functional enrichment analysis, it is evident that both photo radiation and ionizing radiation can possibly developing HSCs. Further, the hypoxic and oxic conditions of a cell were considered. Important cellular functions including differentiation, proliferation, and growth are all governed by the hypoxic nature of the cancer cells. Hypoxia is one of the well-known phenomena in radiation-induced damage, thus we correlated the presence of hypoxic gene signatures in our clusters [37]. The hub genes which were hypoxic and oxic were considered for further evaluation.
The expression analysis and survival prognosis of the hub gene in different cancer types were performed to obtain the regulatory signatures of the genes in the specific cancers [38]. It also provides a correlation with the radiation signature of the genes by their expression in each of the cancers. Direct ionization or the formation of reactive oxygen species (ROS) can lead to cancer progression [39–41].
Radiation exposure has effects on gene expression in breast cancer cells [42, 44]. While undergoing radiotherapy hypoxic cells tend to resist radio sensitization due to reduced oxygen supply in the TME resulting in disruption of vasculature in the nearby cells, making them hypoxic and resistant to radiation therapy [43]. The identified genes in PC were found to be aiding in the process of hypoxic cell formation, which in turn could lead to radio sensitization of the tumor cells [45]. In EC, it was found that ionizing radiations activate the pro-oncogenic proteins and signaling pathways, protein kinase B (AKT), and nuclear factor kappa B which aids tumor cell growth [46]. Thus, the identified hub genes might contribute to tumor. Hypoxic genes were also found associated with the cell cycle, and DNA damage response pathways influencing the radio-sensitivity [47]. An OC study found hypoxic genes were involved in vasculo-genesis, cell growth pathways, and cell metabolism [48] correlated with the identified hub genes in OC.
Investigations on expression of certain genes in the concerned cancer patients unveiled that elevated gene expression correlates with diminished survival rates, as evidenced by survival plots and HR exceeding 1 [49, 50]. In BC, STAT3 and MYC had an HR of 1.63 and 1.32 respectively from which STAT3 is comparatively more hazardous than MYC with a median survival of 100.87 months. In PC, the upregulated genes ESR1 and SRC were not significant enough in survival analysis but the downregulated gene CTNNB1 was significant with 1.59 h and 56.09 median survival months (Table 3). This indicates that the downregulated genes could also significantly contribute to the survival prognosis of cancer [51, 52]. Whereas in EC, the overexpressed gene ESR1 came out to be significant in terms of survival with 47.67 months survival rate and 1.11 h. Further analyzing the OC survival curves, JUN and BRCA1 were prominent for their survival parameters with limited survival months of 32.85, 36.33, and 1.74, 1.52 h respectively. Based on this analysis, the genes STAT3,* MYC*,* CTNNB1*,* ESR1*,* JUN*, and BRCA1 emerged as pivotal genes, indicating their significant impact on each cancer type in response to radiation exposure.
Upregulation of STAT3 in association with different cytokines was essential in regulating various processes in promoting cancer including, tumor progression, proliferation, and metastasis. Ionizing radiations can phosphorylate STAT3, activate the JAK/STAT3 pathway, and influence the downstream targets associated with STAT3 [53, 54]. Similarly, MYC is a multifunctional gene that can bind to various cell proliferation and differentiation-associated genes upon overexpression, inhibit, and promote transformation, stimulate transcription, promote metastasis, alter tumor microenvironment, and contribute to increased drug resistance [55]. Although the role of CTNNB1 is not well studied in PC, mutations or over-expression of the CTNNB1 gene were found associated with tumorigenesis. In general, CTNNB1 is majorly involved in the Wnt/β-catenin pathway whose activation is well established to contribute to cancer [56]. A study on CTNNB1 in EC cells revealed that the Wnt/β-catenin signaling pathway could be activated when the cells are exposed to radiation and hypoxic conditions where there is nuclear accumulation of β-catenin irrespective of CTNNB1 mutation in the cells. This study signifies the important role of CTNNB1 in tumor progression after post-radiation exposure of the cancer cells [57]. In OC, the JUN gene, which is part of the JUN N-terminal kinase (JNK) signaling pathway, plays a critical role in controlling cell death, survival, growth, and proliferation within the mitogen-activated protein kinase (MAPK) signaling cascade. This gene is frequently activated and is considered essential for OC progression [58]. Another study on the expression of nucleosome assembly protein 1-like 1 (NAP1L1) demonstrated that its interaction with hepatoma-derived growth factor (HDGF) in the cytoplasm can stimulate the JUN proto-oncogene. This activation subsequently triggers the proliferation of OC cells through the HDGF/C-JUN signaling pathway. Through this pathway, HDGF enhances JUN expression, promoting cellular mechanisms that lead to OC cell growth and proliferation, highlighting the pathway’s potential role in OC progression [59]. BRCA1, a critical tumor suppressor gene and hub in OC, is essential for cellular responses to DNA damage and repair mechanisms that maintain genomic stability. BRCA1 is directly involved in homologous recombination-mediated repair of double-stranded DNA breaks and coordinates with proteins such as receptor-associated protein 80 and C-terminal binding proteins to form DNA repair complexes, thereby regulating transcriptional repression. Alterations or overexpression of BRCA1 in OC cells can significantly drive tumor progression, especially under genotoxic stressors like radiation [60–62]. ESR1 encodes the nuclear transcription factor estrogen receptor α (ERα), which is crucial for the carcinogenic progression of HSC cells. ESR1 is involved in the E2/ERα signaling pathway, where estrogen (E2) binds to ERα in the nucleus to form the E2-ERα complex. This complex promotes the assembly of the transcription initiation machinery, thereby activating the transcription of target genes. This classical E2/ERα signaling pathway is fundamental to the initiation and progression of EC, driving the expression of genes critical for cell growth and survival [63]. ERα is also integral to multiple critical pathways in cancer, including the JAK/STAT, MAPK, PI3K/AKT/mTOR, and Wnt/β-catenin pathways. Within these pathways, ERα interacts with key regulatory proteins, such as Bcl-xl, PTEN, MEK, and β-catenin, forming intermediate complexes that contribute to both upstream and downstream signaling regulation. These interactions enhance the modulation of cell survival, proliferation, and apoptosis, amplifying the oncogenic processes in EC by coordinating cellular responses across multiple signaling networks [64]. These clinical and experimental studies indicate that the identified hub genes play critical roles in HSC progression, where exposure to photo radiation can markedly alter gene expression in cancer cells, further promoting oncogenesis [65]. Validating the result mutational analysis was performed. Dysregulation of cellular processes facilitated by amplified genes contributes to the progression of cancer [66].
In comparing KEGG pathway enrichment results across four cancer types, several key pathways consistently emerged. Specifically, enrichment data showed the involvement of MYC and STAT3 in BC, CTNNB1 in PC, BRCA1 and JUN in OC, and ESR1 in EC. Notably, experimentally validated pathways included the PI3K-AKT signaling pathway, where MYC plays a central role, and the JAK-STAT signaling pathway involved STAT3. An in-vitro study on prostate cancer cells exposed to PI3K/mToR inhibitors found to trigger radio-sensitization in the associated PI3K/mToR pathway [67]. The CTNNB1 gene was prominent in pathways associated with PC, OC, and BC, notifying its importance in HSCs. Further, BRCA1 was linked to the homologous recombination pathway across cancer types. MYC, STAT3, and ESR1 were implicated in the chemical carcinogenesis receptor activation pathway, while the estrogen signaling pathway, a key pathway in HSCs, featured JUN and ESR1. In OC, the relaxin signaling pathway, which activates pro-oncogenic pathways such as MAPK, WNT, and Notch, also showed JUN as a significant contributor [68]. Additionally, ESR1 and JUN were involved in the endocrine resistance pathway in OC and EC, where signaling pathways associated with growth factor receptors, including key hormone-binding receptors, begin to develop resistance to cellular signaling [69]. In BC, STAT3 and MYC play a role in the transcription of microRNAs (miRNAs) implicated in cancer. These dysregulated miRNAs contribute to processes such as proliferative signaling, evasion of growth suppressors, metastasis, and resistance to cell death (Table 4) [70]. A study on gastric cancer cell proliferation inhibition has stated that the Tumor necrosis signaling pathway (TNFα) played a major role in cell proliferation and targeting that could have better effects on cancer prognosis. In this analysis, the JUN gene in OC was present in the TNF signaling pathway indicating its relation with cell proliferation across various cancers [71]. Amidst the well-established regulatory involvement of these genes in the respective cancers, the current study has identified the complex interactive role of these genes upon inducing HSCs, specific to radiation exposure.
Notably, DNA repair genes such as NBN,* XRCC3*,* BRCA1*,* BRCA2*,* ATM*,* RAD51* and CHEK2 were specifically observed in the clusters associated with BC, OC and PC in the current study. Moreover, pathways including homologous recombination and microRNAs in cancer were found to be significantly enriched with DNA repair genes. However, the hub genes exhibited predominant connectivity and central roles within DNA damage and repair associated pathways, emphasizing their potential functional relevance with respect to all the four cancers in this study.
Currently there are no biomarkers identified to predict radio-sensitivity. As radiotherapy is one of the prominent treatment methods utilized, identification of a biomarker is the need of the hour [65]. Identification of radiation associated biomarkers can aid in better understanding of treatment selection for cancer patients based on the radiation sensitivity [67].
The analysis is limited to computational predictions, although the findings need to be validated through experimental research, the findings could still drive the researchers to develop a diagnostic tool which is important in the case of earlier diagnosis of cancer as well as to decide if a patient could be subjected to radiation therapy for treatment. Moreover, since these biomarkers are well established in the associated pathways they can be explored as therapeutic targets in their respective HSCs with experimental validations in the future. The biomarkers can also be studied in other cancers and the experimental evaluation could be conducted contributing to early diagnosis and treatment of cancer, especially HSCs.
Conclusion
Cancer caused by radiation is becoming an inevitable concern since most of the cancer diagnostic procedures including computed tomography, magnetic resonance imaging, positron emission tomography, and mammography in the medical field are emitting ionizing and photo radiation. The environmental radioactive pollutants, exposure to radiation through occupational means, and exposure to non-ionizing radiation through household appliances are unavoidable, thus it is important to find a biomarker for early diagnosis. The current study has computationally predicted MYC and STAT3 in BC, CTNNB1 in PC, JUN, and BRCA1 in OC, and ESR1 in EC as radiation-induced cancer biomarkers. The findings could be lay a base-support for the experimental researchers working on biomarker identification and radiation effects. Additionally, the study contributes to a wider understanding of the pathway mechanisms of cancers induced by radiation.
Supplementary Information
Below is the link to the electronic supplementary material.
Supplementary Material 1.
The reference list from the paper itself. Each links out to its DOI / PubMed record.
- 1Emons G. Hormone-dependent cancers: molecular mechanisms and therapeutical implications. Cells. 2023;12.10.3390/cells 12010110 PMC 981820936611904 · doi ↗ · pubmed ↗
- 2Gonçalves D, et al. An overview on radiation sensitivity in hereditary breast and ovarian cancer syndrome. Cancers. 2022;14.10.3390/cancers 14133254 PMC 926570435805026 · doi ↗ · pubmed ↗
- 3Tanaka Y, Hirata K, Takahashi M, Kobayashi M. Laparoscopic-assisted hysteroscopic surgery for endometrial tumors arising after pelvic radiation therapy. Case Rep Obstet Gynecol. 2020;8837232(2020).10.1155/2020/8837232 PMC 774417733376613 · doi ↗ · pubmed ↗
- 4Zaarour RF, et al. Role of hypoxia-mediated autophagy in tumor cell death and survival. Cancers. 2021;13.10.3390/cancers 13030533 PMC 786686433573362 · doi ↗ · pubmed ↗
- 5Bartha Á, Győrffy B. TN Mplot.com: a web tool for the comparison of gene expression in normal, tumor and metastatic tissues. Int J Mol Sci. 2021;22.10.3390/ijms 22052622 PMC 796145533807717 · doi ↗ · pubmed ↗
- 6Calaf GM, et al. Gene signatures induced by ionizing radiation as prognostic tools in an in vitro experimental breast cancer model. Cancers. 2021;13.10.3390/cancers 13184571 PMC 846528434572798 · doi ↗ · pubmed ↗
- 7Pardo-Reoyo S, Roig-Lopez JL, Yang ES. Potential biomarkers for radiosensitivity in head and neck cancers. Ann Transl Med. 2016;4.10.21037/atm.2016.12.45PMC 523348228149885 · doi ↗ · pubmed ↗
- 8Burston HE, et al. Inhibition of relaxin autocrine signaling confers therapeutic vulnerability in ovarian cancer. J Clin Invest. 2021;131.10.1172/JCI 142677 PMC 801188933561012 · doi ↗ · pubmed ↗