Exploring the impact on emotional wellbeing of having a spouse or cohabiting partner with elevated Problem Gambling Severity Index (PGSI) scores: Secondary analysis of cross‐sectional health survey data
Sarah Tipping, Heather Wardle, Robert Pryce

TL;DR
This study explores how a partner's gambling problems affect an individual's emotional wellbeing using health survey data from England and Scotland.
Contribution
It is the first to analyze the emotional wellbeing impact of a cohabiting partner's elevated Problem Gambling Severity Index (PGSI) scores.
Findings
Higher partner PGSI scores are linked to lower emotional wellbeing as measured by WEMWBS, GHQ-12, and life satisfaction.
The association remains after controlling for individual gambling behavior and socio-demographic factors.
No increased likelihood of long-term mental health conditions was found in individuals with high partner PGSI scores.
Abstract
To conduct an exploratory analysis of the association between the mental health and emotional wellbeing of an individual and the Problem Gambling Severity Index (PGSI) scores of their spouse or cohabiting partner. Observational study using two sources of secondary data: the Health Survey for England (HSE) and the Scottish Health Survey (SHeS). Data from 2012, 2015, 2016, 2017 (SHeS only) and 2018 (HSE only) were combined to create a single data set. The data contained household identifiers and a household grid, allowing cohabiting couples to be identified. England and Scotland. 20 752 individuals (in 10 376 couples) where both partners had completed the PGSI. Outcome measures were four self‐reported measures of emotional wellbeing: a binary measure indicating a long‐term mental health condition, a scale question on life satisfaction, the twelve‐item General Health Questionnaire…
Genes, proteins, chemicals, diseases, species, mutations and cell lines named across the full text — each resolved to its canonical identifier and authoritative record.
Click any figure to enlarge with its caption.
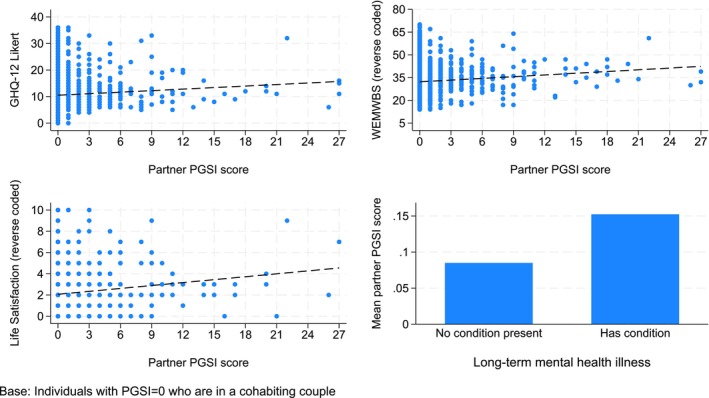 FIGURE 1
| Individual’s characteristics | Mean Partner PGSI | Standard deviation of partner PGSI | Weighted proportion of individuals (%) | Lower 95% CI for proportion of individuals (%) | Upper 95% CI for proportion of individuals (%) | Unweighted base |
|---|---|---|---|---|---|---|
| Age group | ||||||
| 16–34 years | 0.183 | 1.188 | 21.22 | 20.26 | 22.22 | 3421 |
| 35–64 years | 0.080 | 0.732 | 56.86 | 55.78 | 57.94 | 11 347 |
| 65+ years | 0.019 | 0.325 | 21.92 | 21.08 | 22.78 | 5323 |
| Sex | ||||||
| Male | 0.033 | 0.485 | 52.55 | 52.33 | 52.76 | 9866 |
| Female | 0.149 | 1.030 | 47.45 | 47.24 | 47.67 | 10 225 |
| Ethnicity (grouped) | ||||||
| Other | 0.087 | 0.920 | 10.16 | 9.49 | 10.88 | 1448 |
| White | 0.089 | 0.778 | 89.84 | 89.12 | 90.51 | 18 643 |
| Religion (grouped) | ||||||
| No religion | 0.108 | 0.867 | 34.22 | 33.27 | 35.19 | 7004 |
| Christian – Catholic | 0.087 | 0.736 | 18.68 | 17.93 | 19.44 | 3357 |
| Christian – all other denominations | 0.073 | 0.718 | 39.07 | 38.14 | 40.02 | 8605 |
| Any other religion | 0.079 | 0.936 | 8.03 | 7.41 | 8.69 | 1125 |
| Economic activity | ||||||
| In employment, self‐employed or government training | 0.098 | 0.821 | 64.24 | 63.29 | 65.18 | 11 976 |
| In full‐time education | 0.107 | 0.684 | 1.13 | 0.94 | 1.36 | 246 |
| Retired | 0.025 | 0.375 | 23.06 | 22.21 | 23.92 | 5584 |
| International Labour Organization (ILO) unemployed | 0.175 | 1.035 | 2.00 | 1.75 | 2.29 | 367 |
| Other inactive | 0.157 | 1.195 | 9.57 | 9.06 | 10.09 | 1918 |
| Highest educational qualification | ||||||
| Degree (or equivalent) or higher | 0.081 | 0.756 | 33.54 | 32.58 | 34.5 | 6576 |
| Higher education below degree | 0.081 | 0.749 | 12.23 | 11.69 | 12.79 | 2450 |
| A‐Levels/Scottish Highers/or equivalent | 0.106 | 0.919 | 15.24 | 14.6 | 15.9 | 2953 |
| GCSEs/Scottish Standard Grades/or equivalent | 0.093 | 0.725 | 21.89 | 21.15 | 22.64 | 4492 |
| Other | 0.110 | 0.899 | 1.12 | 0.97 | 1.29 | 237 |
| No qualifications | 0.085 | 0.856 | 16.00 | 15.3 | 16.72 | 3383 |
| Individual National Statistics Socio‐economic Classification (NS‐SEC) | ||||||
| Managerial and professional occupations | 0.075 | 0.722 | 41.85 | 40.92 | 42.79 | 8269 |
| Intermediate occupations | 0.107 | 0.782 | 14.12 | 13.56 | 14.71 | 2837 |
| Small employers and own account workers | 0.071 | 0.774 | 10.35 | 9.8 | 10.92 | 1981 |
| Lower supervisory and technical occupations | 0.098 | 0.832 | 7.08 | 6.65 | 7.52 | 1436 |
| Semi‐routine occupations | 0.092 | 0.765 | 24.48 | 23.7 | 25.28 | 5183 |
| Missing | 0.240 | 1.832 | 2.13 | 1.87 | 2.41 | 385 |
| Equivalised income quintiles | ||||||
| Lowest quintile (≤£14,918) | 0.087 | 0.829 | 22.50 | 21.55 | 23.49 | 4440 |
| Second lowest quintile (>£14,918 to ≤£23,084) | 0.090 | 0.744 | 21.15 | 20.21 | 22.13 | 4231 |
| Middle quintile (>£23,084 to ≤£31,967) | 0.065 | 0.640 | 17.87 | 17 | 18.76 | 3758 |
| Second highest quintile (>£31,967 to ≤£52 817) | 0.109 | 0.916 | 13.52 | 12.76 | 14.32 | 2869 |
| Highest quintile (>£52,817) | 0.092 | 0.795 | 11.93 | 11.19 | 12.71 | 2279 |
| Missing income | 0.090 | 0.861 | 13.03 | 12.24 | 13.85 | 2514 |
| Tenure | ||||||
| Buying with mortgage/loan | 0.078 | 0.669 | 38.78 | 37.65 | 39.93 | 7556 |
| Own home outright | 0.049 | 0.588 | 34.96 | 33.89 | 36.05 | 7852 |
| Part rent/part mortgage | 0.180 | 0.725 | 0.71 | 0.54 | 0.94 | 143 |
| Rent (including rents paid by housing benefit) | 0.161 | 1.157 | 24.66 | 23.62 | 25.72 | 4361 |
| Living rent free | 0.002 | 0.045 | 0.89 | 0.68 | 1.17 | 179 |
| Number of cars normally available | ||||||
| None | 0.173 | 1.199 | 9.34 | 8.64 | 10.07 | 1660 |
| One | 0.091 | 0.837 | 38.52 | 37.4 | 39.66 | 8217 |
| Two | 0.071 | 0.621 | 41.47 | 40.34 | 42.6 | 8349 |
| Three or more | 0.074 | 0.781 | 10.68 | 9.93 | 11.47 | 1865 |
| Weekly drinking category | ||||||
| Non‐drinker | 0.076 | 0.741 | 12.47 | 11.8 | 13.16 | 2524 |
| Moderate (men, <22 units; women, <15 units) | 0.093 | 0.833 | 67.56 | 66.64 | 68.48 | 13 468 |
| Hazardous (men, 22–50 units; women, 15–35 units) | 0.078 | 0.544 | 15.74 | 15.08 | 16.44 | 3275 |
| Harmful (men, >50 units; women, >35 units) | 0.092 | 1.054 | 4.22 | 3.87 | 4.61 | 822 |
| Cigarette smoking status | ||||||
| Never smoked cigarettes at all | 0.083 | 0.817 | 51.69 | 50.75 | 52.64 | 10 135 |
| Used to smoke cigarettes occasionally | 0.111 | 0.808 | 5.87 | 5.47 | 6.3 | 1180 |
| Used to smoke cigarettes regularly | 0.068 | 0.625 | 28.28 | 27.48 | 29.1 | 5962 |
| Current cigarette smoker | 0.139 | 0.980 | 14.16 | 13.45 | 14.89 | 2812 |
| Ever exposed to passive smoke in own or others home | ||||||
| Never exposed | 0.080 | 0.771 | 88.74 | 88.07 | 89.38 | 17 749 |
| Exposed | 0.155 | 0.952 | 11.26 | 10.62 | 11.93 | 2340 |
| Ever had high blood pressure (also known as hypertension) | ||||||
| Yes | 0.058 | 0.577 | 24.38 | 23.65 | 25.13 | 5418 |
| No | 0.098 | 0.852 | 75.62 | 74.87 | 76.35 | 14 673 |
| Ever had diabetes | ||||||
| Yes | 0.065 | 0.717 | 6.67 | 6.27 | 7.1 | 1420 |
| No | 0.090 | 0.799 | 93.33 | 92.9 | 93.73 | 18 671 |
| Limiting long‐lasting illness | ||||||
| Limiting long‐lasting illness | 0.075 | 0.733 | 21.59 | 20.86 | 22.34 | 5016 |
| Non‐limiting long‐lasting illness | 0.064 | 0.586 | 18.58 | 17.91 | 19.26 | 3754 |
| No limiting long‐lasting illness | 0.100 | 0.868 | 59.83 | 58.92 | 60.74 | 11 321 |
| Marital status recoded | ||||||
| Married/civil partnership | 0.070 | 0.756 | 79.42 | 78.39 | 80.4 | 16 553 |
| Living as married | 0.159 | 0.921 | 20.58 | 19.6 | 21.61 | 3538 |
| Household type | ||||||
| Small family: 2 adults of any age and 1 or 2 children | 0.121 | 0.928 | 23.08 | 22.14 | 24.06 | 4684 |
| Older smaller family: 1 or more adults of 65+ years and 1 or 2 children | 0.023 | 0.344 | 22.81 | 21.93 | 23.71 | 5659 |
| Large adult: 3+ adults, no children | 0.063 | 0.669 | 15.40 | 14.48 | 16.37 | 2322 |
| Small adult: 2 adults under 65 years and no children | 0.100 | 0.768 | 27.36 | 26.31 | 28.43 | 5431 |
| Large family: 2 adults of any age and 3+ children or 3+ adults and 1+ children | 0.159 | 1.233 | 11.35 | 10.59 | 12.15 | 1995 |
| Quintiles of Indices of Multiple Deprivation (IMD) score | ||||||
| Least deprived quintile | 0.050 | 0.498 | 23.00 | 22.08 | 23.96 | 4801 |
| 2nd | 0.073 | 0.656 | 22.16 | 21.22 | 23.13 | 4786 |
| 3rd | 0.069 | 0.743 | 21.96 | 21 | 22.96 | 4379 |
| 4th | 0.119 | 0.918 | 18.40 | 17.49 | 19.35 | 3503 |
| Most deprived quintile | 0.162 | 1.175 | 14.47 | 13.66 | 15.33 | 2622 |
| Government Office Region | ||||||
| North East | 0.166 | 1.429 | 4.26 | 4.16 | 4.37 | 1043 |
| North West | 0.090 | 0.615 | 11.97 | 11.71 | 12.24 | 1792 |
| Yorkshire and the Humber | 0.113 | 0.918 | 8.76 | 8.58 | 8.95 | 1187 |
| East Midlands | 0.068 | 0.520 | 8.40 | 8.24 | 8.57 | 1302 |
| West Midlands | 0.072 | 0.835 | 9.66 | 9.45 | 9.88 | 1232 |
| East of England | 0.063 | 0.492 | 10.73 | 10.51 | 10.95 | 1658 |
| London | 0.103 | 0.923 | 12.22 | 11.89 | 12.57 | 1309 |
| South East | 0.078 | 0.670 | 15.21 | 14.96 | 15.46 | 2187 |
| South West | 0.060 | 0.586 | 10.11 | 9.92 | 10.31 | 1452 |
| Scotland | 0.124 | 1.077 | 8.67 | 8.56 | 8.78 | 6929 |
| Rurality of dwelling unit (urban/rural) – binary – recoded | ||||||
| Urban | 0.095 | 0.840 | 78.33 | 77.43 | 79.2 | 15 024 |
| Town/fringe/village, hamlet and isolated dwellings | 0.065 | 0.596 | 21.67 | 20.8 | 22.57 | 5067 |
| Whether spent money on any gambling activity in last 12 months | ||||||
| Yes, spent money on one or more gambling activities | 0.095 | 0.797 | 60.77 | 59.82 | 61.72 | 12 450 |
| Did not spend money on gambling activities in past year | 0.078 | 0.789 | 39.23 | 38.28 | 40.18 | 7641 |
| Total | 0.088 | 0.794 | 100.00 | 20 091 |
| Partner PGSI scores | |
|---|---|
| Mean | 0.088 |
| Standard deviation | 0.794 |
| Unweighted base | 20 091 |
| Mean wellbeing score of the individual | Standard deviation of individual's wellbeing score | Correlation of individual's wellbeing score with partner PGSI |
| Unweighted base | |
|---|---|---|---|---|---|
| WEMWBS score | 51.98 | 8.21 | −0.042 | <0.001 | 15 381 |
| GHQ‐12 score | 10.65 | 4.73 | 0.036 | <0.001 | 16 523 |
| Overall satisfaction with life nowadays | 7.75 | 1.79 | −0.045 | <0.001 | 13 491 |
| Long‐term mental health | Mean partner PGSI | Standard deviation of partner PGSI | Unweighted base |
|---|---|---|---|
| No condition present | 0.085 | 0.781 | 16 067 |
| Has condition | 0.152 | 0.995 | 1015 |
| Total | 0.088 | 0.794 | 20 082 |
| Baseline | Categories | Coef. | 95% CI |
|
|
|---|---|---|---|---|---|
|
| |||||
| Partner PGSI score | 0.036 | 0.017, 0.055 | 3.743 | <0.001 | |
| Constant | −0.032 | −0.055, –0.009 | −2.777 | 0.005 | |
|
| |||||
| Partner PGSI score | 0.022 | 0.004, 0.040 | 2.367 | 0.018 | |
| Individual had not spent money on any gambling activity in last 12 months | Individual had spent money on any gambling activity in last 12 months | 0.008 | −0.033, 0.049 | 0.384 | 0.701 |
| 16–24 years | 25–34 years | −0.099 | −0.224, 0.027 | −1.542 | 0.123 |
| 35–44 years | 0.007 | −0.127, 0.140 | 0.101 | 0.920 | |
| 45–54 years | 0.008 | −0.127, 0.143 | 0.110 | 0.912 | |
| 55–64 years | −0.131 | −0.272, 0.010 | −1.821 | 0.069 | |
| 65–74 years | −0.220 | −0.394, –0.045 | −2.470 | 0.014 | |
| 75+ years | −0.095 | −0.289, 0.099 | −0.960 | 0.337 | |
| Male | Female | 0.008 | −0.028, 0.044 | 0.435 | 0.664 |
| Other ethnic background | White | 0.211 | 0.108, 0.315 | 3.995 | <0.001 |
| No religion | Christian – Catholic | −0.069 | −0.126, –0.012 | −2.363 | 0.018 |
| Christian – all other denominations | −0.051 | −0.097, –0.005 | −2.155 | 0.031 | |
| Any other religion | 0.040 | −0.074, 0.155 | 0.690 | 0.490 | |
| In employment, self‐employment or government training | In full‐time education | 0.003 | −0.168, 0.174 | 0.038 | 0.970 |
| Retired | −0.139 | −0.218, –0.060 | −3.469 | 0.001 | |
| ILO unemployed | 0.123 | −0.014, 0.260 | 1.754 | 0.079 | |
| Other inactive | 0.179 | 0.100, 0.258 | 4.439 | <0.001 | |
| Degree (or equivalent) or higher | Higher education below degree | 0.044 | −0.019, 0.107 | 1.384 | 0.167 |
| A‐Level/Scottish Higher/or equivalent | 0.106 | 0.045, 0.167 | 3.399 | 0.001 | |
| GCSE/Scottish Standard Grade/or equivalent | 0.183 | 0.121, 0.244 | 5.826 | <0.001 | |
| Other | 0.117 | −0.041, 0.276 | 1.452 | 0.146 | |
| No qualifications | 0.158 | 0.082, 0.233 | 4.103 | <0.001 | |
| Missing occupation | Managerial and professional occupations | 0.154 | −0.012, 0.320 | 1.823 | 0.068 |
| Intermediate occupations | 0.256 | 0.087, 0.426 | 2.963 | 0.003 | |
| Small employers and own account workers | 0.082 | −0.091, 0.256 | 0.930 | 0.352 | |
| Lower supervisory and technical occupations | 0.208 | 0.030, 0.386 | 2.297 | 0.022 | |
| Semi‐routine occupations | 0.193 | 0.028, 0.359 | 2.294 | 0.022 | |
| Missing income | Lowest quintile (≤£14,918) | −0.051 | −0.132, 0.030 | −1.239 | 0.216 |
| Second lowest quintile (>£14,918 to ≤£23,084) | 0.017 | −0.064, 0.097 | 0.403 | 0.687 | |
| Middle quintile (>£23,084 to ≤£31,967) | −0.035 | −0.116, 0.046 | −0.849 | 0.396 | |
| Second highest quintile (>£31,967 to ≤£52 817) | 0.056 | −0.033, 0.146 | 1.233 | 0.217 | |
| Highest quintile (>£52,817) | 0.143 | 0.042, 0.243 | 2.777 | 0.006 | |
| Buying with mortgage/loan | Own it outright | −0.030 | −0.077, 0.017 | −1.249 | 0.212 |
| Part rent/part mortgage | 0.209 | −0.047, 0.466 | 1.600 | 0.110 | |
| Rent (including rents paid by housing benefit) | −0.016 | −0.079, 0.047 | −0.489 | 0.625 | |
| Living rent free | −0.149 | −0.387, 0.090 | −1.221 | 0.222 | |
| No cars available in household | One | −0.008 | −0.100, 0.084 | −0.178 | 0.859 |
| Two | −0.065 | −0.160, 0.031 | −1.330 | 0.184 | |
| Three or more | −0.111 | −0.228, 0.007 | −1.851 | 0.064 | |
| Non‐drinker | Moderate (men, <22 units; women, <15 units) | −0.083 | −0.155, –0.011 | −2.262 | 0.024 |
| Hazardous (men, 22–50 units; women, 15–35 units) | −0.093 | −0.176, –0.010 | −2.197 | 0.028 | |
| Harmful (men, >50 units; women, >35 units) | 0.036 | −0.084, 0.157 | 0.588 | 0.557 | |
| Never smoked cigarettes at all | Used to smoke cigarettes occasionally | 0.056 | −0.023, 0.136 | 1.386 | 0.166 |
| Used to smoke cigarettes regularly | 0.042 | −0.003, 0.087 | 1.846 | 0.065 | |
| Current cigarette smoker | 0.095 | 0.029, 0.161 | 2.801 | 0.005 | |
| Never exposed to tobacco smoke | Exposed | 0.074 | 0.007, 0.141 | 2.172 | 0.030 |
| Has high blood pressure (hypertension) | Does not have high blood pressure (hypertension) | −0.068 | −0.115, –0.021 | −2.834 | 0.005 |
| Has diabetes | Does not have diabetes | −0.049 | −0.131, 0.032 | −1.188 | 0.235 |
| Limiting long‐lasting illness | Non‐limiting long‐lasting illness | −0.532 | −0.595, –0.469 | −16.595 | <0.001 |
| No limiting long‐lasting illness | −0.635 | −0.691, –0.578 | −22.005 | <0.001 | |
| Married/civil partnership | Living as married | 0.082 | 0.020, 0.143 | 2.599 | 0.009 |
| Small family: 2 adults of any age and 1 or 2 children | Older small family: 1 or more adults aged 65+ years and 1 or 2 children | −0.083 | −0.198, 0.033 | −1.403 | 0.161 |
| Large adult: 3+ adults, no children | 0.098 | 0.010, 0.187 | 2.179 | 0.029 | |
| Small adult: 2 adults under 65 and no children | 0.004 | −0.059, 0.067 | 0.133 | 0.894 | |
| Large family: 2 adults of any age and 3+ children or 3+ adults and 1+ children | −0.021 | −0.103, 0.060 | −0.512 | 0.609 | |
| Least deprived | 2nd | 0.030 | −0.027, 0.087 | 1.038 | 0.299 |
| 3rd | 0.011 | −0.048, 0.070 | 0.370 | 0.711 | |
| 4th | 0.035 | −0.030, 0.100 | 1.051 | 0.293 | |
| Most deprived | 0.030 | −0.049, 0.108 | 0.742 | 0.458 | |
| Urban | Town/fringe/village, hamlet and isolated dwellings | −0.005 | −0.056, 0.045 | −0.209 | 0.835 |
| North East | North West | −0.025 | −0.133, 0.084 | −0.449 | 0.653 |
| Yorkshire and the Humber | 0.035 | −0.081, 0.152 | 0.593 | 0.553 | |
| East Midlands | 0.004 | −0.110, 0.118 | 0.068 | 0.946 | |
| West Midlands | 0.004 | −0.112, 0.121 | 0.075 | 0.940 | |
| East of England | 0.041 | −0.068, 0.150 | 0.733 | 0.464 | |
| London | 0.013 | −0.111, 0.136 | 0.199 | 0.842 | |
| South East | −0.040 | −0.143, 0.063 | −0.761 | 0.447 | |
| South West | 0.047 | −0.062, 0.156 | 0.840 | 0.401 | |
| Scotland | 0.105 | 0.011, 0.199 | 2.179 | 0.029 | |
| General health very good/good | Fair | – | – | – | – |
| Bad/very bad | – | – | – | – | |
| Survey year (2012) | 2015 | 0.100 | 0.048,0.152 | 3.774 | <0.001 |
| 2016 | 0.289 | 0.237,0.342 | 10.745 | <0.001 | |
| 2017/8 | 0.169 | 0.093,0.244 | 4.363 | <0.001 | |
| Constant | 0.087 | −0.210,0.385 | 0.575 | 0.566 | |
| Base (unweighted) | 15 379 |
| Baseline | Categories | Coef. | 95% CI |
|
|
|---|---|---|---|---|---|
|
| |||||
| Partner PGSI score | 0.039 | 0.015, 0.062 | 3.262 | 0.001 | |
| Constant | 0.023 | 0.002, 0.044 | 2.137 | 0.033 | |
|
| |||||
| Partner PGSI score | 0.021 | 0.000, 0.043 | 1.974 | 0.048 | |
| Individual had not spent money on any gambling activity in last 12 months | Individual had spent money on any gambling activity in last 12 months | −0.006 | −0.046, 0.034 | −0.296 | 0.767 |
| 16–24 years | 25–34 years | 0.036 | −0.095, 0.168 | 0.542 | 0.588 |
| 35–44 years | 0.169 | 0.032, 0.306 | 2.424 | 0.015 | |
| 45–54 years | 0.122 | −0.018, 0.262 | 1.704 | 0.088 | |
| 55–64 years | 0.036 | −0.109, 0.180 | 0.485 | 0.628 | |
| 65–74 years | −0.039 | −0.215, 0.137 | −0.434 | 0.664 | |
| 75+ years | −0.036 | −0.226, 0.155 | −0.365 | 0.715 | |
| Male | Female | 0.116 | 0.079, 0.154 | 6.081 | <0.001 |
| Other ethnic background | White | 0.203 | 0.101, 0.305 | 3.902 | <0.001 |
| No religion | Christian – Catholic | −0.037 | −0.092, 0.018 | −1.313 | 0.189 |
| Christian – all other denominations | −0.007 | −0.050, 0.037 | −0.304 | 0.761 | |
| Any other religion | 0.102 | −0.023, 0.227 | 1.596 | 0.111 | |
| In employment, self‐employment or government training | In full‐time education | 0.210 | 0.020, 0.400 | 2.166 | 0.030 |
| Retired | −0.121 | −0.193, –0.049 | −3.286 | 0.001 | |
| ILO unemployed | 0.342 | 0.155, 0.530 | 3.587 | <0.001 | |
| Other inactive | 0.351 | 0.266, 0.435 | 8.096 | <0.001 | |
| Degree (or equivalent) or higher | Higher education below degree | −0.018 | −0.078, 0.043 | −0.575 | 0.566 |
| A‐Level/Scottish Higher/or equivalent | −0.046 | −0.108, 0.017 | −1.434 | 0.152 | |
| GCSE/Scottish Standard Grade/or equivalent | −0.021 | −0.080, 0.039 | −0.681 | 0.496 | |
| Other | −0.123 | −0.283, 0.037 | −1.511 | 0.131 | |
| No qualifications | 0.009 | −0.068, 0.085 | 0.221 | 0.825 | |
| Missing occupation | Managerial and professional occupations | 0.165 | −0.016, 0.347 | 1.784 | 0.075 |
| Intermediate occupations | 0.198 | 0.012, 0.384 | 2.083 | 0.037 | |
| Small employers and own account workers | 0.159 | −0.031, 0.350 | 1.641 | 0.101 | |
| Lower supervisory and technical occupations | 0.117 | −0.074, 0.307 | 1.198 | 0.231 | |
| Semi‐routine occupations | 0.117 | −0.065, 0.300 | 1.257 | 0.209 | |
| Missing income | Lowest quintile (≤£14,918) | 0.034 | −0.035, 0.104 | 0.965 | 0.334 |
| Second lowest quintile (>£14,918 to ≤£23,084) | 0.046 | −0.024, 0.115 | 1.291 | 0.197 | |
| Middle quintile (>£23,084 to ≤£31,967) | 0.040 | −0.030, 0.110 | 1.110 | 0.267 | |
| Second highest quintile (>£31,967 to ≤£52 817) | 0.048 | −0.028, 0.125 | 1.238 | 0.216 | |
| Highest quintile (>£52,817) | 0.188 | 0.099, 0.277 | 4.128 | <0.001 | |
| Buying with mortgage/loan | Own it outright | −0.030 | −0.075, 0.014 | −1.337 | 0.181 |
| Part rent/part mortgage | 0.100 | −0.138, 0.337 | 0.824 | 0.410 | |
| Rent (including rents paid by housing benefit) | −0.042 | −0.104, 0.020 | −1.340 | 0.180 | |
| Living rent free | −0.020 | −0.234, 0.195 | −0.179 | 0.858 | |
| No cars available in household | One | 0.019 | −0.067, 0.105 | 0.430 | 0.667 |
| Two | −0.020 | −0.109, 0.069 | −0.450 | 0.653 | |
| Three or more | −0.010 | −0.123, 0.103 | −0.180 | 0.857 | |
| Non‐drinker | Moderate (men, <22 units; women, <15 units) | −0.081 | −0.154, –0.009 | −2.194 | 0.028 |
| Hazardous (men, 22–50 units; women, 15–35 units) | −0.091 | −0.173, –0.008 | −2.141 | 0.032 | |
| Harmful (men, >50 units; women, >35 units) | −0.008 | −0.127, 0.110 | −0.139 | 0.889 | |
| Never smoked cigarettes at all | Used to smoke cigarettes occasionally | 0.110 | 0.027, 0.194 | 2.604 | 0.009 |
| Used to smoke cigarettes regularly | 0.008 | −0.034, 0.051 | 0.375 | 0.708 | |
| Current cigarette smoker | 0.020 | −0.044, 0.085 | 0.616 | 0.538 | |
| Never exposed to tobacco smoke | Exposed | 0.090 | 0.023, 0.158 | 2.611 | 0.009 |
| Has high blood pressure (hypertension) | Does not have high blood pressure (hypertension) | −0.089 | −0.137, –0.041 | −3.648 | <0.001 |
| Has diabetes | Does not have diabetes | −0.059 | −0.148, 0.031 | −1.282 | 0.200 |
| Limiting long‐lasting illness | Non‐limiting long‐lasting illness | −0.653 | −0.716, –0.590 | −20.292 | <0.001 |
| No limiting long‐lasting illness | −0.755 | −0.812, –0.698 | −25.849 | <0.001 | |
| Married/civil partnership | Living as married | 0.061 | 0.002, 0.120 | 2.016 | 0.044 |
| Small family: 2 adults of any age and 1 or 2 children | Older small family: 1 or more adults aged 65+ years and 1 or 2 children | −0.049 | −0.156, 0.059 | −0.890 | 0.373 |
| Large adult: 3+ adults, no children | 0.052 | −0.028, 0.131 | 1.280 | 0.201 | |
| Small adult: 2 adults under 65 and no children | 0.048 | −0.013, 0.110 | 1.540 | 0.124 | |
| Large family: 2 adults of any age and 3+ children or 3+ adults and 1+ children | 0.055 | −0.021, 0.131 | 1.419 | 0.156 | |
| Least deprived | 2nd | 0.040 | −0.011, 0.092 | 1.542 | 0.123 |
| 3rd | 0.029 | −0.027, 0.085 | 1.009 | 0.313 | |
| 4th | 0.043 | −0.019, 0.105 | 1.353 | 0.176 | |
| Most deprived | −0.001 | −0.078, 0.075 | −0.036 | 0.971 | |
| Urban | Town/fringe/village, hamlet and isolated dwellings | −0.016 | −0.062, 0.030 | −0.675 | 0.500 |
| North East | North West | −0.063 | −0.164, 0.038 | −1.217 | 0.224 |
| Yorkshire and the Humber | 0.018 | −0.090, 0.127 | 0.335 | 0.738 | |
| East Midlands | 0.027 | −0.079, 0.133 | 0.499 | 0.617 | |
| West Midlands | 0.045 | −0.062, 0.152 | 0.821 | 0.412 | |
| East of England | −0.006 | −0.108, 0.096 | −0.110 | 0.912 | |
| London | −0.049 | −0.164, 0.065 | −0.847 | 0.397 | |
| South East | 0.004 | −0.094, 0.102 | 0.081 | 0.936 | |
| South West | −0.007 | −0.107, 0.092 | −0.146 | 0.884 | |
| Scotland | −0.116 | −0.205, –0.027 | −2.543 | 0.011 | |
| General health very good/good | Fair | – | – | – | – |
| Bad/Very bad | – | – | – | – | |
| Survey year (2012) | 2015 | 0.032 | −0.037, 0.100 | 0.905 | 0.365 |
| 2016 | 0.07 | 0.021, 0.118 | 2.803 | 0.005 | |
| 2017/8 | 0.005 | −0.042, 0.053 | 0.222 | 0.824 | |
| Constant | 0.228 | −0.073, 0.528 | 1.487 | 0.137 | |
| Base (unweighted) | 16 521 |
| Baseline | Categories | Coef. | 95% CI |
|
|
|---|---|---|---|---|---|
|
| |||||
| Partner PGSI score | 0.053 | 0.020, 0.086 | 3.151 | 0.002 | |
| Constant | 0.097 | 0.070, 0.124 | 7.053 | <0.001 | |
|
| |||||
| Partner PGSI score | 0.036 | 0.005, 0.067 | 2.291 | 0.022 | |
| Individual had not spent money on any gambling activity in last 12 months | Individual had spent money on any gambling activity in last 12 months | 0.019 | −0.028, 0.067 | 0.802 | 0.423 |
| 16–24 years | 25–34 years | 0.047 | −0.113, 0.207 | 0.577 | 0.564 |
| 35–44 years | 0.145 | −0.022, 0.313 | 1.699 | 0.089 | |
| 45–54 years | 0.152 | −0.016, 0.321 | 1.771 | 0.077 | |
| 55–64 years | 0.039 | −0.133, 0.212 | 0.445 | 0.656 | |
| 65–74 years | −0.068 | −0.278, 0.142 | −0.638 | 0.523 | |
| 75+ years | −0.014 | −0.244, 0.217 | −0.115 | 0.908 | |
| Male | Female | −0.036 | −0.078, 0.006 | −1.661 | 0.097 |
| Other ethnic background | White | 0.102 | −0.013, 0.216 | 1.744 | 0.081 |
| No religion | Christian – Catholic | −0.089 | −0.156, –0.022 | −2.592 | 0.010 |
| Christian all other denominations | −0.096 | −0.149, –0.042 | −3.527 | <0.001 | |
| Any other religion | 0.080 | −0.060, 0.220 | 1.123 | 0.261 | |
| In employment, self‐employment or government training | In full‐time education | 0.034 | −0.156, 0.223 | 0.346 | 0.729 |
| Retired | −0.108 | −0.195, –0.021 | −2.440 | 0.015 | |
| ILO unemployed | 0.514 | 0.313, 0.715 | 5.012 | <0.001 | |
| Other inactive | 0.419 | 0.310, 0.527 | 7.586 | <0.001 | |
| Degree (or equivalent) or higher | Higher education below degree | −0.013 | −0.086, 0.059 | −0.362 | 0.717 |
| A‐Level/Scottish Higher/or equivalent | −0.027 | −0.098, 0.044 | −0.743 | 0.458 | |
| GCSE/Scottish Standard Grade/or equivalent | −0.050 | −0.119, 0.019 | −1.420 | 0.156 | |
| Other | −0.053 | −0.267, 0.161 | −0.486 | 0.627 | |
| No qualifications | −0.035 | −0.129, 0.058 | −0.744 | 0.457 | |
| Missing occupation | Managerial and professional occupations | 0.251 | 0.034, 0.469 | 2.269 | 0.023 |
| Intermediate occupations | 0.283 | 0.062, 0.504 | 2.510 | 0.012 | |
| Small employers and own account workers | 0.293 | 0.067, 0.518 | 2.542 | 0.011 | |
| Lower supervisory and technical occupations | 0.177 | −0.051, 0.406 | 1.521 | 0.128 | |
| Semi‐routine occupations | 0.291 | 0.075, 0.508 | 2.634 | 0.008 | |
| Missing income | Lowest quintile (≤£14,918) | −0.127 | −0.214, –0.040 | −2.851 | 0.004 |
| Second lowest quintile (>£14,918 to ≤£23,084) | −0.056 | −0.147, 0.034 | −1.218 | 0.223 | |
| Middle quintile (>£23,084 to ≤£31,967) | −0.118 | −0.208, –0.027 | −2.556 | 0.011 | |
| Second highest quintile (>£31,967 to ≤£52 817) | −0.030 | −0.128, 0.068 | −0.600 | 0.548 | |
| Highest quintile (>£52,817) | 0.001 | −0.113, 0.116 | 0.021 | 0.983 | |
| Buying with mortgage/loan | Own it outright | −0.001 | −0.053, 0.051 | −0.034 | 0.973 |
| Part rent/part mortgage | 0.132 | −0.166, 0.431 | 0.869 | 0.385 | |
| Rent (including rent paid by housing benefit) | 0.054 | −0.024, 0.133 | 1.358 | 0.175 | |
| Living rent free | 0.013 | −0.214, 0.241 | 0.116 | 0.908 | |
| No cars available in household | One | −0.045 | −0.160, 0.069 | −0.776 | 0.438 |
| Two | −0.130 | −0.247, –0.014 | −2.194 | 0.028 | |
| Three or more | −0.126 | −0.266, 0.015 | −1.753 | 0.080 | |
| Non‐drinker | Moderate (men, <22 units; women, <15 units) | −0.054 | −0.140, 0.033 | −1.218 | 0.223 |
| Hazardous (men, 22–50 units; women, 15–35 units) | −0.067 | −0.166, 0.032 | −1.335 | 0.182 | |
| Harmful (men, >50 units; women, >35 units) | 0.029 | −0.116, 0.175 | 0.395 | 0.693 | |
| Never smoked cigarettes at all | Used to smoke cigarettes occasionally | 0.054 | −0.043, 0.152 | 1.089 | 0.276 |
| Used to smoke cigarettes regularly | 0.025 | −0.024, 0.075 | 1.005 | 0.315 | |
| Current cigarette smoker | 0.074 | −0.008, 0.157 | 1.760 | 0.078 | |
| Never exposed to tobacco smoke | Exposed | 0.097 | 0.014, 0.180 | 2.283 | 0.022 |
| Has high blood pressure (hypertension) | Does not have high blood pressure (hypertension) | −0.059 | −0.115, –0.003 | −2.078 | 0.038 |
| Has diabetes | Does not have diabetes | −0.057 | −0.151, 0.037 | −1.188 | 0.235 |
| Limiting long‐lasting illness | Non‐limiting long‐lasting illness | −0.658 | −0.728, –0.587 | −18.250 | <0.001 |
| No limiting long‐lasting illness | −0.725 | −0.790, –0.659 | −21.680 | <0.001 | |
| Married/civil partnership | Living as married | 0.061 | −0.011, 0.132 | 1.659 | 0.097 |
| Small family: 2 adults of any age and 1 or 2 children | Older small family: 1 or more adults aged 65+ years and 1 or 2 children | −0.018 | −0.147, 0.112 | −0.269 | 0.788 |
| Large adult: 3+ adults, no children | 0.117 | 0.010, 0.223 | 2.140 | 0.032 | |
| Small adult: 2 adults under 65 and no children | 0.045 | −0.030, 0.120 | 1.170 | 0.242 | |
| Large family: 2 adults of any age and 3+ children or 3+ adults and 1+ children | 0.088 | −0.012, 0.189 | 1.722 | 0.085 | |
| Least deprived | 2nd | 0.029 | −0.037, 0.095 | 0.859 | 0.391 |
| 3rd | 0.010 | −0.059, 0.079 | 0.275 | 0.783 | |
| 4th | 0.059 | −0.017, 0.135 | 1.526 | 0.127 | |
| Most deprived | 0.044 | −0.050, 0.137 | 0.916 | 0.360 | |
| Urban | Town/fringe/village, hamlet and isolated dwellings | −0.046 | −0.105, 0.013 | −1.534 | 0.125 |
| North East | North West | −0.029 | −0.149, 0.092 | −0.469 | 0.639 |
| Yorkshire and the Humber | 0.112 | −0.028, 0.253 | 1.570 | 0.117 | |
| East Midlands | 0.061 | −0.065, 0.187 | 0.945 | 0.345 | |
| West Midlands | 0.070 | −0.061, 0.200 | 1.049 | 0.294 | |
| East of England | 0.048 | −0.080, 0.176 | 0.732 | 0.464 | |
| London | 0.001 | −0.142, 0.144 | 0.014 | 0.989 | |
| South East | 0.046 | −0.072, 0.164 | 0.762 | 0.446 | |
| South West | 0.046 | −0.077, 0.170 | 0.735 | 0.462 | |
| Scotland | −0.237 | −0.342, –0.131 | −4.403 | <0.001 | |
| General health very good/good | Fair | – | – | – | – |
| Bad/very bad | – | – | – | – | |
| Survey year (2012) | 2015 | −0.036 | −0.116, 0.045 | −0.873 | 0.383 |
| 2016 | 0.032 | −0.044, 0.108 | 0.832 | 0.405 | |
| 2017/8 | −0.121 | −0.199, –0.044 | −3.058 | 0.002 | |
| Constant | 0.506 | 0.123, 0.889 | 2.591 | 0.010 | |
| Base (unweighted) | 13 489 |
| Baseline | Categories | Odds ratio | 95% CI |
|
|
|---|---|---|---|---|---|
|
| |||||
| Partner PGSI score | 1.071 | 1.021,1.122 | 2.841 | 0.004 | |
| Constant | 0.054 | 0.049,0.058 | −70.814 | <0.001 | |
|
| |||||
| Partner PGSI score | 1.023 | 0.965,1.086 | 0.769 | 0.442 | |
| Individual had not spent money on any gambling activity in last 12 months | Individual had spent money on any gambling activity in last 12 months | 0.796 | 0.671,0.944 | −2.618 | 0.009 |
| 16–24 years | 25–34 years | 0.523 | 0.341,0.802 | −2.975 | 0.003 |
| 35–44 years | 0.819 | 0.526,1.275 | −0.886 | 0.376 | |
| 45–54 years | 0.539 | 0.344,0.846 | −2.691 | 0.007 | |
| 55–64 years | 0.377 | 0.232,0.614 | −3.925 | <0.001 | |
| 65–74 years | 0.490 | 0.233,1.030 | −1.883 | 0.060 | |
| 75+ years | 0.288 | 0.125,0.665 | −2.918 | 0.004 | |
| Male | Female | 1.593 | 1.339,1.895 | 5.265 | <0.001 |
| Other ethnic background | White | 3.665 | 2.224,6.039 | 5.098 | <0.001 |
| No religion | Christian ‐ Catholic | 0.608 | 0.470,0.788 | −3.766 | <0.001 |
| Christian all other denominations | 0.784 | 0.645,0.953 | −2.439 | 0.015 | |
| In employment, self‐employment or government training | Any other religion | 1.051 | 0.682,1.619 | 0.225 | 0.822 |
| In full‐time education | 0.510 | 0.218,1.198 | −1.545 | 0.122 | |
| Retired | 0.984 | 0.666,1.455 | −0.080 | 0.936 | |
| ILO unemployed | 1.561 | 0.972,2.508 | 1.843 | 0.065 | |
| Other inactive | 2.170 | 1.730,2.722 | 6.701 | <0.001 | |
| Degree (or equivalent) or higher | Higher education below degree | 0.906 | 0.665,1.234 | −0.625 | 0.532 |
| A‐level/Scottish highers/or equivalent | 1.059 | 0.806,1.392 | 0.413 | 0.680 | |
| GCSE/Scottish Standard Grades/or equivalent | 1.034 | 0.792,1.349 | 0.244 | 0.807 | |
| Other | 0.590 | 0.220,1.585 | −1.046 | 0.296 | |
| No qualifications | 0.822 | 0.586,1.151 | −1.142 | 0.253 | |
| Missing occupation | Managerial and professional occupations | 0.684 | 0.409,1.143 | −1.450 | 0.147 |
| Intermediate occupations | 0.836 | 0.503,1.390 | −0.690 | 0.490 | |
| Small employers and own account workers | 0.785 | 0.453,1.357 | −0.868 | 0.386 | |
| Lower supervisory and technical occupations | 0.565 | 0.317,1.007 | −1.938 | 0.053 | |
| Semi‐routine occupations | 0.758 | 0.460,1.247 | −1.092 | 0.275 | |
| Missing income | Lowest quintile (≤£14,918) | 1.188 | 0.821,1.718 | 0.915 | 0.360 |
| Second lowest quintile (>£14,918 to ≤£23,084) | 1.394 | 0.991,1.962 | 1.906 | 0.057 | |
| Middle quintile (>£23,084 to ≤£31,967) | 1.611 | 1.157,2.243 | 2.824 | 0.005 | |
| Second highest quintile (>£31,967 to ≤£52 817) | 1.750 | 1.248,2.452 | 3.249 | 0.001 | |
| Highest quintile (>£52,817) | 1.754 | 1.242,2.478 | 3.190 | 0.001 | |
| Buying with mortgage/loan | Own it outright | 0.973 | 0.777,1.218 | −0.237 | 0.813 |
| Part rent/part mortgage | 0.999 | 0.457,2.182 | −0.004 | 0.997 | |
| Rent (including rents paid by housing benefit) | 1.129 | 0.892,1.430 | 1.010 | 0.313 | |
| Living here rent free | 2.355 | 0.988,5.613 | 1.932 | 0.053 | |
| No cars available in household | One | 0.928 | 0.703,1.225 | −0.528 | 0.598 |
| Two | 0.861 | 0.631,1.174 | −0.947 | 0.344 | |
| Three or more | 0.941 | 0.606,1.462 | −0.270 | 0.787 | |
| Non‐drinker | Moderate (men, <22 units; women, <15 units) | 0.762 | 0.597,0.974 | −2.173 | 0.030 |
| Hazardous (men, 22–50 units; women, 15–35 units) | 0.704 | 0.514,0.966 | −2.176 | 0.030 | |
| Harmful (men, >50 units; women, >35 units) | 1.270 | 0.855,1.886 | 1.186 | 0.236 | |
| Never smoked cigarettes at all | Used to smoke cigarettes occasionally | 1.337 | 0.951,1.879 | 1.673 | 0.094 |
| Used to smoke cigarettes regularly | 1.440 | 1.182,1.756 | 3.612 | <0.001 | |
| Current cigarette smoker | 1.522 | 1.180,1.963 | 3.230 | 0.001 | |
| Never exposed to tobacco smoke | Exposed | 0.947 | 0.728,1.231 | −0.408 | 0.683 |
| Has high blood pressure (hypertension) | Does not have high blood pressure (hypertension) | 0.912 | 0.755,1.102 | −0.954 | 0.340 |
| Has diabetes | Does not have diabetes | 1.378 | 1.001,1.897 | 1.967 | 0.049 |
| Limiting long‐lasting illness | Non‐limiting long‐lasting illness | ||||
| No limiting long‐lasting illness | |||||
| Married/civil partnership | Living as married | 0.973 | 0.777,1.218 | −0.239 | 0.811 |
| Small family: 2 adults of any age and 1 or 2 children | Older small family: 1 or more adults aged 65+ years and 1 or 2 children | 0.635 | 0.364,1.107 | −1.602 | 0.109 |
| Large adult: 3+ adults, no children | 1.196 | 0.880,1.627 | 1.144 | 0.253 | |
| Small adult: 2 adults under 65 and no children | 1.342 | 1.035,1.742 | 2.216 | 0.027 | |
| Large family: 2 adults of any age and 3+ children or 3+ adults and 1+ children | 1.002 | 0.732,1.371 | 0.013 | 0.990 | |
| Least deprived | 2nd | 1.252 | 0.959,1.634 | 1.655 | 0.098 |
| 3rd | 1.002 | 0.756,1.328 | 0.013 | 0.990 | |
| 4th | 1.142 | 0.856,1.524 | 0.902 | 0.367 | |
| Most deprived | 1.046 | 0.763,1.435 | 0.281 | 0.779 | |
| Urban | Town/Fringe/Village, hamlet and isolated dwellings | 1.061 | 0.855,1.316 | 0.535 | 0.592 |
| North East | North West | 1.236 | 0.829,1.843 | 1.041 | 0.298 |
| Yorkshire and the Humber | 1.306 | 0.872,1.955 | 1.296 | 0.195 | |
| East Midlands | 1.263 | 0.835,1.911 | 1.105 | 0.269 | |
| West Midlands | 1.206 | 0.799,1.821 | 0.893 | 0.372 | |
| East of England | 1.514 | 1.030,2.226 | 2.110 | 0.035 | |
| London | 0.825 | 0.491,1.386 | −0.725 | 0.468 | |
| South East | 1.241 | 0.845,1.822 | 1.100 | 0.271 | |
| South West | 1.433 | 0.951,2.161 | 1.721 | 0.085 | |
| Scotland | 1.162 | 0.830,1.628 | 0.875 | 0.382 | |
| General health very good/good | Fair | 1.43 | 1.110,1.842 | 2.772 | 0.006 |
| Bad/Very bad | 1.73 | 1.350,2.216 | 4.335 | <0.001 | |
| Survey year (2012) | 2015 | 1.905 | 1.489,2.436 | 5.133 | <0.001 |
| 2016 | 3.957 | 3.253,4.814 | 13.755 | <0.001 | |
| 2017/8 | 5.894 | 4.532,7.666 | 13.23 | <0.001 | |
| Constant | 0.006 | 0.002,0.018 | −9.663 | <0.001 | |
| Base (unweighted) | 20 082 |
- —National Institute for Health and Care Research
Peer Reviews
No public reviews on file for this paper yet. If you reviewed it on a platform where reviews are public (OpenReview, ICLR, NeurIPS, ICML), you can paste yours below so the community can read it here.
Videos
No videos yet. Explain this paper in a talk, walkthrough, or lecture? Add one.
Taxonomy
TopicsGambling Behavior and Treatments · Homelessness and Social Issues · Health disparities and outcomes
INTRODUCTION
Gambling harms are the negative consequences of gambling, impacting not only on the individual who gambles but also their close contacts, community and the wider population. These harms impact on a range of connected areas, including finances, health, emotional wellbeing, personal relationships, work and study, and can lead to criminal activity and suicidality [1].
For every person experiencing problem gambling it is estimated that an average of six others are indirectly affected, such as partners, children, parents, friends or colleagues [2]. These close contacts experience a wide range of harms, as evidenced by a growing international body of work. Several studies have found close contacts of those experiencing problem gambling are more likely to experience relationship conflict, financial problems, poorer physical and mental wellbeing, emotional distress and higher levels of risky alcohol use, associated with their close contact’s gambling [3, 4, 5, 6]. These harms include physical and mental health problems linked to sustained mental distress [7, 8, 9]. Harms have been shown to compound each other in damaging ways [10, 11]. Negative impacts can be ongoing and can remain a year on [12].
The type of relationship between those gambling and others has consequences for the risk of harm. Those living in the closest proximity to the individual affected by problem gambling, who are closer emotionally, financially and physically, experience the greatest harms [13, 14]. Partners and ex‐partners of those who experience problem gambling are more likely to report stress‐related health problems than other close contacts [15, 16]. It is often the spouse or cohabiting partner of the individual experiencing disordered gambling who is most likely to seek support [17].
To date, much of the evidence has focused on the impact of problem or disordered gambling on close contacts. The evidence base considering how those experiencing lower level harms might also impact on those close to them is nascent. However, there is a wider acceptance that harms do not only impact a small number of disordered individuals but also impact those who are sub‐threshold for the experience of gambling disorder [6], with gambling harms viewed as existing upon a spectrum of risk severity [18]. Evidence suggests that those from sub‐threshold groups contribute a greater burden of harms than those experiencing gambling disorder because of the larger population numbers [19, 20]. To date, only a handful of studies have examined the health and wellbeing of close contacts of people who gambled across the spectrum of risk. In 2023, Tulloch et al. found financial harms occurred for close contacts of those experiencing both moderate‐ and high‐risk gambling, whilst lower wellbeing, social harms and poorer health were more strongly associated with close contacts of those experiencing higher gambling harms [21]. A qualitative study looking at the impact of harms on close contacts also showed that harms could occur across the risk spectrum, also showing that the impact of a close contact’s gambling varied by the closeness of the relationship, the inter‐dependence of the two people’s lives and the close contact’s level of social support [22]. Our objectives were to conduct exploratory secondary analysis of English and Scottish data to identify whether there were detriments to the emotional health of people whose spouses and cohabiting partners have elevated Problem Gambling Severity Index (PGSI) scores, investigating the impact across the full PGSI spectrum.
METHODS
Design
The Health Survey for England (HSE) [23] and Scottish Health Survey (SHeS) [24] are both annual, large‐scale, random probability surveys designed to monitor trends in their respective nation’s health. All adults residing within the household are eligible to take part. Both studies include a self‐completion element where participants aged 16 years and over are asked a series of more sensitive questions, including self‐reported mental health, emotional wellbeing and gambling, including the PGSI.
The HSE and SHeS data from 2012, 2015, 2016, 2017 (SHeS only) and 2018 (HSE only) were combined (each year of data appended) to create a single data set of individuals aged 16 years or over that covered both England and Scotland (n = 50 346). The HSE data for 2015, 2016 and 2018 were obtained under special licence to enable household identifiers to be accessed. The other survey year data sets already include household indicators within their standard access arrangements. In addition to household identifiers, the data included information on the relationships of each household member to all others. The combined data set was weighted to be representative of adults aged 16 years and over living in England and Scotland (for details, see Appendix S1).
These data were used to identify households containing married or cohabiting couples where both partners had participated in the survey and completed the PGSI. These data contained 20 752 individuals in 10 376 couples. From these, 20 091 individuals were selected for analysis. These were individuals with a PGSI score of zero but whose partner’s PGSI scores ranged from 0 to 27. The remaining cases (661 individuals whose own PGSI score was greater than zero) were excluded from the analysis. This was done to reduce the risk of the individual’s own PGSI score confounding the results when examining the impact of the partner’s PGSI on the individual’s wellbeing.
It should be noted that there is correlation between the PGSI scores of individuals and the PGSI scores of their spouses and cohabiting partners. The 661 individuals that were excluded had partners whose PGSI scores were also higher; the mean partner PGSI score of this group was 0.366 (SD = 1.487). Analysis of this group was deemed outside the scope of this specific article but is noted for further investigation. A decision was made to focus on individuals whose own PGSI was zero.
Outcomes
The outcome measures used in the study were four self‐reported measures of mental health and wellbeing:
- A dichotomous variable indicating the presence of a long‐term mental health condition (5.13%, 95% CI = 4.75%–5.54%). Participants were asked whether they had any physical or mental health conditions or illness that had lasted or was expected to last 12 months or more, and if so to specify up to six conditions. Responses were used to generate a dichotomous variable. This measure was included on both HSE and SHeS for all survey years.
- The 14‐item Warwick–Edinburgh Mental Wellbeing Scale (WEMWBS), an indicator of probable depression, was included within the self‐completion questionnaire. This validated scale [25] asks participants 14 questions about their feelings and thoughts over the previous 2 weeks, with responses scored from 1 to 5. These scores are then combined to create an overall scale, ranging from 14 to 70 (mean = 51.98, SD = 8.21). Lower scores reflect a higher likelihood of experiencing depression. WEMWBS was not available for HSE 2018.
- The 12‐item General Health Questionnaire (GHQ‐12) is a validated measure of emotional distress [26]. Included within the self‐completion questionnaire, the GHQ‐12 comprises 12 questions that ask participants how often over the previous 4 weeks they have experienced behaviours that may be symptoms of mental distress. Responses to each of the 12 items were given a score between 0 and 3, where ‘More so than usual’ = 0, ‘About the same as usual’ = 1, ‘Less so than usual’ = 2 and ‘Much less than usual’ = 3. These scores were then summed to give an overall score ranging from 0 to 36 (mean = 10.65, SD = 4.73). This scoring approach has been used widely, giving a wider and smoother scoring approach appropriate for population‐based analyses. GHQ‐12 was not included in HSE 2015.
- A measure of life satisfaction was included in the SHeS main questionnaire and the HSE self‐completion questionnaire. Participants were asked to rate their current overall satisfaction with life on a scale of 0 to 10, where 0 is ‘not at all satisfied’ and 10 is ‘completely satisfied’ (mean = 7.75, SD = 1.79). The life satisfaction score was not included in HSE 2012 or 2015.
Where data were not available for a survey year, that survey year was excluded from the analysis.
Exposure
Gambling harms for both the participant and their partner were measured using the PGSI [27]. This a validated tool for the identification of gambling harms that was asked of anyone who had gambled in the past year within the self‐completion questionnaire. The PGSI comprises nine questions that are combined to produce a score ranging from 0 to 27. All participants have PGSI = 0; the mean PGSI for their partners is 0.088 (SD = 0.794, α = 0.91).
Controls
The individual’s gambling participation and a range of socio‐demographic characteristics were included as control variables. Gambling participation was measured as whether the individual had spent money on gambling in the past 12 months (60.77%, 95% CI = 59.82%–61.72%).
The remaining control measures were sex, age (grouped into 10‐year bands), ethnicity (coded as white or other, because of the small base sizes), religion (coded as no religion, Christian or other), the individual’s weekly alcohol consumption [non‐drinker; moderate (men, <22 units/women, <15 units); hazardous (men, 22–50 units/women, 15–35 units); harmful (men, 50+ units/women, 35+ units)], smoking status [never; ex‐smoker (occasional); ex‐smoker (regular); current smoker], passive smoking exposure (yes/no), the individual’s economic activity (full/part‐time employment; education; training), their highest educational qualification (degree or higher; A‐levels or equivalent; GCSEs or equivalent; other; none), their National Statistics Socio‐economic Classification (NS‐SEC, five groups, missing data are included as a separate category), equivalised household income (five groups based on quintiles, with missing data included as a separate category), tenure, number of cars in the household, whether the couple were married or cohabiting and household type (based on household size and presence of children aged 0–15 years in the household). Local deprivation was measured using English and Scottish Indices of Multiple Deprivation (IMD) scores, matched at the ‘Output Area’ and quintiled for analysis; urbanicity was measured using the Office for National Statistics (ONS) urban–rural classification and grouped into urban/other. Region of residence was based on government region, with Scotland included as a separate region. Finally, survey year was also included as a control variable. Details about missing values are given in Appendix S2.
Analyses
The estimates presented in all tables are based on weighted data with true (unweighted) bases included. All analyses were carried out in Stata 18 (StataCorp LLC, College Station, TX, USA) using the ‘svy’ suite of commands to account for weights, stratification and the clustering of responses within couples. The cluster variable was an anonymised household indicator, the stratification variable was based on the main regional stratifier used in each survey (Strategic Health Area/Region in HSE; Scottish Health Board in SHeS), split by survey year. More details are available in Appendix S1.
Bivariate descriptive statistics were used to review the demographic characteristics of the 20 091 sample members, comparing mean partner PGSI scores across different characteristics. This standardised set of characteristics were used as control variables in the full models.
Correlation coefficients and scatter plots were used to look at the bivariate associations between the individual’s emotional wellbeing scores and their partner’s PGSI score. The scatter plots are overlaid with a linear fitted line to show the underlying trend. Mean partner PGSI is shown for individuals with and without a long‐term mental health condition, and this is also shown as a bar chart.
The impact of increasing partner PGSI score on an individual’s emotional wellbeing was explored using a series of regression models. Each regression model used a different health measure as an outcome and the partner’s continuous PGSI scores as a predictor. Different regression models were required for different wellbeing measures. The presence of a long‐term mental health condition was a binary outcome and hence a logistic regression model was used, with the results reported as odds ratios (ORs). The three scale measures of emotional wellbeing – WEMWBS, Likert GHQ‐12 and life satisfaction – were modelled using linear regression, with coefficients reported.
To aid interpretation, both the WEMWBS and the life satisfaction scores were reverse‐coded so that a higher score indicated lower levels of emotional wellbeing or life satisfaction. All three wellbeing variables were standardised to give a mean of zero and standard deviation of one, again, to aid interpretation. Partner PGSI was entered into each regression as a continuous variable, rather than a banded variable, as the aim was to treat PGSI as a continuum.
As the regressions were run on the sub‐sample of individuals who had a PGSI score of zero, they investigate the relationship between partner PGSI and mental health and wellbeing outcomes for individuals who themselves are deemed not to be at risk from gambling harms. Two regressions were run for each outcome to get unadjusted and adjusted results. The second regression model contained a standardised set of controls.
The diagnostics for each model were checked. Those for the GHQ‐12 linear regression model suggested the normality assumption did not fully hold, suggesting a different approach to the modelling may have been more suitable. To test this, the GHQ‐12 analysis was repeated using Poisson regression and using the original, unstandardised GHQ‐12 Likert scale as the outcome variable. More details are given in Appendix S3. The results corroborate the associations indicated by the linear regression model presented in this paper and are given in Appendix S3: Table S3.1. Additionally, a set of E‐values were generated to explore the strength of existing associations against unmeasured confounders, these are described in Appendix S4 and presented in Tables S4.1 and S4.2. A full STROBE checklist is given in Appendix S5.
Ethics
This study was approved by the University of Glasgow Research Ethics System (application number 400230254; project title ‘Exploring gambling harms: secondary analysis of survey data’; College of Social Sciences committee).
RESULTS
Table 1 presents the socio‐demographic characteristics of the individuals (n = 20 091). Individuals who were female, younger, cohabiting rather than married, had children aged 0–15 years in the household and lived in in the most deprived area quintile had partners with higher mean PGSI scores.
Table 2 shows the PGSI scores for the partners of the sample members (the individuals whose own PGSI scores were equal to zero). The partners of the sample members had a mean PGSI score of 0.088 (SD = 0.794).
Table 3a shows the correlation between three emotional wellbeing indicators for the individuals and their partner’s PGSI scores. As their partner’s PGSI score increases, the individual’s scores on each measure worsen. This pattern can also be seen in the scatter plots in Figure 1. The plots use the reverse‐coded WEMWBS and life satisfaction scores, with increasing trend lines indicating a decline in wellbeing as the partner PGSI score increases.
PGSI and four measures of an individual’s emotional wellbeing. GHQ‐12, 12‐item General Health Questionnaire; PGSI, Problem Gambling Severity Index; WEMWBS, Warwick Edinburgh Mental Health and Wellbeing Scale.
Table 3b shows individuals with and without a long‐term mental health condition and their partner’s mean PGSI score. Individuals with a long‐term mental health condition have partners with a higher mean PGSI score than individuals who have no long‐term mental health condition (see Figure 1).
The unadjusted regression models show statistically significant associations between the full range of partner PGSI scores and each measure of emotional wellbeing: WEMWBS (P <0.001, coef. = 0.036; 95% CI = 0.017–0.055), GHQ‐12 Likert scale (P = 0.001, coef. = 0.039, 95% CI = 0.015–0.062) and life satisfaction (P = 0.002, coef. = 0.053, 95% CI = 0.020–0.086). In each instance, there is an association between individuals having poorer wellbeing outcomes and their partner having an elevated PGSI score. The adjusted regression models show that the association remains significant and in the same direction after controls were added: WEMWBS (P = 0.018, coef. = 0.022, 95% CI = 0.004–0.040), GHQ‐12 Likert scale (P = 0.048, coef. = 0.021, 95% CI = 0.000–0.043) and life satisfaction (P = 0.036, coef. = 0.036, 95% CI = 0.005–0.067).
As the analysis used standardised emotional wellbeing scores with a mean of zero and a standard deviation of one, the size of the coefficients from each model could be compared. The coefficients for life satisfaction were larger than the coefficients for WEMWBS and GHQ‐12, implying that the impact of partner PGSI was greatest on life satisfaction. Tables 4a, 4b, 4c, 4d show the output for the full models that include the control variables.
The mean partner PGSI for people with a long‐term mental health condition was 0.152 (SD = 0.995), higher than the respective mean for people without a mental health condition (mean = 0.085, SD = 0.781). The unadjusted regression models indicated that this difference was statistically significant (P = 0.004, OR = 1.071, 95% CI = 1.021–1.122); however, the association in the adjusted regression models is not statistically significant (P = 0.442, OR = 1.023, 95% CI = 0.965–1.086).
DISCUSSION
This analysis looked at the impact of a spouse or cohabiting partner’s PGSI score on a set of four emotional and mental health measures for individuals whose own PGSI score was equal to zero, and who were therefore considered to be at low risk of harm from their own gambling.
It showed that there was an association between increases in their partner’s PGSI score and declining levels of their own emotional wellbeing, measured by WEMWBS, GHQ‐12 and life satisfaction score. This association remained after controls were included in the model, suggesting it is not explained by underlying differences in the socio‐demographics of different sets of spouses. This finding reflects wider evidence of the impact of a partner’s gambling on the emotional wellbeing of others [28].
This analysis adds substantially to the existing evidence base, demonstrating an association between detriments to the mental health and wellbeing of individuals and any elevation of PGSI score among their partners. The models show that any increase in partner PGSI score impacts on emotional wellbeing. Previous research has focused on the impact of disordered gambling on the wellbeing of close contacts. More recent studies have looked at the fuller range of risk and found evidence of a link between a close contact’s lower risk gambling and others experiencing financial harms, but not health, wellbeing or social harms. This analysis shows there is an association between an individual’s own emotional health and their partner’s gambling for those of any risk designation. Whilst there is a growing literature looking at PGSI as a spectrum of harms for the individual, this study adds to the sparser body of evidence for associated harms to close contacts.
Whilst for WEMWBS, GHQ‐12 and life satisfaction the association remained significant when accounting for a range of socio‐demographic, economic and lifestyle factors, there is no clear evidence of an association between a partner’s PGSI score and the presence of a long‐term mental health condition once the controls were included in the model. In addition to these controls accounting for this association, it should be noted that this dichotomous question, unlike the other measures, does not measure severity and can encompass a range of conditions, which may influence the results. Additionally, the question covers a 12‐month period, unlike the emotional wellbeing measures, which are answered in respect to last 2 weeks (WEMWBS) or the last 4 weeks (GHQ‐12). Thus, our analyses appear to identify associations between immediate emotional impact and partner PGSI scores but not the impact on long‐term mental health. This, in turn, may be because most of the sample had lower PGSI scores, and a crisis point might need to be reached before the gambling behaviour makes an impact on longer term mental health.
There are some limitations to this study. The data are cross‐sectional with attendant issues for causal inference; it may be that having a spouse or partner with poor emotional wellbeing increases the likelihood of harmful gambling behaviour. The analysis uses secondary data, which limits the pool of control variables available. There may be other factors that would explain the association that are not included in the data set and remain as unmeasured confounding factors, such as the quality of the partner relationship, the extent of additional social structures or the number of years impacted by gambling harms. The analysis focuses on partners, driven by a desire to focus on a specific relationship and sample size. Partners are more likely to be impacted and these findings cannot be extrapolated to other relationships. Nevertheless, partners are important for this very reason; they are more likely to have shared finances and shared dependents that leave them vulnerable to harms, and it is important that this risk is understood. Despite combining years of survey data and focusing on a more common relationship type, the sample sizes available for the analysis are still relatively small: around 3% of the individuals had partners with PGSI scores greater than zero. Finally, some of the outcomes were missing in some survey years, reducing the sample size for these measures. There is a small risk of bias, mitigated by the weighting design and by including the survey year as a covariate.
CONCLUSION
To date, gambling policy has tended to focus on those experiencing gambling disorder and the attendant societal impacts from this group. Our analysis demonstrates that decrements to an individual’s emotional wellbeing are strongly associated with the presence of a spouse or cohabiting partner with increased PGSI scores, with emotional wellbeing declining as their partner’s PGSI score increases. Consideration of the wider impacts of gambling at sub‐clinical levels is needed.
AUTHOR CONTRIBUTIONS
Sarah Tipping: Conceptualization (equal); data curation (lead); formal analysis (lead); investigation (lead); methodology (lead); project administration (lead); software (lead); validation (equal); writing—original draft (lead); writing—review and editing (equal). Heather Wardle: Conceptualization (equal); funding acquisition (lead); methodology (supporting); project administration (supporting); supervision (lead); validation (equal); writing—original draft (supporting); writing—review and editing (equal). Robert Pryce: Methodology (supporting); supervision (supporting); validation (equal); writing—review and editing (supporting).
DECLARATION OF INTERESTS
In the last 3 years, H.W. discloses grant funding for gambling‐related research by the Economic and Social Research Council; National Institute for Health Research; Wellcome Trust; the Gambling Commission (including their regulatory settlement fund); the Office of Health Disparities and Improvements; Public Health England; Greater London Authority; Greater Manchester Combined Authority; Blackburn with Darwen Local Authority; and the Department of Digital Culture Media and Sport. H.W. declares consulting fees from the Institute of Public Health, Ireland, and the National Institute for Economic and Social Research. H.W. also declares payment for the delivery of seminars from McGill University, the University of Birmingham, John Hopkins University and from the British Broadcasting Corporation. H.W. has been paid as an expert witness by Lambeth and Middlesborough Borough Councils. H.W. also declares travel costs paid by Gambling Regulators European Forum, the Turkish Green Crescent Society, Alberta Gambling Research Institute, the REITOX Academy (administered through the Austrian National Public Health Institute) and the University of Helsinki. H.W. served as Deputy Chair of the Advisory Board for Safer Gambling between 2015 and 2020, remunerated by the Gambling Commission, is a Member of the World Health Organization (WHO) panel on gambling (ongoing) and has provided unpaid advice on research to GamCare for their Safer Gambling Standard (until mid‐2021). H.W. runs a research consultancy for public and third‐sector bodies only. She has not, and does not, provide consultancy services to gambling industry actors. In researching the gambling industry and their practices, H.W. declares occasional attendance at events where gambling industry actors are present (including industry‐sponsored conferences).
In the last 3 years, S.T. declares funding for gambling projects from the National Institute of Health Research and the Gambling Commission.
As part of their work on the Gambling Survey for Great Britain (GSGB), H.W. and S.T. are required by the Gambling Commission (the funder) to participate in events disseminating research findings to their stakeholders, which includes the industry. Their attendance at events where industry is present is independently funded and does not involve collaborations or partnerships with industry.
P.R. has no declarations.
Supporting information
Appendix S1: Combining data from the Health Survey for England (HSE) and Scottish Health Survey (SHeS): A technical note.
Appendix S2: Treatment of missing values.
Appendix S3: Supplementary results from Poisson analysis of GHQ‐12 Table S3.1: Unadjusted and adjusted regression output: GHQ‐12.
Appendix S4: E‐values for Partner PGSI. Table S4.1: E‐values for partner PGSI (continuous outcomes). Table S4.2: E‐values for partner PGSI (binary outcome).
Appendix S5: STROBE Statement—Checklist of items that should be included in reports of cohort studies.
The reference list from the paper itself. Each links out to its DOI / PubMed record.
- 1Langham E , Thorne H , Browne M , Donaldson P , Rose J , Rockloff M . Understanding gambling related harm: A proposed definition, conceptual framework, and taxonomy of harms. BMC Public Health. 2016;16(1):80. 10.1186/s 12889-016-2747-0 26818137 PMC 4728872 · doi ↗ · pubmed ↗
- 2Goodwin BC , Browne M , Rockloff M , Rose J . A typical problem gambler affects six others. Int Gambl Stud. 2017;17(2):276–289. 10.1080/14459795.2017.1331252 · doi ↗
- 3Wenzel HG , Øren A , Bakken IJ . Gambling problems in the family – A stratified probability sample study of prevalence and reported consequences. BMC Public Health. 2008;8:412. 10.1186/1471-2458-8-412 19087339 PMC 2625355 · doi ↗ · pubmed ↗
- 4Salonen AH , Alho H , Castrén S . The extent and type of gambling harms for concerned significant others: A cross‐sectional population study in Finland. Scand J Public Health. 2016;44(8):799–804. 10.1177/1403494816673529 28929933 · doi ↗ · pubmed ↗
- 5Li E , Browne M , Rawat V , Langham E , Rockloff M . Breaking bad: Comparing gambling harms among gamblers and affected others. J Gambl Stud. 2017;33(1):223–248. 10.1007/s 10899-016-9632-8 27443306 · doi ↗ · pubmed ↗
- 6Wardle H , Ridout K , Tipping S , Wilson H , Maxineanu I , Hill S . Gambling Survey for Great Britain ‐ Annual report (2023): Official statistics. 2024.
- 7Dowling NA , Hawker CO , Merkouris SS , Rodda SN , Hodgins DC . Addressing gambling harm to affected others: A scoping review Melbourne, Australia: Victorian Responsible Gambling Foundation; 2021.
- 8Riley BJ , Harvey P , Crisp BR , Battersby M , Lawn S . Gambling‐related harm as reported by concerned significant others: A systematic review and meta‐synthesis of empirical studies. J Fam Stud. 2018;27(1):112–130. 10.1080/13229400.2018.1513856 · doi ↗