Relationship between areal BMD, FRAX®, and femoral strength in community-dwelling older Asian adults
Dheeraj Jha, Manju Chandran, Dario Koller, Vee San Cheong, Anitha D. Praveen, Alexander Baker, Preeti Gupta, Ecosse L. Lamoureux, Halldór Pálsson, Stephen J. Ferguson, Benedikt Helgason

TL;DR
This study shows that combining bone density, fracture risk scores, and femoral strength improves hip fracture risk assessment in older Asian adults.
Contribution
The study demonstrates that integrating FRAX-HFP and femoral strength with aBMD enhances fracture risk identification in multi-ethnic populations.
Findings
Chinese ethnicity showed higher fracture risk compared to Indian and Malay populations.
FRAX-HFP and femoral strength identified different individuals at risk, suggesting complementary use.
Combining FRAX-HFP and femoral strength with aBMD improves hip fracture risk assessment.
Abstract
T-scores alone are inadequate for identifying hip fracture risk. Incorporating FRAX-HFP scores and femoral strength improves risk assessment. Tailored interventions are needed for different ethnicities, with a focus on females due to higher fracture risk. Sex-specific thresholds and targeted prevention strategies are essential for effective fracture prevention. We investigated the age-related trajectories of areal bone mineral density (aBMD), fracture risk assessment tool (FRAX)–based 10-year probability of hip fracture (FRAX-HFP), trochanteric soft tissue thickness (TSTT), and femoral strength in a multi-ethnic cohort of community-dwelling older adults in Singapore. We also examined the relationship between FRAX-HFP and femoral strength. Dual-energy X-ray absorptiometry (DXA) scans were conducted for Singaporean older adults (n = 2235), enrolled in the Population Health and Eye…
Genes, proteins, chemicals, diseases, species, mutations and cell lines named across the full text — each resolved to its canonical identifier and authoritative record.
Click any figure to enlarge with its caption.
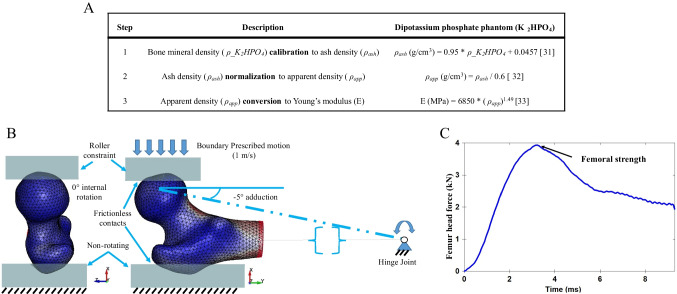 Figure 1
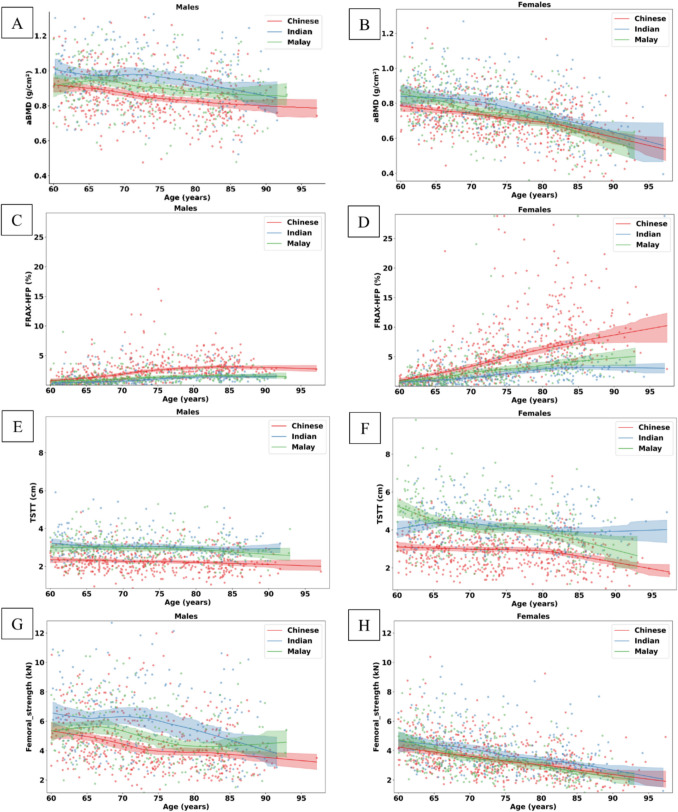 Figure 2
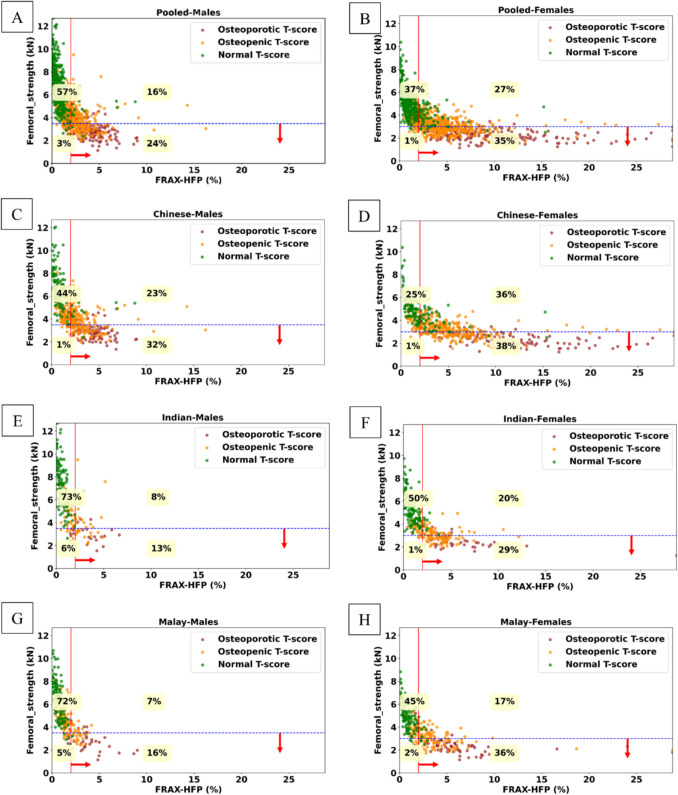 Figure 3
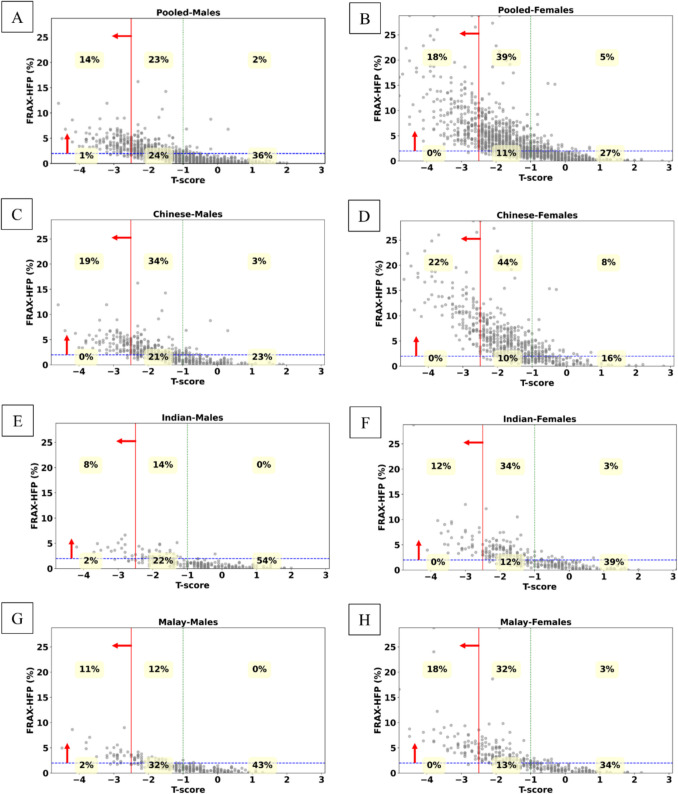 Figure 4
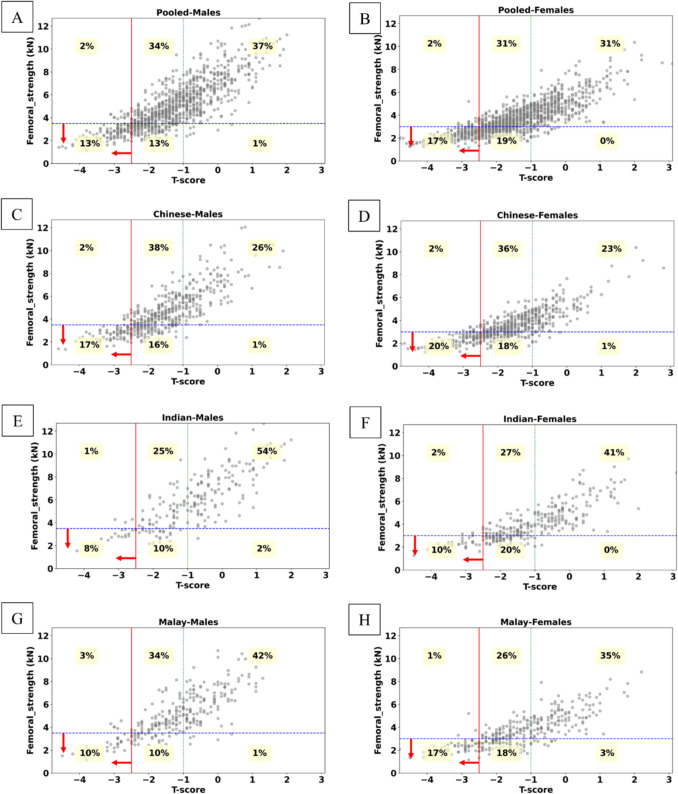 Figure 5
- —http://dx.doi.org/10.13039/501100001381National Research Foundation Singapore
- —Swiss Federal Institute of Technology Zurich
Peer Reviews
No public reviews on file for this paper yet. If you reviewed it on a platform where reviews are public (OpenReview, ICLR, NeurIPS, ICML), you can paste yours below so the community can read it here.
Videos
No videos yet. Explain this paper in a talk, walkthrough, or lecture? Add one.
Taxonomy
TopicsBone health and osteoporosis research · Hip and Femur Fractures · Nutrition and Health in Aging
Introduction
Osteoporosis is a chronic condition leading to a weakened bone structure due to loss of bone mass and deterioration in trabecular structural arrangement. This results in greater bone fragility and a higher risk of hip fractures with age [1]. Following a hip fracture, patients experience a 3-month long decline in physical, mental, and emotional function leading to disability in about 40% of cases [2]. When compared to an age-matched control group, the annual mortality rate of hip fracture patients was higher by 8% for females and 18% for males [3]. The current clinical standard for the diagnosis of osteoporosis is to use areal bone mineral density (aBMD) obtained from dual-energy X-ray absorptiometry (DXA) scans. The DXA scan-based T-score defines how much bone mass differs from the bone mass of an average healthy 25–30-year-old adult. However, 28–61% of hip incident fractures have been reported to occur in individuals with an aBMD measurement higher than the threshold defined for osteoporosis, which is a T-score of − 2.5 [4–6]. Thus, stratifying fracture risk based on aBMD alone lacks sensitivity for clearly identifying individuals at risk. The Fracture Risk Assessment Tool (FRAX) (https://frax.shef.ac.uk/FRAX/) is a calculator used for predicting the 10-year probability of a hip fracture or other major osteoporotic fracture considering 12 risk factors including aBMD. FRAX scores are tailored to specific countries and, in some instances, ethnic groups. For example, in China (including Hong Kong), Malaysia (with distinctions for Chinese, Bhumiputera, and Indian), Singapore (Chinese, Malay, Indian), South Africa (African, Colored, Indian, White), and the USA (Caucasian, Black, Hispanic, Asian), ethnic variations are considered. However, some evidence suggests that FRAX may not perform as well in Asian populations, compared to Caucasian populations [7, 8].
In addition to bone mass, bone shape, size, and bone material properties contribute to resistance to fracture [9]. Femoral strength predicted from image-based subject-specific finite element models (FEMs) has been studied in the past to evaluate bone’s resistance to fracture [10–17]. The early studies in this field seemed to suggest no improvement in using femoral strength for stratifying hip fracture risk compared to aBMD, but more recent research has shown FEMs to be more effective than aBMD [11, 16, 17], even demonstrating consistent superiority over 16 years of follow-up [17]. Prior studies were limited by small sample sizes, study designs, and short follow-up durations. However, advances in computational efficiency, automation, and modeling technologies now make large-scale analysis of femoral strength possible. Despite this, CT scans are associated with high radiation and cost and are not systematically used for primary screening for osteoporosis [18]. In parallel, 2D-3D registration techniques to build 3D FEMs of the proximal femur from lower radiation dose DXA scan have been developed [19, 20]. Two studies on Caucasian participants found that bone strength estimated from DXA-based finite element models (FEMs) had superior ability to distinguish individuals with hip fractures compared to aBMD [21, 22]. However, further validation with a larger, more diverse sample, including individuals from various ethnicities, is needed. The 2D-3D registration process is now available in a commercial software (3D-SHAPER®, Galgo Medical), which is increasingly being utilized in clinical practice [23]. Additionally, studies have been published where the software’s output has been employed to develop FEMs [24, 25].
In Asia, the number of hip fractures is estimated to rise from 1.12 to 2.56 million between 2018 and 2050, leading to an increase in the annual direct cost of hip fracture from USD 9.5 to 15 billion [26]. By the year 2050, more than half of the hip fractures are expected to occur in Asia [26]. Interestingly, Singapore has a high incidence rate of hip fractures, similar to that seen in Nordic countries in Europe. The standardized incidence rates per 100,000 population for individuals over 50 years old are 314.2 in Singapore, 189.5 in South Korea, 315.9 in Denmark, 226.5 in Finland, and 134 in the UK [27]. In our previous study involving 275 older adults, we found that trochanteric soft tissue thickness (TSTT) could partially explain the differences in fracture rates among various ethnic groups in Singapore [Jha et. al, Clin. Biomech. Under review]. How differences in femoral strength could inform on variations in hip fracture risk in older adults in Singapore across different ethnic groups is not known. Whether femoral strength, TSTT, FRAX-HFP, and aBMD identify the same or different individuals at risk for hip fractures is also not clear. Therefore, the primary aim of this study is to investigate the age-related trajectories (patterns or trends over time as people age) of aBMD, FRAX-HFP, TSTT, and femoral strength in a diverse, multi-ethnic cohort of community-dwelling older adults in Singapore. A secondary aim is to examine the relationships that femoral strength and FRAX-HFP have with T-scores to provide insight into whether the stratification using these biomarkers overlaps or whether a potential synergistic effect exists between them.
Materials and methods
Study cohort
The study involved 2643 older adults from the Population Health and Eye Disease Profile in Elderly Singaporeans (PIONEER) cohort [28], which includes community-dwelling Singaporeans aged 60 and above. Data collection took place from 2017 to 2022; the study was approved by the SingHealth Centralized Institutional Review Board (2016/3089). Subjects were included if their DXA scans and FRAX-HFP scores were available, resulting in a final sample of 2235 subjects. Demographic information collected included age, gender, height, weight, and ethnicity.
aBMD measurements
Subjects underwent DXA scans, using the Hologic® Horizon W scanner (Hologic, Inc., Marlborough, MA, USA), of the proximal femur and whole body while lying in a supine position with their legs rotated inward at a 25° angle, as recommended by the manufacturer. This positioning is required to bring the femoral neck axis parallel to the plane of the scan table. Each scan was visually inspected for artifacts. The aBMD at the total hip and the T-score were retrieved from the scanning reports provided by the scanner software.
FRAX-HFP calculations
FRAX-HFP scores, reflecting predicted 10-year probability of a hip fracture, were calculated based on 12 clinical risk factors for each subject (https://frax.shef.ac.uk/FRAX/). The clinical risk factors include age, gender, weight, height, history of fractures, having a parent with a hip fracture, current smoking, glucocorticoid use, rheumatoid arthritis, secondary osteoporosis, alcohol consumption, and aBMD.
TSTT calculations
Standing trochanteric soft tissue thickness (TSTT) from supine whole-body DXA images was estimated using a prediction equation developed in a previous study [Jha et. al, Clin. Biomech. Under review]. Supine TSTT (TSTT_SUP_) measures are used as input in the gender and ethnic (Malay, Indian, and Chinese) specific equations (Eq. 1). These TSTT_SUP_ values were derived using a Python (v3.9) pipeline that processes the subject’s whole-body DXA image, utilizing the open-source Python package OpenCV (v4.6.0.66).
\documentclass[12pt]{minimal} \usepackage{amsmath} \usepackage{wasysym} \usepackage{amsfonts} \usepackage{amssymb} \usepackage{amsbsy} \usepackage{mathrsfs} \usepackage{upgreek} \setlength{\oddsidemargin}{-69pt} \begin{document}$${\varvec{T}}{\varvec{S}}{\varvec{T}}{\varvec{T}} = {\varvec{S}}{\varvec{l}}{\varvec{o}}{\varvec{p}}{\varvec{e}} *{{\varvec{T}}{\varvec{S}}{\varvec{T}}{\varvec{T}}}_{{\varvec{S}}{\varvec{U}}{\varvec{P}}}+{\varvec{I}}{\varvec{n}}{\varvec{t}}{\varvec{e}}{\varvec{r}}{\varvec{c}}{\varvec{e}}{\varvec{p}}{\varvec{t}}$$\end{document}TSTT average trochanteric soft tissue thickness in standing position, cmTSTT_SUP_average trochanteric soft tissue thickness in supine position, cmSlopeChinese (males, 0.63; females, 0.59), Indian (males, 0.54; females, 0.51), Malay (males, 0.53; females, 0.62) InterceptChinese (males, 3.12 cm; females, 2.29 cm), Indian (males, 10.54 cm; females, 12.26 cm), Malay (males, 8.94 cm; females, 6.23 cm)
Femoral strength calculations
The 3D volume and outer surface of the proximal femur from DXA scans were generated using 3D-SHAPER® (v2.11.1) software from the 2D DXA image [23]. The volume and bone mineral density obtained from the 3D-SHAPER® were adjusted by a post-processing algorithm to take into account an underestimation in femoral strength that can occur when converting the 2D images into 3D models. After post-processing of the 3D-SHAPER output, the 3D femur model was divided into mesh elements to create a detailed representation of the femur structure. Each element of the mesh is a 10-node tetrahedron with the target size for each element being 3 mm, ensuring a detailed and accurate model. The material card used in this model is mesh-sensitive and requires an average element size of 3 mm, as validated in our previous study [29]. The modeling pipeline, which was automated using Python open-source packages (v3.9), utilized a commercial software (Ansa 22.0.1; Beta CAE Systems, Root, Switzerland) for meshing. The FEMs were material mapped as described by Enns-Bray et al., utilizing a nonlinear material model that incorporates strain rate sensitivity and accounts for tension–compression asymmetry [29]. Briefly, the material properties of bone were mapped to the mesh using the bone density data from the scans. To do this, bone density was calibrated to ash density which was then subsequently converted to apparent density, and this was then used to calculate Young’s modulus. Three-dimensional interpolation was applied following the correction of partial volume artifacts using the material mapping method B [30]. The material mapping steps to obtain Young’s modulus assigned to the elements are described by the equations summarized in Fig. 1A [31] [32] [33]. The conversion equation from apparent density to Young’s modulus was initially developed based on trabecular bone experiments but has since been validated for the whole range of bone densities in subject-specific FEMs [30, 34, 35]. Our previous study, which applied this conversion equation to compare FEM predictions with experimental data on whole-bone stiffness and local strain, found a slope close to unity and an offset near zero, with both differences being statistically insignificant [30]. Additionally, femoral strength estimates derived from FEMs using this density–modulus relationship have shown superior performance over aBMD in distinguishing hip fracture risk in prior in vivo studies [11, 17].Fig. 1A Material mapping steps for the finite element models of the proximal femur. ρ_K2HPO4, bone mineral density in g/cm^3^; ρash, ash density; ρapp, apparent density; E, Young’s modulus. B Sample finite element model from the PIONEER cohort with boundary conditions for sideways fall loading. C Sample femur head force–time response recorded to measure femoral strength at the peak
In our previous study involving 4621 subjects, the sideways fall configuration with a loading of –5° for the adduction angle and 0° for internal rotation, as shown in Fig. 1B, demonstrated greater discriminatory power for predicting hip fracture risk than aBMD [17]. The distal part of the bone was the center of the condyles of a mean femur mesh [36], determined by overlaying the subject’s femur onto an average femur. It was then hinged to allow rotation solely around an axis perpendicular to the femoral shaft. Two rigid supports were used to hold the femur in place during the simulation. The supports at the greater trochanter and femoral head were modelled as rigid bodies and offset with frictionless contact from the surface of the femur. The frictionless contact is to ensure that the supports do not resist or interfere with the bone’s movement, ensuring accurate simulation. All degrees of freedom were constrained at the greater trochanter support. The femoral head support was allowed to move only in a downward direction with a boundary prescribed motion of 1 m/s as observed in experimental and computational fall models [37, 38]. The FEMs were processed in a commercially available explicit finite element solver (LS-Dyna, R12.2.1, ANSYS, Inc, Canonsburg, PA, USA). Femoral strength was recorded as the peak resultant force at the femoral head during the simulation, as shown in Fig. 1C. Force–time curves from all simulations were visually inspected to check for potential FEM modeling errors. The peak force for each simulation was extracted using an open-source Python package, lasso-python (v 1.5.2).
Statistical analysis
Baseline characteristics, including age, weight, height, BMI, and T-score, were compared across ethnicities (Chinese, Malay, and Indian) separately for males and females. Descriptive statistics, including means and standard deviations (SD), were calculated for each variable. A one-way analysis of variance (ANOVA) was conducted using the scipy Python package (v1.7.1). The p-value obtained from the ANOVA test indicates whether there are statistically significant differences in the means for continuous variables between different ethnicities. aBMD, T-score, and femoral strength were adjusted for age. Statistical significance was set at a p-value of less than 0.05. Locally weighted scatterplot smoothing (LOWESS) [39], obtained using the statsmodels Python package (v0.12.2), was used to determine the trend between age and aBMD, FRAX-HFP, TSTT, and femoral strength. Additionally, ANCOVA was performed to assess the statistical significance of these LOWESS trends with respect to the covariate, “Age.” A distribution of femoral strength based on FRAX-HFP was analyzed, categorized by gender and ethnicity, to explore whether the stratification using these biomarkers overlaps or has a potential synergistic effect. The gender and ethnic relationships of FRAX-HFP and femoral strength were analyzed with respect to T-scores. These distributions were assessed in relation to different thresholds: the osteoporotic T-score threshold of − 2.5, the osteopenic threshold of − 1, the 2% threshold for FRAX-HFP [40], and the femoral strength thresholds of 3 kN for females and 3.5 kN for males, based on a Korean population [41].
Results
A total of 31 subjects were excluded due to motion artifacts in the DXA scans (n = 18) and FEM modeling errors (n = 13), resulting in the analysis of 2204 subjects (1224 females and 980 males). Table 1 summarizes the demographic information, along with aBMD, FRAX-HFP, TSTT, and femoral strength for the subjects. Age differences between males of the three ethnicities were not statistically significant (p = 0.6123), while this difference was significant between females (p < 0.0001). Differences in weight, height, BMI, TSTT, and FRAX-HFP were statistically significant across ethnicities for both genders (all p < 0.01). After adjusting for age, aBMD, T-score, and femoral strength continued to show significant differences between the three ethnic groups for both genders (all p < 0.0001) (Table 1). The trajectory lines for aBMD, TSTT, and femoral strength were comparatively lower for the Chinese population, while the trajectory lines for FRAX-HFP were higher for Chinese subjects compared to Malays and Indians (Fig. 2) (all p-values < 0.0001). Table 1. Descriptive statistics for the cohort in the studyVariablePooledChineseIndianMalayp-valueNumber of males980494213273Age (years)73.45 ± 8.3473.70 ± 8.1473.32 ± 8.8273.10 ± 8.310.6123Weight (kg)67.98 ± 12.5865.29 ± 10.6571.17 ± 14.3370.37 ± 13.30 < 0.0001Height (cm)164.80 ± 6.75164.66 ± 6.74166.01 ± 7.06164.12 ± 6.410.0073BMI (kg/m^2^)25.00 ± 4.2424.09 ± 3.8725.71 ± 4.3226.08 ± 4.47 < 0.0001TSTT (cm)2.68 ± 0.742.31 ± 0.603.13 ± 0.692.99 ± 0.67 < 0.0001FRAX-HFP (%)2.00 ± 1.812.56 ± 2.051.34 ± 1.271.52 ± 1.34 < 0.0001aBMD (g/cm^2^)0.89 ± 0.140.86 ± 0.130.95 ± 0.150.91 ± 0.14 < 0.0001T*-score* − 1.32 ± 1.10 − 1.57 ± 1.00 − 0.88 ± 1.20 − 1.22 ± 1.08 < 0.0001Femoral strength (kN)4.99 ± 1.974.56 ± 1.765.89 ± 2.285.05 ± 1.82 < 0.0001Number of females1224594305325Age (years)73.71 ± 8.3774.20 ± 8.3074.67 ± 8.6171.91 ± 8.01 < 0.0001Weight (kg)59.21 ± 12.7955.08 ± 9.5062.74 ± 12.8463.46 ± 15.39 < 0.0001Height (cm)151.74 ± 6.40152.84 ± 6.06152.07 ± 6.70149.41 ± 6.12 < 0.0001BMI (kg/m^2^)25.71 ± 5.3223.57 ± 3.8327.07 ± 4.9828.35 ± 6.31 < 0.0001TSTT (cm)3.61 ± 1.272.95 ± 0.924.21 ± 1.064.25 ± 1.37 < 0.0001FRAX-HFP (%)4.23 ± 4.505.64 ± 5.032.66 ± 2.673.14 ± 4.01 < 0.0001aBMD (g/cm^2^)0.75 ± 0.120.72 ± 0.110.78 ± 0.130.75 ± 0.13 < 0.0001T-score* − 1.46 ± 1.08 − 1.64 ± 0.99 − 1.13 ± 1.11 − 1.43 ± 1.12 < 0.0001Femoral strength (kN)3.67 ± 1.253.54 ± 1.134.06 ± 1.393.55 ± 1.24 < 0.0001BMI* body mass index, aBMD areal bone mineral density at Total hip, FRAX-HFP fracture risk assessment tool probability of hip fracture over a 10-year period; TSTT trochanteric soft tissue thickness*Adjusted for ageFig. 2Gender and ethnic specific age-related trajectories in A, B; aBMD, C, D; FRAX-HFP score, E, F; TSTT, G, H; femoral strength, for males and females, respectively. The shaded regions indicate the 95% confidence interval for a given trajectory line. aBMD, areal bone mineral density; FRAX-HFP, fracture risk assessment tool probability of hip fracture over a 10-year period; TSTT, trochanteric soft tissue thickness
We compared the classification of hip fracture risk between FRAX-HFP and femoral strength (Fig. 3), FRAX-HFP and T-score (Fig. 4), and femoral strength and T-score (Fig. 5) by gender and ethnicity. In both the pooled male and pooled female groups, FRAX-HFP and femoral strength identified different subjects above the selected thresholds [40, 41], with FRAX-HFP flagging a higher percentage of females (62%) compared to males (40%), while femoral strength identified 36% of females and 27% of males as above the thresholds. The T-score threshold identified fewer subjects at risk, with 15% in males and 18% in females. Additionally, FRAX-HFP identified 25% more males and 44% more females at risk compared to T-score, while femoral strength flagged an additional 14% of males and 19% of females. Across all methods, Chinese subjects were consistently identified as the highest risk group, followed by Malays and Indians, regardless of gender.Fig. 3. Gender and ethnic specific distribution of femoral strength as a function of FRAX-HFP score. A, B, Pooled; C, D, Chinese; E, F, Indian; G, H, Malay; for males and females, respectively. Solid red line (vertical): FRAX-HFP threshold at 2% [40]. Dashed blue line (horizontal): fragile bone threshold (females, 3 kN; males, 3.5 kN) [41]. The red arrows represent at-risk region based on the respective thresholdsFig. 4Gender and ethnic specific distribution of FRAX-HFP with respect to T-score. A, B, Pooled; C, D, Chinese; E, F, Indian; G, H, Malay; for males and females, respectively. Solid red line (vertical): osteoporotic T-score threshold (T-score = − 2.5). Dashed green line (vertical): normal T-score threshold (T-score = − 1). Dashed blue line (horizontal): FRAX-HFP threshold at 2% [40]. The red arrows represent at-risk region based on the respective thresholdFig. 5Gender and ethnic specific distribution of femoral strength with respect to T-score. A, B, Pooled; C, D, Chinese; E, F, Indian; G, H, Malay; for males and females, respectively. Solid red line (vertical): osteoporotic T-score threshold (T-score = − 2.5). Dashed green line (vertical): normal T-score threshold (T-score = − 1). Dashed blue line (horizontal): fragile bone threshold (females, 3 kN; males, 3.5 kN) [41]. The red arrows represent at risk region based on the respective threshold
Discussion
The primary aim of this study was to investigate the age-related trajectories of aBMD, FRAX-HFP scores, TSTT, and femoral strength in a diverse, multi-ethnic (Chinese, Indian, Malay) cohort of community-dwelling older adults in Singapore. Additionally, we examined the relationship between femoral strength and FRAX-HFP with T-score thresholds—the latter being the current clinical standard for a densitometric diagnosis of osteoporosis. We found that the age-related trajectories of aBMD, FRAX-HFP, TSTT, and femoral strength differed by gender and ethnicity. Specifically, compared to Malays and Indians, Chinese individuals showed higher risk metrics, such as lower aBMD, higher FRAX-HFP, thinner TSTT, and lower femoral strength. With respect to the secondary aim, the study showed that osteopenic or normal T-score participants were among the at-risk individuals identified by both biomarkers and that FRAX-HFP and femoral strength do not always identify the same individuals at risk, i.e., some individuals flagged by one measure (e.g., high FRAX-HFP) may not be flagged by the other. Combining these measures may provide a more nuanced approach to fracture risk estimation.
We found that females exhibited lower aBMD, higher FRAX-HFP, thinner TSTT, and lower femoral strength, all of which are associated with an increased risk of hip fractures. Furthermore, the trajectory lines for FRAX-HFP and TSTT for both genders clearly separated Chinese from other ethnic groups studied. Chinese ethnicity has lower aBMD, higher FRAX-HFP, thinner TSTT, and lower femoral strength in both genders compared to Indians and Malays. These results are in line with population data showing that Chinese females had a higher age-adjusted hip fracture rate than Indian and Malays in the Singaporean population [42]. These findings emphasize the importance of taking gender and ethnicity into account when determining hip fracture risk.
T-score thresholds have been observed to have lower sensitivity in capturing hip fracture risk [4–6, 17]. Both FRAX-HFP (which considers 12 clinical risk factors) and femoral strength (which is shown to have better discriminatory power than aBMD [11, 16, 17, 20]) identified individuals at risk in the osteopenic and normal T-score range in our study. The analysis also indicated that FRAX-HFP and femoral strength identified different individuals at risk for the specified thresholds. For the subset of individuals identified as at risk, FRAX-HFP identified a higher number of individuals compared to femoral strength for the Chinese ethnicity, while this was reversed in the case of Indian and Malays. The higher number of Chinese individuals identified by FRAX-HFP may be attributed to the demographic factors included in the FRAX-HFP score calculations. Our findings also suggest that femoral strength captures the biomechanical properties of the femur, which contributes to fracture risk independently of gender and ethnicity. Both FRAX-HFP scores and femoral strength reflected the overall population trend, with the Chinese being identified at higher risk than Indians and Malays. These results should be further validated with actual fracture outcomes to better understand the specified thresholds and their significance across different genders and ethnic groups.
This study has several limitations. First, the cohort lacks data on incident fractures, which could have been useful in validating the findings. Additionally, the Korean femoral strength thresholds [41] were applied to a multi-ethnic Singaporean population investigated in this study, but since these thresholds have not been validated with incident fracture data, further validation is needed to assess their discriminatory capacity. Despite these limitations, this study is the first to investigate age-related trends in bone health risk factors within a diverse Singaporean population, comparing FRAX-HFP scores with FEM-derived femoral strength. Future studies incorporating incident fracture data are necessary to confirm these findings.
Conclusion
This study has several clinical and public health-related implications. It reinforces that T-scores, while valuable, are insufficient as a standalone measure for identifying individuals at high risk of hip fractures. Incorporating femoral strength and FRAX-HFP scores into clinical workflows could enhance risk stratification. Femoral strength, derived from DXA-based finite element models, provides biomechanical insights that are independent of clinical risk factors. The observed age-related trends are consistent with hip fracture rates in the Singaporean population. The pronounced vulnerability of Chinese participants to fractures calls for tailored interventions and preventive strategies, including targeted screening and public health initiatives to address modifiable risk factors. For Indians and Malays, lower FRAX-HFP scores and stronger femurs indicate a potentially lower fracture burden, yet individual risk assessments remain essential. The findings also highlight the need for sex-specific thresholds and interventions. Special attention should be given to women, particularly those who are postmenopausal in fracture prevention programs, given their higher FRAX-HFP scores and lower femoral strength. Validation through long-term epidemiological data and incident fracture outcomes is necessary to confirm these findings.