Depression and depressive symptoms in physicians prior to the COVID-19 pandemic: a systematic review and meta-analysis
Shan Dhaliwal, Deena Fremont, Wenshan Li, Daniel Myran, Marco Solmi, Peter Tanuseputro, Janet Wilson, Manish M Sood

TL;DR
This study finds that about one-third of physicians showed signs of depression before the pandemic, but results vary widely due to different study methods.
Contribution
The paper provides the first comprehensive meta-analysis of depression in physicians before the COVID-19 pandemic.
Findings
The pooled prevalence of depression or depressive symptoms among physicians was 34.2%.
No significant difference in depression was found between male and female physicians.
Residents had slightly higher rates of depression compared to staff physicians.
Abstract
Mental health disorders, such as depression, can significantly impact a physician’s well-being and the quality of care they provide. We conducted a systematic review and meta-analysis to identify risk factors and to estimate the prevalence of depression and depressive symptoms in physicians prior to the COVID-19 pandemic. This PRISMA 2020–compliant systematic review and meta-analysis searched EMBASE, APA PsycINFO, and MEDLINE databases for studies published between January 2002 and March 2020 (pre–COVID-19 period). Risk of bias was assessed using a modified Newcastle-Ottawa Scale for cohort and cross-sectional studies. We included studies of physicians where depression/depressive symptoms were measured by either a validated questionnaire or clinical diagnosis. The primary and secondary outcomes measures included assessing the prevalence of depression/depressive symptoms, and whether…
Genes, proteins, chemicals, diseases, species, mutations and cell lines named across the full text — each resolved to its canonical identifier and authoritative record.
Click any figure to enlarge with its caption.
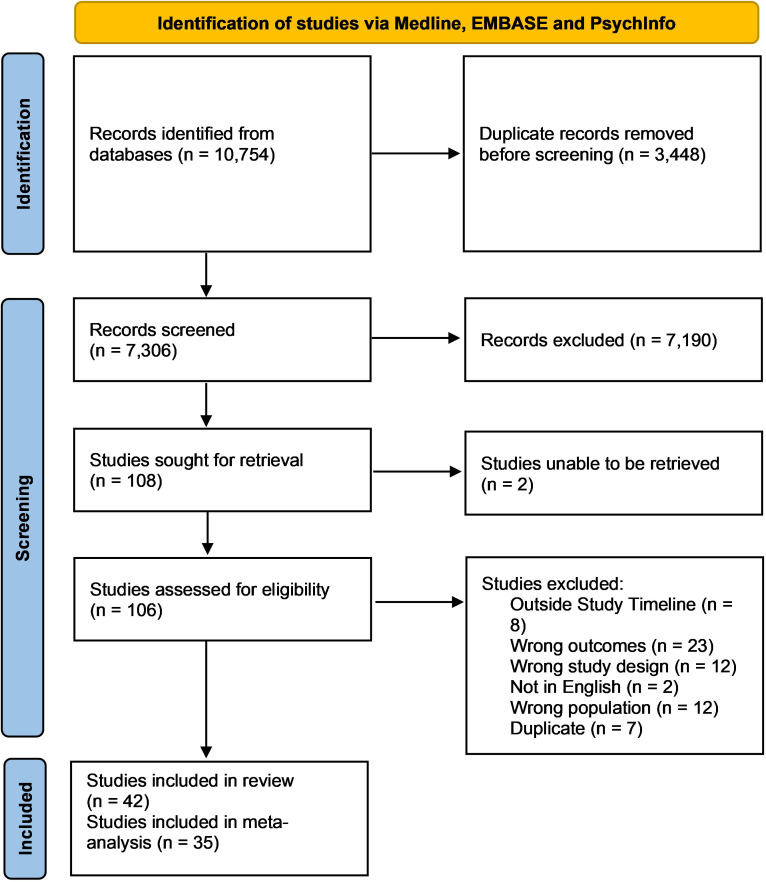 Figure 1
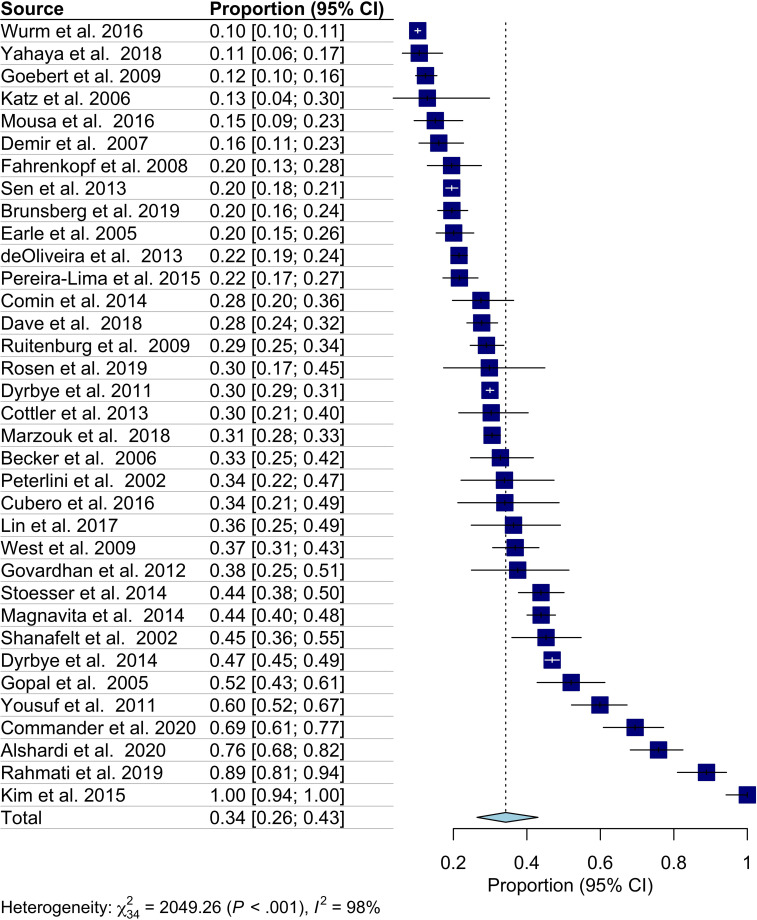 Figure 2
| Author, year | Location | Study design/MD type | Sample (n) | Response rate (%) | Outcome assessment | Definition of outcome | Outcome n (%) |
|---|---|---|---|---|---|---|---|
| Balch et al. ( | USA | CSS/surgeons | 7861 (missing n=63) | 35.0 | PRIME-MD | Positive Screening | 2333 (29.6) |
| Balch et al. ( | USA | CSS/surgeon | 7697 (missing n=53) | 32.0 | PRIME-MD | Positive Screening | 2320 (30.1) |
| Campbell et al. ( | USA | CSS/IM residents | 86 | 48.0 | PRIME-MD | Score≥3=Depression | As First Year: 45 ( |
| Dyrbye et al. ( | USA | CSS/surgeons | 7858 | 31.5 | PRIME-MD | Positive Screening | 2354 (30.0) |
| Dyrbye et al. ( | USA | CSS/surgeons | 6240 | 28.7 | PRIME-MD | Positive Screening | 2510 (40.2) |
| Dyrbye et al. ( | USA | CSS/residents and physicians | 2581 | 22.5 | PRIME-MD | Positive Screening | 1210 (46.9) |
| West et al. ( | USA | PCS/IM residents | 149 | 84.0 | PRIME-MD | Positive Screening | 47 (31.5) |
| West et al. ( | USA | PCS/IM residents | 239 | 88.3 | PRIME-MD | Positive Screening | 88 (36.8) |
| Gopal et al. ( | USA | CSS/IM residents a | 121 | 80.5 | PRIME-MD | Positive Screening | 67 (55.4) |
| Shanafelt et al. ( | USA | CSS/IM residents | 115 | 76.0 | PRIME-MD | Positive Screening | 52 (45.2) |
| Cubero et al. ( | Brazil | PCS/Oncology Fellows | 50 | 100 | BDI | 0-4=No depression; 5-7=Mild depression; 8-15=Moderate depression; ≥16=Severe depression | 17 (18.8) |
| Demir et al. ( | Turkey | CSS/residents | 156 | 75.0 | BDI | Score≥17=probable depression | 25 (16.0) |
| Peterlini et al. ( | Brazil | CSS/residents | 59 | N/A | BDI | <16=Low depressive symptoms; 16-21=medium depressive symptoms; >21=high depressive symptoms | Total: 20 (33.4); Low: 16 (27.1); Medium: 3 (4.2); High: 1 (2.1) |
| Kim et al. ( | South Korea | CSS/residents | 62 | N/A | BDI | Score >=16 Moderate or Severe Depression | Total: 62 (100.0); Moderate: 10 (16.1) |
| Lin et al. ( | USA | PCS/general surgery residents | 66 | 63.0 | BDI | 0-4=No depression; 5-7=Mild depression; 8-15=Moderate depression; ≥16=Severe depression | Total: 24 (36.4); Mild: 11 (16.7); Moderate: 8 (12.1); Severe: 5 (7.6) |
| Rosen et al. ( | US | PCS/residents | 47 | 80.0 | BDI | Moderate Depression: Score >= 8 | Beginning of residency: 2 (4.3) |
| Ruitenburg et al. ( | Netherlands | CSS | 400 | 51.0 | BDI | High likelihood of Depression: Score >= 4 | 116 (29.0) |
| Govardhan et al. ( | USA | CSS/OB/GYN residents | 56 | 46.0 | CES | Score≥16=Depressed | 21 (37.5) |
| Goebert et al. ( | USA | CSS/residents | 532 | 64.0 | CES | <16=No depression; 16-21=mild to moderate depression; >21=major depression | Total: 63 (11.9); Minor/Moderate: 25 (4.7) |
| Katz et al. ( | USA | PCS/Emergency Medicine residents | 31 | 62.0 | CES | <16=No depression; 16-21=mild to moderate depression; >21=major depression | 4 (12.9) |
| Becker et al. ( | USA | CSS/Obstetrics and Gynecology residents | 125 | 29.0 | CES | Score≥16=Depressed | 41 (32.8) |
| Yousuf et al. ( | Pakistan | CSS/residents | 172 | 82.7 | Zung Self-rating Depression Scale | N/A | 103 (59.9) |
| Comin et al. ( | Spain | RCS | 120 | N/A | Clinical Interview | Positive Screening | 33 (27.5) |
| Yahaya et al. ( | Malaysia | CSS/Emergency Medicine physicians | 140 | N/A | DASS-21 | Score>13=depression | 15 (10.7) |
| Dave et al. ( | India | CSS/residents | 462 | 88.8 | DASS-21 | Normal, mild, moderate, severe, and extremely severe (no scores associated with it) | 128 (27.7) |
| Magnavita et al. ( | Italy | CSS/Radiologists | 654 | N/A | Goldberg’s Anxiety and Depression Scales | Score≥4=depression | 287 (43.9) |
| Brunsberg et al. ( | USA and Canada | PCS/Pediatric Residents | 388 | 72.0 | HANDS | Score≥9=Depressed | 76 (19.6) |
| Fahrenkopf et al. ( | USA | PCS/residents | 123 | 50.0 | HANDS | Score≥9=Depressed | 24 (19.5) |
| deOliveira et al. ( | USA | CSS/anesthesiology residents | 1384 | 54.0 | HANDS | Score≥9=Depressed | 298 (21.5) |
| Marzouk et al. ( | Tunisia | CSS/residents | 1700 | 77.0 | HAD | Score 8-10=probable depression; score ≥11=depression | 519 (30.5) |
| Wurm et al. ( | Austria | CSS | 5897 | 15.8 | MDI | Mild: 20-24; Moderate: 25-29; Severe: 30+ | Total: 607 (10.4); Mild: 50 (0.9); Moderate: 135 (2.3); Severe: 422 (7.2) |
| Rahmati et al. ( | Iran | PCS/Emergency Medicine residents | 99 | 100.0 | Minnesota Multiphasic Personality Inventory | Mild/Moderate/Severe/Very severe depression | First year: Total: 88 (88.8); Mild: 34(33.3); Moderate: 42 (42.2); Severe: 12 (12.1) |
| Cottler et al. ( | USA | PCS | 99 | N/A | National Epidemiologic Survey on Alcohol and Related Condition | N/A | 30 (30.3) |
| Mousa et al. ( | USA | CSS/residents | 126 | 24.4 | PHQ-2 | Score≥3=MDD | 19 (15.1) |
| Pereira-Lima et al. ( | Brazil | CSS/residents | 305 | 76.25 | PHQ-4 | Score≥3=Depression | 66 (21.6) |
| Alshardi et al. ( | Saudi Arabia | CSS/residents | 149 | 72.8 | PHQ-9 | 0-4=No depression; 5-9=Mild depression; 10-14=Moderate depression; 15-19=Moderately severe depression; ≥20=Severe depression | 113 (75.8) |
| Commander et al. ( | Africa | CSS/surgeons | 131 | 12.4 | PHQ-9 | Positive screening for depression: mild, moderate, moderately severe, and severe | 91 (69.5) |
| Kalmbach et al. ( | USA | PCS/residents | 933 | PHQ-9 | Positive screening at 3 or 6 months | 151 (12.4) | |
| Sen et al. ( | USA | PCS/residents | 740 | 58.0 | PHQ-9 | Moderate Depression: 10-14 | 190 (25.7) |
| Sen et al. ( | USA | PCS/IM residents | 2323 | 58.0 | PHQ-9 | Positive Screening | 454 (19.5) |
| Stoesser et al. ( | USA | CSS/residents | 260 | 36.9 | PHQ-9 | 0-4=No depression; 5-9=Mild depression; 10-14=Moderate depression; 15-19=Moderately severe depression; 20-27=Severe depression | 114 (43.9) |
| Earle et al. ( | Canada | CSS/family medicine residents | 254 | 46 | Modified PHQ using DSM-IV criteria for depression and anxiety symptoms | N/A | 51 (20.0) |
| Author, year | Outcome assessment | Definition of outcome | Specialty distribution | Outcome | Training stage distribution | Outcome |
|---|---|---|---|---|---|---|
| Katz et al. ( | CES | <16=No depression; 16-21=mild to moderate depression; >21=major depression | Emergency: 31 | Emergency: 4 (12.9) | Residents: 31 | 4 (12.9) |
| Mousa et al. ( | PHQ-2 | Score≥3=MDD | N/A | N/A | Residents: 126 | 19 (15.1) |
| Demir et al. ( | BDI | Score≥17=probable depression | N/A | N/A | Residents: 156 | 25 (16.0) |
| Stoesser et al. ( | PHQ-9 | Score≥10=Depression | N/A | N/A | Residents: 260 | 114 (43.8) |
| Fahrenkopf et al. ( | HANDS | Score≥9=Depressed | Pediatrics: 123 | Pediatrics: 24 (19.5) | Residents: 123 | 24 (19.5) |
| Sen et al. ( | PHQ-9 | Positive Screening | N/A | N/A | Residents: 2323 | 454 (19.5) |
| Brunsberg et al. ( | HANDS | Score≥9=Depressed | Pediatrics: 388 | Pediatrics: 76 (19.6) | Residents: 388 | 76 (19.6) |
| deOliveira et al. ( | HANDS | Score≥9=Depressed | Anesthesiology: 1384 | Anesthesiology: 298 (21.5) | Residents: 1384 | 298 (21.5) |
| Pereira-Lima et al. ( | PHQ-4 | Score≥3=Depression | N/A | N/A | Residents: 305 | 66 (21.6) |
| Dave et al. ( | DASS-21 | Normal, mild, moderate, severe, and extremely severe (no scores associated with it) | N/A | N/A | Residents: 462 | 128 (27.7) |
| Marzouk et al. ( | HAD | Score 8-10=probable depression; score ≥11=depression | N/A | N/A | Residents: 1700 | 519 (30.5) |
| Becker et al. ( | CES | Score≥16=Depressed | Obstetrics and Gynecology: 125 | Obstetrics and Gynecology: 41 (32.8) | Residents: 125 | 41 (32.8) |
| Shanafelt et al. ( | PRIME-MD | Positive Screening | N/A | N/A | Residents: 115 | 52 (45.2) |
| Lin et al. ( | BDI | 0-4=No depression; 5-7=Mild depression; 8-15=Moderate depression; ≥16=Severe depression | Surgeons: 66 | Surgeons: 24 (36.4) | Residents: 66 | 24 (36.4) |
| West et al. ( | PRIME-MD | Positive Screening | Internal Medicine: 239 | Internal Medicine: 88 (36.8) | Residents: 239 | 88 (36.8) |
| Govardhan et al. ( | CES | Score≥16=Depressed | Obstetrics and Gynecology: 56 | Obstetrics and Gynecology: 21 (37.5) | Residents: 56 | 21 (37.5) |
| Kim et al. ( | BDI | Score >= Moderate or Severe Depression | N/A | N/A | Residents: 62 | 62 (100.0) |
| Gopal et al. ( | PRIME-MD | Positive Screening | Internal Medicine: 227 | Internal Medicine: 105 (46.3) | Residents: 121 | 67 (55.4) |
| West et al. ( | PRIME-MD | Positive Screening | Internal Medicine: 149 | Internal Medicine: 70 (47.0) | Residents: 149 | 47 (31.5) |
| Yousuf et al. ( | Zung Self-rating Depression Scale | N/A | N/A | N/A | Residents: 172 | 103 (59.9) |
| Alshardi et al. ( | PHQ-9 | 0-4=No depression; 5-9=Mild depression; 10-14=Moderate depression; 15-19=Moderately severe depression; ≥20=Severe depression | N/A | N/A | Residents: 149 | 113 (75.8) |
| Sen et al. ( | PHQ-9 | Moderate Depression: 10-14 | N/A | N/A | Residents: 740 | 190 (25.7) |
| Peterlini et al. ( | BDI | <16=Low depressive symptoms; 16-21=medium depressive symptoms; >21=high depressive symptoms | Internal Medicine: 59 | Internal Medicine: 8 (13.6) | Residents: 59 | 20 (33.9) |
| Kalmbach et al. ( | PHQ-9 | Positive screening at 3 or 6 months | N/A | N/A | Residents: 933 | 115 (9.5) |
| Earle et al. ( | Modified PHQ using DSM-IV criteria for depression and anxiety symptoms | N/A | Family Medicine: 254 | Family Medicine: 51 (20.0) | Residents: 254 | 51 (20.0) |
| Cubero et al. ( | BDI | 0-4=No depression; 5-7=Mild depression; 8-15=Moderate depression; ≥16=Severe depression | Oncology: 50 | Oncology: 17 (34.0) | Residents: 50 | 17 (34.0) |
| Campbell et al. ( | PRIME-MD | Score≥3=Depression | Internal Medicine: 258 | Internal Medicine: 109 (42.3) | Residents: 86 | As First Year: 45 ( |
| Rahmati et al. ( | Minnesota Multiphasic Personality Inventory | Mild/Moderate/Severe/Very severe depression | Emergency: 99 | As First Year: 88 (88.8) | Residents: 99 | As First Year: 88 (88.8) |
| Goebert et al. ( | CES | <16=No depression; 16-21=mild to moderate depression; >21=major depression | N/A | N/A | Residents: 532; PGY1: 220; PGY2: 84; PGY3: 96; PGY4: 62; PGY5+: 70 | Total: 66 (12.4) &; PGY1: 24 (10.9); PGY2: 12(14.3); PGY3: 14 (14.6); PGY4: 11 (17.8) |
| Wurm et al. ( | MDI | Mild: 20-24 | N/A | N/A | Staff Physician: 5897 | 607 (10.3) |
| Yahaya et al. ( | Score>13=depression | 30 (10.7) | Emergency: 140 | Emergency: 30 (10.7) | Staff Physician: 140 | 15 (10.7) |
| Balch et al. ( | PRIME-MD | Positive Screening | Oncologic Surgeons: 407 | Oncologic: 99 (24.3) | Staff Physician: 7861 (missing n=63) | 2333 (29.6) |
| Balch et al. ( | PRIME-MD | Positive Screening | Surgeons: 7697 | Surgeons: 2320 (30.1) | Staff Physician: 7748 (missing n=53) | 2332 (30.0) |
| Dyrbye et al. ( | PRIME-MD | Positive Screening | Surgeons: 7858 | Surgeons: 2354 (30.0) | Staff Physician: 7858 | 2354 (30.0) |
| Dyrbye et al. ( | PRIME-MD | Positive Screening | Surgeons: 6240 | Surgeons: 2510 (40.2) | Staff Physicians: 6240 | 2510 (40.2) |
| Commander et al. ( | PHQ-9 | Positive screening for depression: mild, moderate, moderately severe, and severe | Surgeons: 129 | Surgeons: 91 (70.5) | Staff Physician: 131 | 91 (94.8) |
| Ruitenburg et al. ( | BDI | High likelihood of Depression: Score >= 4 | N/A | N/A | Residents: 184 | Residents: 57 (31.0) |
| Dyrbye et al. ( | PRIME-MD | Positive Screening | N/A | N/A | Residents: 1701 | Residents: 861 (50.6) |
| Rosen et al. ( | BDI | Moderate Depression: Score >= 8 | Internal Medicine: 47 | Beginning of residency: 2 (4.3) | Residents: 47 | Beginning of residency: 2 (4.3) |
| Magnavita et al. ( | Goldberg’s Anxiety and Depression Scales | Score≥4=depression | Radiology: 654 | Radiology: 298 (21.5) | Staff: 654 | Staff: 298 (21.5) |
| Author, year | Location | Sex n (%) male | Outcome assessment | Definition of outcome | Outcome | Age distribution n (%) | Outcome |
|---|---|---|---|---|---|---|---|
| Dyrbye et al. ( | USA | 6815 (86.7) | PRIME-MD | Positive Screening | M: 2010 (29.5) | N/A | N/A |
| Yahaya et al. ( | Malaysia | 56 (40.0) | DASS-21 | Score>13=depression | M: 8 (14.3) | 20-29: 62 | 20-29: 4 (6.2) |
| Stoesser et al. ( | Utah, USA | 126 (50.2) | PHQ-9 | Score≥10=Depression | M: 45 (35.7) | ||
| Ruitenburg et al. ( | Netherlands | 189 (47.4) | BDI | High likelihood of Depression: Score >= 4 | M: 47 (25.0) | 20-35: 170 | 20-35: 49 (29.0) |
| Alshardi et al. ( | Jedah, Saudi Arabia | 70 (47.0) | PHQ-9 | 0-4=No depression; 5-9=Mild depression; 10-14=Moderate depression; 15-19=Moderately severe depression; ≥20=Severe depression | M: 51 (72.9) | <=26: 76 | <=26: 55 (72.4) |
| Mousa et al. ( | New York, USA | PHQ-2 | Score≥3=MDD | N/A | 18-24: 158 | 18-24: 29 (18.4) | |
| Demir et al. ( | Istanbul, Turkey | 63 (40.4) | BDI | Score≥17=probable depression | M: 4 (6.3) | <29: 122 | <29: 19 (15.6) |
Peer Reviews
No public reviews on file for this paper yet. If you reviewed it on a platform where reviews are public (OpenReview, ICLR, NeurIPS, ICML), you can paste yours below so the community can read it here.
Videos
No videos yet. Explain this paper in a talk, walkthrough, or lecture? Add one.
Taxonomy
TopicsHealthcare professionals’ stress and burnout · COVID-19 and Mental Health · Empathy and Medical Education
Introduction
1
Prior to the COVID-19 pandemic, mental illness was the leading cause of global health-related burden (1). The onset of the pandemic created an environment in which factors contributing to poor mental health intensified, due to heightened uncertainty surrounding the crisis. Many professionals, including but not limited to frontline physicians, experienced burnout and exhaustion during this stressful time period. While the pandemic amplified these concerns across healthcare professions, physicians represent a unique group given the high intensity demands of clinical care and the psychologically taxing responsibilities of patient care (2, 3). These conditions, which were already prominent in the physician community prior to the pandemic, are the beginning of a continuum that may lead to depressive symptoms and an elevated risk of suicide (4–8). Furthermore, depressive symptoms in physicians not only impact individual well-being, but also have been associated with medical errors, and low quality of patient care (9, 10). Early identification of high-risk individuals may alleviate suffering, improve physician health and well-being, and reduce leaves of absence.
Due to these factors, researchers have been interested in understanding the impact of COVID-19 on mental illness. However, no systematic reviews and meta-analyses to date have assessed the prevalence of physician mental health, specifically depressive symptoms, across all career stages prior to the COVID-19 pandemic. A previous systematic review focusing exclusively on medical residents found that 28.8% reported depressive symptoms (11). However, whether this is consistent after the completion of medical training and/or varies by age, sex, and medical specialty remains unknown. This study advances previous work by comprehensively examining the extent of depressive symptoms in physicians and whether symptoms differ by age, sex, training stage (residents, staff physicians), and specialty, prior to the COVID-19 pandemic. Understanding the pre-pandemic prevalence of depressive symptoms in physicians will provide an essential baseline against which post-pandemic studies can be compared, allowing for a clear assessment of the pandemic’s long-term impact.
Methods
2
This systematic review and meta-analysis were developed based on the Preferred Reporting Items for Systematic Review and Meta-Analysis PRISMA-2020 checklist guidelines (Supplementary Material). We registered this study PROSPERO International Prospective Register of Systematic Reviews (ID CRD42021232814).
Inclusion/exclusion criteria
2.1
Studies of medical doctors, including residents, fellows, and staff physicians from population-based cohort, cross-sectional, and randomized control studies were included. The primary outcome was depression or depressive symptoms, defined by a clinical diagnosis, a validated questionnaire, or physician-administered scale. Definitions of depression and depressive symptoms were determined based on the terminology and criteria used in each included study. We excluded articles i) where depression was assessed by a non-validated measure, ii) case-control studies and iii) medical students, iv) non-physician healthcare professionals, or v) in any language other than English (for reviewer comprehension purposes).
Search strategy
2.2
We searched the following databases: Medline, EMBASE, and APA PsycINFO (OVID interface) for articles from January 2002 until March 2020. The study period was selected to reflect contemporary literature in the area and shifts in physician demographics (more females entering the physician workforce). Articles post-March 2020 were excluded to establish the state of physician depression and depressive symptoms prior to the COVID-19 pandemic. Articles from grey literature were also excluded. The search strategy was reviewed by a health science librarian with expertise in systematic reviews (see Data Supplementary File).
Study records and data extraction
2.3
All relevant articles were reviewed by two independent screeners (AF and SD) for inclusion and categorized as eligible, ineligible, or possibly eligible. Any conflicts were reviewed by two independent authors (ER and NC). Articles marked as ‘Yes’ had their full texts retrieved and reviewed for final inclusion (based on consensus between SD and HD). Following full-text screening, two reviewers (HD and SD) independently extracted data from included full-text articles and entered findings into a data extraction form. Originally, our study aimed to study the available literature on MDD; however, it was found that most studies focused on depression and depressive symptoms. Thus, a decision was made to focus instead on the latter.
The following information was extracted: descriptive statistics related to study location, year of publication, study design, age and sex of participants, and level of training; number of individuals who were assessed for depression or depressive symptoms; the number of individuals who screened positive for depression or depressive symptoms; any subgroup assessments where the results were stratified by sex, age, or level of training; the method of assessment; and cut-off scores for assessing depression or depressive symptoms. No assumptions were made regarding missing data. After data extraction, data extraction results were compared between reviewers and consolidated into a final data sheet used for further analysis. Conflicts at this stage were resolved through discussion between the reviewers (SD and HD) responsible for extraction. The Covidence Systematic Review Management Software (Covidence, Melbourne, VIC, Australia) was used for screening (12).
Data synthesis
2.4
Categorization of depression and/or depressive symptoms was heterogeneous in our screened articles. For the purposes of meta-analyses, results of each study were treated as dichotomous variables, with any instance of depression or depressive symptoms considered as a positive screen. Pooled results were calculated for all included studies and subgroups of study design, sex, specialty, and training period. In studies examining the same study population, only the study with the largest sample size was included. Random-effects modelling was utilized to estimate a pooled prevalence of depression or depressive symptoms based on the proportions reported by each study. From these proportions, the Clopper-Pearson method was used to derive confidence intervals (13). For the purposes of calculating pooled odds ratio estimates, the Mantel-Haenszel method was used to determine the weight of each study and Knapp-Hartung adjustments were made for the random effects model (14). In the case of prospective and retrospective cohort studies that reported proportional estimates made throughout the course of the study, an overall period proportion was used. Heterogeneity was assessed by the I^1^ statistic and X^2^ tests. In addition, a single-study exclusion sensitivity analysis was done to estimate the effect of each study on the pooled estimate. Results were presented in the form of forest plots. All analyses were done following Harrer et al.’s guide to Meta-Analysis and conducted using R version 4.2.2 (R Foundation for Statistical Computing) with RStudio (13, 15, 16). All statistical tests were 2-sided and used a threshold of p<0.05.
Risk of bias assessment
2.5
To assess the quality of studies included in this review, the modified version of the Newcastle-Ottawa Scale (NOS) was used for both cohort and cross-sectional studies (17). NOS includes sections to assess the selection, comparability with the general population, and assessment of the outcome. The forms for the modified NOS are included in the Data Supplementary File.
Results
3
Study characteristics
3.1
A total of 10,754 studies were identified using the search strategy, with 7,306 abstracts being screened out after the removal of duplicate articles. From there, 106 full-text articles were assessed for inclusion, of which 64 articles were removed based on exclusion criteria (Figure 1). Overall, 42 studies were included in this systematic review, with 35 of these studies being utilized during meta analyses. Included studies were published between 2002–2020 with the majority being from the United States, and the remaining from Europe, Africa, South America, Asia, and the Middle East. Most studies were cross-sectional (n=28), with the remainder being cohort studies (n=14), which were primarily prospective cohort studies (n=13) and one retrospective cohort study. Overall, using 35 studies encompassing 257,284 physicians with 7,293 screening positive, the pooled estimated proportion of depression and depressive symptoms was 34.2% (CI: 26.3-43.0%) with significant heterogeneity (I^2^ = 98%) (Table 1, Figure 2). No difference in the pooled estimates was noted with stratification by study design (cross sectional surveys vs. cohort studies, Supplementary Figure 1).
PRISMA flow chart.
Forest plot on the overall prevalence of depressive symptoms.
The most common method of depression assessment were the Primary Care Evaluation of Mental Disorders (PRIME-MD) with 10 studies (18–27), followed by the Patient Health Questionnaire (PHQ), and its variations, with nine studies (51–59). The Beck Depression Inventory (BDI) survey was used in seven studies (28–34), while the Center for Epidemiologic Studies (CES) Depression Scale was used 4 times (35–38), the Harvard Department of Psychiatry National Depression Screening Day Scale (HANDS) was used in 3 studies (44–46), and the Depression Anxiety Stress Scales-21 (DASS-21) was used in two studies (39, 40). Finally, the Zung Self-Rating Depression Scale, the National Epidemiologic Survey on Alcohol and Related Conditions, the Minnesota Multiphasic Personality Inventory, the Hospital Anxiety and Depression Scale (HAD), the Goldberg’s Anxiety and Depression Scales, the Major Depression Inventory (MDI), and a clinical interview were used once in the remaining studies (41–43, 47–50). Heterogeneity was observed for defining depression or depressive systems within the same method of assessment. For example, Demir et al. classified probable depression with a score of 17, while Lin et al. defined 5–8 as mild depression, 8–15 as moderate, and greater than 16 as severe depression (29, 32). The studies utilizing the BDI instrument reported 4 different cut-off scores for depression, while those using the CES used a score of 16 or greater to define depression. Similar differences were noted in studies using the Depression and Anxiety Scales (DASS-21), with one study not reporting the cut-off scores but instead only the various categories of depression. Studies reporting the HANDS instrument consistently used the same cut-off score, while the PHQ and its derivatives varied.
Studies by specialty
3.2
Twenty studies included participant-level data on medical specialties. Internal medicine (n=6) (20, 24–27, 57) and surgery (n=6) (18, 19, 21, 22, 32, 54) had the greatest number of studies, followed by emergency medicine (n = 3) (31, 38, 42), ‘other’ specialties (n=3), and pediatrics (n=2) (44, 45). The reported proportion of depression or depressive symptoms among surgeons varied between 30-70.5 (18, 19, 32, 54). A similar trend was found for emergency medicine physicians, with two studies showing lower levels of depression (10.7-12.1%), and one reporting much higher prevalences (88.8%) (37, 40, 48). Five of the six studies on internal medicine residents reported relatively high proportions of depression (ranging from 29.8-47.0%), whereas the remaining study found a lower prevalence (13.6%) (20, 24–26, 30, 33). Isolated studies of oncologists and general practitioners reported 34% and 21.5% affected by depression or depressive symptoms, respectively (28, 59). Pediatricians and obstetrics/gynecology each had two studies conducted with 19.5-19.6% and 32.8-37.5% of physicians reporting depression and depressive symptoms, respectively (35, 38, 44, 45). In addition, 21.5% of participating anesthesiologists (n=1 study) and 43.9% of participating radiologists (n=1 study) were reported to have depression or depressive symptoms (43, 46). Only one study stratified depression by different specialties. This study, completed by Balch et al., found that oncologic surgeons reported lower levels of depression relative to other surgeons (18) (Table 2).
After removing duplicate studies, surgeons (n=3) were found to have the highest overall pooled estimate for depression at 45% (95% CI: 26-66%) with a high degree of heterogeneity (I ^2^ = 98%) (Supplementary Figure 2). This was then followed by radiology (n=1), with a pooled prevalence of 44% (95% CI: 40-48%), and internal medicine (n=4), with a pooled prevalence of 39% (95% CI: 31-47%. The lowest prevalence of depression was seen in family medicine and pediatrics, with pooled estimates of 20% (95% CI:15-26%) and 20% (95% CI:16-23%), respectively.
Studies by sex
3.3
Six studies stratified rates of depression or depressive symptoms by sex. Overall, a slightly higher proportion of female physicians screened positive for depression or depressive symptoms (548/1634, 33.5%), compared to their male colleagues (2165/7319, 29.6%). Furthermore, male physicians were less likely to report depressive symptoms compared to female physicians (OR: 0.78, 95% CI: 0.46; 1.31, I ^2^ = 37%) (Supplementary Figure 3). However, these results were not consistent. Yahaya et al. found that female physicians had a lower prevalence of depression (8.3%), compared to male physicians (10.7% - Table 3).
Studies by level of training
3.4
Of the included studies, 30 reported on residents as the study population (25 were included for meta-analysis due to duplicate study populations, with eight including the year of training of included residents), nine included fully trained staff physicians (five were used in meta-analysis), and two included information on both residents and physicians (Supplementary Figures 4, 5). One study that focused on fellows by Cubero et al. (included in resident population) reported that 34.0% of medical oncology fellows were depressed (28). There was large variability in the 28 studies reporting on depression in residents (6% to 100%). This same large range in depression was observed across all physician training levels (10% to 70.5%; Table 2). Three studies reported depression to decrease as physicians went through training, while one study reported the opposite trend. The overall pooled estimate in studies of residents was slightly higher at 36% (95% CI: 26-47%, I ^2^ = 96%) compared to 29% (95% CI: 13-53%, I ^2^ = 100%) in physicians (Supplementary Figures 4, 5). However, in the two studies reporting both physicians and residents, no difference was noted (OR: 0.66, 95% CI: 0.22;1.98, I ^2^ = 5%) (Supplementary Figure 6).
Studies by age
3.5
Five studies reported depression physicians age. Four studies reported higher levels of depression in older physicians (after combining the 30–39 and >=40 age categories given by Yahaya et al.) (29, 34, 40, 53). However, Ruitenburg et al. found lower levels of depression in younger (20–35-year-old doctors) and older (>=56 years old) physicians than compared to their colleagues aged 36-55 (34). Conversely, Mousa et al. reported lower levels of depression among older physicians compared to younger, with variability between age categories (51) (Table 3). Due to the large heterogeneity between the included studies and the lack of individual participant data being reported, a meta-analysis was not conducted.
Risk of bias assessment
3.6
A modified NOS was used for assessing the quality of both the included cohort and cross-sectional studies (Supplementary Table 1). Overall, 25 studies were marked as having a “High” risk of bias, while 17 were marked as being “Low” risk of bias. This was largely due to many studies being conducted at a single institution, within a single specialty, or with too small a sample size. Furthermore, many studies used self-reported data, which increases the risk of bias.
Discussion
4
This systematic review and meta-analysis included 42 studies encompassing data on more than 50,000 physicians. Variability in study design was observed, with studies predominately being cross-sectional surveys (n=28), prospective cohort (n=13), and retrospective cohort studies (n=1), with a high degree of heterogeneity in methods to assess depression. We found a pooled proportional estimate of 34.2% (95% CI: 26.4-43.0%, 35 studies) among the reported literature. Few studies reported key physician characteristics or provided direct comparisons that could aid in the potential identification of susceptible populations. Among specialties, surgeons reported the highest proportion of depression/depressive symptoms, followed by emergency and internal medicine physicians. No significant differences in depression were identified across physician age groups or by sex.
The studies included in this review utilized 13 different assessment methods, including but not limited to the PRIME-MD, BDI, and variations of the PHQ. While these methods have been validated for assessing depression and depressive symptoms, different cut-off scores were used between the studies observed. For example, Demir et al. used the BDI with a cut-off score of at least 16 to state than an individual has probable depression, while Lin et al. stated that a score between 5–8 indicated mild depression; 8–15 indicated moderate; and score greater than 16 indicated severe depression despite using the same assessment method (29, 32). These discrepancies in cut-off score limit the generalizability of each study and inadvertently may exclude individuals with milder depression/depressive symptoms. In addition, as highlighted by Mata et al., some of these instruments have low specificity and therefore are more commonly used as screening tools rather than clinician-administered assessments (11). Moving forward, the adoption of a single assessment method of screening with an established and strict cut-off score in future studies would facilitate inter-study comparisons.
We report an estimated pooled proportion of 34.2% (95% CI: 26.4-43.0%), with all the meta-analyzed studies finding more than 10% of included individuals screened positive. This estimate is higher than the prevalence previously reported by Mata et al. among residents (28.8%) (7),suggesting that studies published between 2015 and 2020 report a higher prevalence of depression in physicians compared with studies conducted between 2002 and 2015. Our pooled proportion is higher than the estimated 4.4% of the global population being affected with depression and may reflect a true higher prevalence among physicians or the inclusion of less severe depressive symptoms included in physician studies (61). It is important to note that as our review included both clinically diagnosed depression and self-reported depressive symptoms, the pooled proportion is not directly comparable to global prevalence estimates that are based solely on diagnosed depression. Due to limitations of the current literature, a true estimate of the prevalence of depression among the profession remains uncertain.
While all studies included sex in the form of descriptive statistics, only six reported depression or depressive outcomes by sex. We found no statistically significant differences in male compared to female physicians (OR: 0.78; 95% CI: 0.46, 1.31); five studies showed that female physicians were more likely to be depressed or have depressive symptoms, while one study described the opposite trend (21, 29, 34, 40, 53, 58). Among the general population, females have a higher prevalence of depression than compared to males (62). Reasons for this disparity among physicians specifically may be a result of female physicians being less likely to report depression/depressive symptoms due to concerns regarding competency or career advancement, lack of time, or stigma (63).
When assessing resident physicians, we observed a slightly higher estimate of depression and depressive symptoms (36%, 95% CI: 26-47%) than compared to staff physicians (29%, 95% CI:13-53%). However, only two studies provided information on both resident and staff physicians, which found that staff physicians had lower odds of being depressed than residents (OR: 0.66, 95% CI: 0.22, 1.98) (23, 34). When following residents over the course of their training, Rahmati et al. and Campbell et al. found that residents were less likely to be depressed in the third year of residency compared to the first (20, 48). However, when comparing the same populations, Rosen et al. reported the opposite trend (33). Examining changes in depression and depressive symptoms across ages could provide insight into whether certain stages of medical training are associated with higher risk. However, studies that reported age-specific groups were scarce, with no clear discernable age periods identified as higher risk. Longitudinal studies that follow physicians throughout their careers would aid our understanding of the role of depression and depressive symptoms across ages. This is especially important to consider as research in the general population shows that older individuals with major depressive disorder often experience a worse disease course than younger individuals, suggesting the long-term impact of depression in physicians may be especially severe if symptoms continue into later career stages (60).
The rates of depression and depressive symptoms varied heavily between specialties, with the highest reports being amongst radiologists, surgeons, and internal medicine physicians. Commander et al. found that 70.5% of surgeons surveyed were depressed, while Dyrbye et al. found that 30.1% of surgeons were depressed (21, 54). This may be the result of studies using different assessment methods with varying cutoff scores, or due to differences in practicing location and underlying and stress factors. In addition, self-perceived stress, which serves as a key precursor to burnout and depression, is reported to vary considerably between physician specialties (50). Therefore, true differences in depression may exist and require studies with direct comparison between specialties to quantify. This information is important to the medical profession as the identification of high-risk specialties would facilitate directed screening and/or interventions to promote improved well-being.
Finally, stigma surrounding psychological distress and mental illness in healthcare is a significant consideration when assessing our findings. Physicians may be reluctant to acknowledge or report psychological distress (64–66). However, many of the included studies were conducted in anonymized settings, which may have encouraged more true reporting of depressive symptoms. Simultaneously, it must also be considered that over the nearly two-decade study period, there have been significant changes in attitudes toward mental health within the healthcare profession. Changes in increased awareness of mental health and decreased stigma may have influenced both the experience and reporting of depressive symptoms (67). These systematic changes may have contributed to variation in prevalence rates across included studies.
There were several limitations identified in the observed literature on depression and depressive symptoms prior to the COVID-19 pandemic. To begin, studies limited to distinct regions or specific hospitals may be influenced by cultural or institutional factors that are not generalizable to broader physician populations. Next, cross-sectional survey studies, which were the most common study design observed, are at increased risk for non-response bias. This may skew prevalence estimates if those experiencing depressive symptoms were either more or less likely to participate in studies. Next, the heterogeneity in cut-off scores limited the ability to pool or meta-analyze our findings, as variation in individual thresholds introduces uncertainty in comparisons across studies. In addition, the exclusion of non-English studies and grey literature may introduce both language and publication bias, thus leading to either an over- or underestimation of true prevalence. As a result, these findings should be interpreted with caution, as the prevalence estimates may not fully capture unpublished or non-English language data. Furthermore, the tools and definitions used were highly heterogenous, rendering cross comparisons difficult, especially when considering the high proportion of self-reported results. As such, the pooled prevalence estimate reflects both clinically diagnosed depression and self-reported depressive symptoms, based on how each study defined and measured the outcome, which may contribute to variability and limit comparability across studies. Additionally, the 18-year study period spans a time of significant cultural and systemic changes in healthcare, which may have influenced both the prevalence and reporting of depressive symptoms Finally, a limitation of our meta-analysis is the high degree of statistical heterogeneity observed across studies (I² = 98%). This degree of heterogeneity suggests substantial variability in the underlying data, which may be attributable to a variety of factors such as differences in study populations, geographic settings, measurement tools, and definitions of key variables. Although we report a pooled prevalence estimate to provide an overall effect measure, the presence of high heterogeneity limits the generalizability of the pooled estimate; thus, it is important to interpret this value with caution.
Conclusions
5
In this systematic review and meta-analysis examining depression and depressive symptoms among physicians, we report a pooled estimate of 34% prior to the COVID-19 pandemic. Most studies were cross-sectional and survey based, with a large degree of heterogeneity in the assessment tools used and defined cut-off scores. Studies lacked appropriate stratification and comparison by age, sex, physician specialty, and training stage, rendering the identification of key subgroups at risk difficult. The information presented in this review can serve as a baseline to compare changes that occurred in physician depression and depressive symptoms as a result of the COVID-19 pandemic. These findings underscore the need for targeted multifaceted interventions, including screening policies, workplace mental health initiatives, and support systems, uniquely tailored to physicians’ sex, stage of training, and specialty. Further population-based cohort studies with robust methodologies are required to determine the true prevalence of depression within physician populations.
The reference list from the paper itself. Each links out to its DOI / PubMed record.
- 1Santomauro DF Mantilla Herrera AM Shadid J Zheng P Ashbaugh C Pigott DM . Global prevalence and burden of depressive and anxiety disorders in 204 countries and territories in 2020 due to the COVID-19 pandemic. Lancet. (2021) 398:1700–12. doi: 10.1016/S 0140-6736(21)02143-7, PMID: 34634250 PMC 8500697 · doi ↗ · pubmed ↗
- 2Cotobal Rodeles S Martín Sánchez FJ Martínez-Sellés M . Physician and medical student burnout, a narrative literature review: challenges, strategies, and a call to action. J Clin Med. (2025) 14:2263. doi: 10.3390/jcm 14072263, PMID: 40217713 PMC 11989521 · doi ↗ · pubmed ↗
- 3Olson KD . Physician burnout—A leading indicator of health system performance? Mayo Clin Proc. (2017) 92:1608–11. doi: 10.1016/j.mayocp.2017.09.008, PMID: 29101929 · doi ↗ · pubmed ↗
- 4Liu Q He H Yang J Feng X Zhao F Lyu J . Changes in the global burden of depression from 1990 to 2017: Findings from the Global Burden of Disease study. J Psychiatr Res. (2020) 126:134–40. doi: 10.1016/j.jpsychires.2019.08.002, PMID: 31439359 · doi ↗ · pubmed ↗
- 5West CP Dyrbye LN Shanafelt TD . Physician burnout: contributors, consequences and solutions. J Intern Med. (2018) 283:516–29. doi: 10.1111/joim.12752, PMID: 29505159 · doi ↗ · pubmed ↗
- 6Hawton K Casañas i Comabella C Haw C Saunders K . Risk factors for suicide in individuals with depression: A systematic review. J Affect Disord. (2013) 147:17–28. doi: 10.1016/j.jad.2013.01.004, PMID: 23411024 · doi ↗ · pubmed ↗
- 7Zisook S Doran N Mortali M Tilstra S Balasanova AA Baweja R . Relationship between burnout and Major Depressive Disorder in health professionals: A HEAR report. J Affect Disord. (2022) 312:259–67. doi: 10.1016/j.jad.2022.06.047, PMID: 35760197 · doi ↗ · pubmed ↗
- 8Yaghmour NA Brigham TP Richter T Miller RS Philibert I Baldwin DC Jr . Causes of death of residents in ACGME-accredited programs 2000 through 2014: implications for the learning environment. Acad Med. (2017) 92:976–83. doi: 10.1097/ACM.0000000000001736, PMID: 28514230 PMC 5483979 · doi ↗ · pubmed ↗