Discrepancies in isoniazid susceptibility profiles: Bactec MGIT 960-resistant but GenoType MTBDRplus-susceptible Mycobacterium tuberculosis strains in Hunan, China
Zhenhua Chen, Peilei Hu, Jingwei Guo, Jue Wang, Binbin Liu, Yunhong Tan

TL;DR
This study explores why two drug tests give conflicting results for isoniazid resistance in tuberculosis bacteria from China, pointing to uncertain genetic variants as a key cause.
Contribution
The study identifies variants of uncertain significance as a major source of discordant isoniazid resistance testing in Mycobacterium tuberculosis.
Findings
Only five of 53 strains had known resistance-conferring variants.
44 strains carried 70 uncertain-significance variants across nine genes.
No significant difference in high-level resistance was found between bacterial lineages.
Abstract
Discordant drug susceptibility testing (DST) results between the Bactec MGIT 960 system (MGIT) and the GenoType MTBDRplus assay (MTBDRplus) for isoniazid (INH) complicate clinical decision-making. In this study, we performed minimum inhibitory concentration (MIC) assays and whole-genome sequencing (WGS) on 53 Mycobacterium tuberculosis strains identified as INH-resistant by MGIT but INH-susceptible by MTBDRplus. The variants conferring INH resistance were evaluated by the WHO mutation catalogue. Our results showed that only five strains carried variants classified as “associated with resistance” (Group 1/2), including katG Trp39STOP, katG Ser315Asn, inhA −154G>A, and inhA Ser94Ala. In addition, 44 strains carried 70 variants classified as “Group 3: Uncertain significance” across nine genes, including katG, ahpC, inhA, Rv0010c, Rv1129c, Rv2752c, mshA, dnaA, and Rv1258c. The remaining…
Genes, proteins, chemicals, diseases, species, mutations and cell lines named across the full text — each resolved to its canonical identifier and authoritative record.
Click any figure to enlarge with its caption.
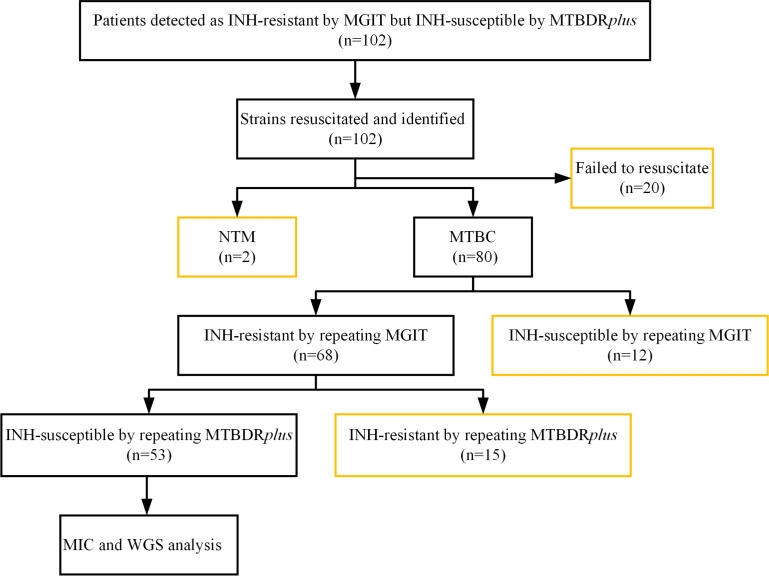 Fig 1
Fig 1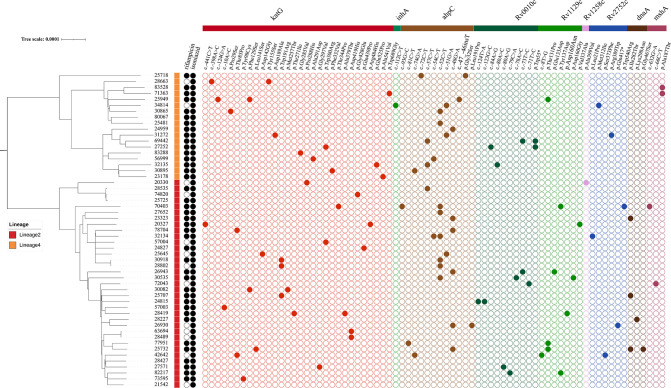 Fig 2
Fig 2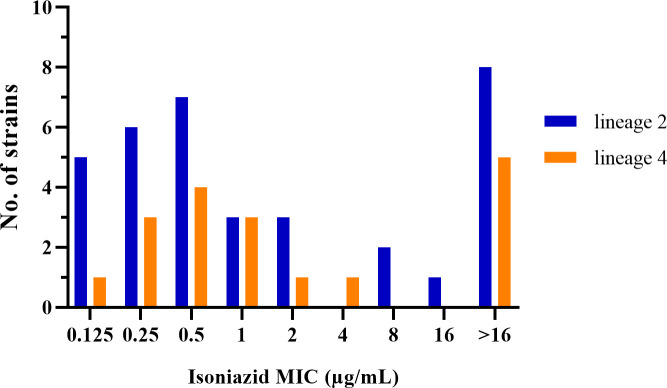 Fig 3
Fig 3| Resistant level | Sample ID |
|
|
|
|
|
|
|
| MIC (µg/mL) |
|---|---|---|---|---|---|---|---|---|---|---|
| Low | 25707 | Trp191Arg | −154G>A | – | Ile282Thr | Ala187Val | – | −28T>C | Glu194fs | 0.125 |
| Low | 28489 | Asp419His | Ser94Ala | – | – | Ala187Val | – | −28T>C | Glu194fs | 0.25 |
| Low | 63694 | Arg463Leu/Asp419His | Ser94Ala | – | – | Ala187Val | – | −28T>C | Glu194fs | 0.25 |
| High | 24959 | Trp39STOP | – | −48G>A | – | – | – | – | – | >16 |
| High | 72043 | Ser315Asn | – | – | – | −66C>T | −71T>C | −28T>C | Glu194fs | 2 |
| Resistant level | Sample ID |
|
|
|
|
|
|
|
|
| MIC(µg/mL) |
|---|---|---|---|---|---|---|---|---|---|---|---|
| Low | 20327 | −441C>T | – | – | – | – | – | Val337Alac | Glu194fs | – | 0.5 |
| Low | 20330 | Pro288His | – | – | – | – | – | −28T>C | Ala399Val | – | 0.125 |
| Low | 24815 | Arg463Leu | – | – | – | Ala187Val | −123G>C | −28T>C | Glu194fs | – | 0.5 |
| Low | 25481 | – | – | −52C>T | – | – | – | – | – | Met31Ile | 0.5 |
| Low | 25718 | – | – | Gly32Ser | – | – | – | – | – | – | 0.25 |
| Low | 25732 | Leu141Ser | – | −48G>A | Gly467Ser | Ala187Val | – | Thr131Pro | Glu194fs | – | 0.25 |
| Low | 25949 | −124G>A | – | −47_−46insT | – | – | – | Thr131Pro | – | Met31Ile | 0.125 |
| Low | 27252 | Trp300Arg | – | – | – | – | Trp55STOP | – | – | – | 0.5 |
| Low | 28663 | −398A>C | – | – | – | – | – | – | – | Met31Ile | 0.25 |
| Low | 28802 | Trp191Arg | – | −52C>T | – | – | – | −28T>C | Glu194fs | – | 0.125 |
| Low | 30082 | Phe129Ser | – | – | – | Ala187Val | – | −28T>C | Glu194fs | – | 0.25 |
| Low | 30895 | Phe332Val | – | −74G>A | – | – | – | – | – | – | 0.25 |
| Low | 30918 | Trp191Arg | – | −52C>T | – | – | – | −28T> C | Glu194fs | – | 0.125 |
| Low | 32134 | Arg463Leu/Val1Ala | – | −52C>T | – | – | – | −28T>C | Glu194fs | Leu21Pro | 0.25 |
| Low | 57003 | −10A>C | – | – | – | Ala187Val | – | −28T>C | Glu194fs | – | 0.5 |
| Low | 57004 | Trp300Arg | – | – | – | – | – | −28T>C | Glu194fs | – | 0.5 |
| Low | 71363 | Trp689Gly | – | – | – | Ala187Thr | – | – | – | Met31Ile | 0.5 |
| Low | 73595 | Tyr98Cys | – | – | – | Ala187Val | – | −28T>C | Glu194fs | – | 0.25 |
| Low | 74820 | Gly428Glu | – | – | – | – | – | −28T>C | – | – | 0.5 |
| Low | 78704 | Thr85Pro | – | −48G>A | – | – | – | −28T>C | Glu194fs | – | 0.125 |
| Low | 83288 | Gly285Val | – | – | – | – | – | – | – | – | 0.5 |
| High | 23178 | Ala541Val | – | – | – | – | – | - | - | – | 1 |
| High | 23323 | Arg463Leu | – | −48G>A | Ile282Thr | – | – | −28T>C | Glu194fs | – | >16 |
| High | 24827 | Gln439Pro | – | – | – | – | – | −28T>C | Glu194fs | – | 2 |
| High | 25645 | Asp142Gly | – | −51G>A | – | – | – | −28T>C | Glu194fs | – | 8 |
| High | 26930 | Arg463Leu | – | −48G>A | – | Ala187Val | – | −28T>C | Glu194fs | Gln417STOP | >16 |
| High | 26943 | Arg463Leu | – | −48G>A | – | Ala187Val | −73T>C | Glu133Asp | Glu194fs | – | 16 |
| High | 27571 | Gly297Val | – | – | – | Ala187Val | −80A>G | −28T>C | Glu194fs | – | 1 |
| High | 27652 | Arg463Leu | – | −52C>T | – | – | – | −28T>C | Glu194fs | – | >16 |
| High | 28227 | Arg463Leu | – | – | Lys298Asn | Ala187Val | – | −28T>C | Glu194fs | – | >16 |
| High | 28419 | Ala379Thr | – | – | – | Ala187Val | – | Asp160Asn | Glu194fs | – | 1 |
| High | 28535 | Arg463Leu | – | −57C>T | – | – | - | −28T>C | – | – | >16 |
| High | 30535 | Arg463Leu | – | −52C>T | – | Ala187Val | −78A>C | Asp160Gly | Glu194fs | – | >16 |
| High | 30865 | Pro29Ser | – | −52C>T | – | – | – | – | – | Met31Ile | 1 |
| High | 31272 | Asp189Ala | – | −51G>A | – | – | – | – | – | Arg389Trp | >16 |
| High | 32135 | Gln525Pro | – | −57C>T | – | – | −80A>C | – | – | – | 2 |
| High | 34814 | – | −112C>T | −51G>A | – | – | – | – | – | Met312Ile | 1 |
| High | 42642 | Thr85Pro | – | −74G>A | – | Ala187Val | – | −8T>G | Glu194fs | Ser373Phe | 1 |
| High | 56999 | Ala291Asp | – | −54C>T | – | – | – | – | – | – | >16 |
| High | 69442 | Val1Ala | – | −57C>T | – | – | −73T>C | – | – | – | >16 |
| High | 70403 | Thr344Pro | – | −93G>C | – | −632G>A | – | Tyr137Asp | Glu194fs | Trp540Arg | 8 |
| High | 77951 | Arg463Leu | – | −81C>T | – | Ala187Val | – | Thr131Pro | Glu194fs | – | >16 |
| High | 82217 | Arg463Leu | – | – | – | Ala187Val | −79C>A | Tyr137Asp | Glu194fs | – | >16 |
| High | 83528 | – | – | – | – | Ala187Thr | – | – | – | Met31Ile | >16 |
Peer Reviews
No public reviews on file for this paper yet. If you reviewed it on a platform where reviews are public (OpenReview, ICLR, NeurIPS, ICML), you can paste yours below so the community can read it here.
Videos
No videos yet. Explain this paper in a talk, walkthrough, or lecture? Add one.
Taxonomy
TopicsTuberculosis Research and Epidemiology · Mycobacterium research and diagnosis · Pneumocystis jirovecii pneumonia detection and treatment
INTRODUCTION
Isoniazid (INH), a cornerstone of first-line tuberculosis (TB) treatment due to its potent early bactericidal activity, has increasingly shown resistance worldwide. INH resistance, whether occurring alone or in combination with other drugs, has become the most prevalent form of anti-TB drug resistance (1–3). A global surveillance data set reveals significant variations in the prevalence of INH resistance across different regions, ranging from 14% in West/Central Europe and Africa to 30% in Eastern Europe during the period of 1994–2009 (1). Between 2003 and 2017, the global prevalence of INH-resistant, rifampin-susceptible TB (Hr-TB) was 7.4% among new TB cases and 11.4% among previously treated cases, based on data from 156 countries or territories involving 211,753 patients (2). A retrospective cohort study conducted in eastern China (2013–2018) further underscored the clinical significance of Hr-TB, reporting a prevalence of 4.6% (63/1,359) among TB patients (3). Given the poorer treatment outcomes associated with INH-resistant TB compared to drug-susceptible TB (4, 5), the rapid and accurate detection of INH resistance is critical for effective TB management.
The Bactec MGIT 960 system (MGIT) and Genotype MTBDRplus assay (MTBDRplus) are widely used, WHO-recommended methods for DST in the tuberculosis laboratory. The MGIT, a phenotypic DST (pDST) method, serves as the reference standard for detecting INH resistance but is time-consuming and labor-intensive. In contrast, the MTBDRplus, a genotypic DST (gDST) method, offers rapid detection of INH resistance by identifying variants in the katG gene and the promoter region of inhA genes, achieving high specificity (>95%) but variable sensitivity (75%–94%) (6, 7). These differences can lead to discrepancies between the two tests, challenging clinical decision-making. For instance, MTBDRplus may indicate susceptibility to INH, while MGIT detects resistance, creating potential conflicts in interpretation (8, 9).
Several factors may contribute to these discrepancies between MTBDRplus and MGIT. First, while MTBDRplus detects INH resistance-associated mutations in the katG gene and inhA promoter region, certain resistance-conferring variants within these regions are not covered by the MTBDRplus probes, potentially leading to false-susceptible results (10, 11). Furthermore, in cases of INH heteroresistance, where patients harbor mixed populations of INH-susceptible and INH-resistant Mycobacterium tuberculosis (MTB), conventional DST remains the most sensitive method for detection, whereas the MTBDRplus lacks the analytical sensitivity to reliably detect resistant subpopulations at the clinically relevant threshold of 1% (12).
Although previous studies have investigated the inconsistencies between pDST and gDST in detecting INH resistance (8, 11, 12), the genetic determinants responsible for strains reported as INH-resistant by MGIT but INH-susceptible by MTBDRplus remain incompletely understood. This study, therefore, aims to investigate the genetic determinants driving these discrepancies by integrating clinical data, MIC testing, and WGS of these specific clinical MTB isolates, with the potential to uncover novel genetic determinants contributing to these discordant results.
MATERIALS AND METHODS
Study design
Between October 2014 and September 2021, we enrolled MTB-positive cases identified by MGIT culture from TB patients previously classified as INH-resistant by MGIT but INH-susceptible by the MTBDRplus. Relevant sociodemographic and clinical data, including gender, age, treatment history, infection sites, and biological samples, were collected. If multiple MTB strains were isolated from the same patient, only the first strain isolated during the study period was included. All strains were stored at −80°C in tryptic soy broth with 10% glycerol before use. To ensure accuracy, strains were retested using both MGIT and MTBDRplus for DST confirmation, followed by WGS and MIC, to investigate the basis of the discordant results.
DST by MGIT
Bacterial growth from Middlebrook 7H10 medium was used to prepare the inoculum. After incubation at 36 ± 1°C for approximately 21 days, fresh colonies were collected using a sterile 10 µL loop. These colonies were then transferred into a sterile bottle containing glass beads and 100 µL of 0.05% Tween 80. The bacterial clumps were dispersed by vortexing for 30 seconds and suspended in 3 mL of saline. After settling for 10–15 minutes, the upper 0.5 mL was used to measure bacterial concentration, adjusted to a McFarland turbidity of 0.5, and diluted 1:5 in sterile saline. The prepared inoculum was used for MGIT INH DST according to the manufacturer’s instructions for the Bactec MGIT 960 SIRE Kit (Becton, Dickinson and Company, Sparks, MD, USA), with a critical isoniazid (INH) concentration of 0.1 µg/mL. Quality control was conducted using MTB H37Rv (ATCC 27294) in each test batch.
DST by MTBDRplus
The MTBDRplus assay was performed on the recovered MTB strains according to the manufacturer’s instructions (Hain Lifescience, Germany). The procedure involved a series of steps, including DNA extraction, preparation of the master mix, multiplex PCR amplification, and reverse hybridization. Throughout the experimental process, sterile nuclease-free water was used as the negative control, and all steps were conducted in separate rooms to prevent cross-contamination. A result was considered valid if all expected control bands were present; otherwise, it was labeled as invalid. The absence of at least one wild-type band or the presence of bands indicating a variant in each drug resistance–related gene suggested that the strain was resistant to a specific antibiotic. In contrast, if all wild-type probes of a gene stained positive and no detectable variants were found within the examined region, the strain was deemed susceptible to the respective antibiotic.
MIC
The MIC-based pDST for INH was conducted using Middlebrook 7H9 Broth Microdilution (BMD) plates, following WHO guidelines (13). Each strain was tested in duplicate on BMD plates, with MTB H37Rv serving as the control. Briefly, the recovered strains were harvested from Middlebrook 7H10 medium, suspended in saline–Tween with glass beads for agitation, and the supernatant turbidity was standardized to 0.5 McFarland. The bacterial suspension was then diluted 1:100 with Middlebrook 7H9 broth supplemented with 10% oleic acid–albumin–dextrose–catalase (OADC). Subsequently, 100 µL of this mixture was added to the wells of a 96-well cell culture plate containing dried INH (BASO Company, Zhuhai, China). INH concentrations in Middlebrook 7H9 medium were as follows: 0.03, 0.06, 0.125, 0.25, 0.5, 1.0, 2.0, 4.0, 8.0, and 16.0 µg/mL. Quality control for each strain included one negative growth control well and two positive control wells (100% and 1% inoculum of the 0.5 McFarland standard suspension) in drug-free control wells. Plates were sealed with plastic covers and incubated at 37°C in ambient air for 7 to 21 days. Readings were performed once the 1% and 100% control wells exhibited visible growth, while the negative control did not. The MIC was determined as the lowest concentration at which no visual growth was observed. Strains with a MIC greater than or equal to 1 µg/mL were classified as exhibiting high-level resistance to INH (14), whereas those with MICs ranging from 0.125 to 0.5 µg/mL (inclusive) were classified as having low-level resistance to INH.
WGS and bioinformatics analysis
Extraction and purification of genomic DNA were carried out following the Bacterial DNA Extraction Kit (Gene-Optimal, 60,300K-50 T) protocols. All WGS procedures were performed by Shanghai Gene-Optimal Science & Technology (Shanghai, China). DNA libraries were prepared using the FS DNA Library Prep Kit V6 (RK20259) on the Illumina platform. Indexed libraries were pooled and loaded onto an Illumina HiSeq instrument according to the manufacturer’s instructions (Illumina, San Diego, CA, USA). Paired-end 150 bp (PE150) sequencing was performed on the Illumina NovaSeq 6000 platform following library quality control. Raw FASTQ sequences were filtered using Fastp (v0.20.0) to remove adapter sequences, duplicate reads, and low-quality reads. The cleaned reads were aligned to the MTB H37Rv reference genome (NC_000962.3) using BWA (v0.7.17) and SAMtools (v1.7). Single-nucleotide polymorphisms (SNPs) were called using Freebayes (v1.3.2) with a minimum coverage of 10 reads and a mapping quality score ≥100. An in-house script was used to extract SNP sequences and calculate pairwise distances between samples. The core genome was obtained using the snippy-core plugin (v4.4.3) after masking short tandem repeat genes (e.g., PE/PPE). Multiple sequence alignment was performed with Gubbins (v2.4.1), followed by reconstruction of the maximum likelihood (ML) phylogenetic tree using IQ-TREE (v2.1.4). INH resistance-associated variants were primarily identified by comparison with the WHO mutation catalogue (15). Additional resistance-associated variants not yet included in the WHO catalogue, as well as strain lineages, were identified by analyzing BAM files using TB-Profiler (v6.3.0, https://github.com/jodyphelan/TBProfiler).
Statistical analysis
All statistical analyses were performed using IBM SPSS (version 20.0; IBM Corporation, Armonk, NY, USA). The Pearson chi-squared test was used to assess associations between strain lineages and resistance levels. In addition, an independent two-tailed Student’s t-test was performed to assess the relationship between the number of genetic variants and resistance levels. A P-value less than 0.05 was considered statistically significant.
RESULTS
Patient demographics
Of the 102 patients classified as INH-resistant by MGIT but INH-susceptible by MTBDRplus, a total of 53 patients were included for analysis, including 41 males (77.4%, 41/53) and 12 females (22.6%, 12/53). The median age was 52 years (interquartile range: 46–62 years). Among the patients, five (9.4%, 5/53) were new cases, and 48 (90.6%, 48/53) were retreated cases. Multidrug-resistant tuberculosis (MDR-TB) was identified in 40 cases (75.5%, 40/53). Of the strains, 49 (92.5%, 49/53) were isolated from sputum samples, while the remaining 4 (7.5%, 4/53) were obtained from bronchoalveolar lavage fluid. A total of 49 patients were excluded from the study due to a variety of reasons (Fig. 1)
Study flowchart. Orange outlines of boxes indicate excluded cases. INH, isoniazid. NTM, nontuberculous mycobacteria. MTBC, Mycobacterium tuberculosis complex. MIC, minimum inhibitory concentration. WGS, whole-genome sequencing.
Lineage and genetic distance based on WGS
Phylogenetic analysis based on WGS for 53 MTB strains revealed two major lineages, lineage 2 and lineage 4 (Fig. 2). A total of 35 strains (66.0%, 35/53) belonged to the predominant lineage 2 (mainly East Asian), including 31 (58.5%, 31/53) sublineage 2.2.1 strains and 4 (7.5%, 4/53) sublineage 2.2.2 strains. Eighteen (34.0%, 18/53) strains belonged to lineage 4 (mainly Euro-American), including 1 (1.9%, 1/53) sublineage 4.2.2 strain, 7 (13.2%, 7/53) sublineage 4.4.2 strains, 1 (1.9%, 1/53) sublineage 4.4 strain, and 9 (17.0%, 9/53) sublineage 4.5 strains.
Phylogenetic analysis of 53 Mycobacterium tuberculosis strains with corresponding drug resistance profiles and mutations in Group 3: uncertain significance. Black solid circles denote resistant phenotypes tested by MGIT 960, while black open circles indicate susceptible phenotypes. Colored solid circles indicate the presence of a mutation.
Pairwise genetic distance analysis classified six strains into three clusters (clustering rate: 11.3%, 6/53), based on a genetic distance threshold of fewer than 12 SNPs. All clustered strains belonged to lineage 2. Among these clustered strains, two were isolated from new TB patients, while four were from previously treated patients.
MIC distribution
The median MIC for INH among the 53 strains was 1 µg/mL. High-level INH resistance (MIC ≥1 µg/mL) was observed in 27 strains (50.9%, 27/53), with 13 strains exceeding 16 µg/mL. Specifically, lineage 2 strains exhibited a median MIC of 0.5 µg/mL, with 17 (48.6%, 17/35) showing high-level resistance, while lineage 4 strains had a median MIC of 1 µg/mL, with 10 (55.6%, 10/18) showing high-level resistance. No significant difference in the prevalence of high-level INH resistance was observed between two lineages (χ² = 0.232, P = 0.630) (Fig. 3).
Minimum inhibitory concentration distributions of isoniazid by lineage for 53 Mycobacterium tuberculosis strains exhibiting discordant susceptibility profiles (INH-resistant by MGIT 960 but INH-susceptible by MTBDRplus).
Variants associated with INH resistance in 53 strains
In total, 83 variants were identified across nine genes associated with INH resistance, including katG, ahpC, inhA, Rv0010c, Rv1129c, Rv2752c, mshA, dnaA, and Rv1258c. Of the 83 variants, all but one variant (katG Val1Ala) were included in the WHO catalogue. The 82 catalogue-listed variants were categorized as follows: two (katG Ser315Asn and inhA −154G>A) in group 1, two (katG Trp39STOP and inhA Ser94Ala) in group 2, 73 in group 3, one in group 4, and four in group 5.
Among the 53 strains, only five carried variants classified as “associated with resistance” (Groups 1 and 2), including katG Trp39STOP, katG Ser315Asn, inhA −154G>A, and inhA Ser94Ala (Table 1). The frequency of katG Trp39STOP and katG Ser315Asn was 98.8% and 42.0%, respectively. In addition, 44 strains carried 70 variants classified as “uncertain significance” (Group 3) (Table 2). The remaining four strains lacked variants from Groups 1 to 3 but carried only variants classified as “not associated with resistance” (Groups 4 and 5) (Table S1).
DISCUSSION
In this study, we investigated the genetic determinants causing the discrepancies between pDST and gDST for INH in clinical MTBC strains. Our results showed that 53 strains harbored 83 variants across nine genes associated with INH resistance. However, only five strains carried variants included in WHO catalogue Groups 1 and 2 (Table 1), specifically katG Ser315Asn, katG Trp39STOP, inhA −154G>A, and inhA Ser94Ala, which should be interpreted as markers of clinically relevant phenotypic INH resistance (15). It also should be noted that all of these variants, including katG Ser315Asn, were not covered by the MTBDRplus probes, which may explain the observed discrepancies between pDST and gDST for INH.
Among 44 strains lacking Group 1 and 2 variants but carrying variants belonging to WHO catalogue Group 3 (Table 2), two strains (32134 and 69442) also carried variant katG Val1Ala, which is not listed in the WHO catalogue but included in TB-Profiler. This variant is located at the N-terminus of KatG and may reduce KatG levels and peroxidase activity (16). Since INH is a prodrug that needs to be activated by KatG (17), we speculated that the low levels of KatG might lead to phenotypic INH resistance.
Previous studies have demonstrated that INH resistance is mainly associated with variants in katG, inhA and its promoter region, and ahpC and its promoter region (18). Among the 44 strains here, most carried variants in these genes or their promoter regions (Table 2). Notably, the katG gene and the promoter region of ahpC exhibited the highest variant frequencies; however, the association of these variants with phenotypic INH resistance remains unclear based on the current WHO mutation catalogue (15). Further investigation is required to elucidate the role of these variants, particularly those in the katG and the ahpC promoter region, in conferring INH resistance.
A nationwide survey conducted in China in 2007 on the prevalence of drug-resistant tuberculosis reported that mutations in the ahpC-oxyR intergenic region were identified in 18.6% (35/188) of INH-resistant strains (19). Notably, 85.7% (30/35) of these strains also carried additional mutations in katG or other genes. Nevertheless, the potential regional significance of ahpC-oxyR intergenic region mutations in the mechanisms of INH resistance remains an important consideration. However, widely used molecular assays like MTBDRplus are limited to detecting variants in the katG and inhA genes, excluding ahpC. This study highlights the potential value of detecting ahpC variants and suggests that MeltPro TB, which can detect ahpC variants (20), may be a more comprehensive and suitable test for accurately identifying INH resistance in China (20).
In addition to these well-characterized variants, other variants in genes, including but not limited to efpA, fadE24, kasA, nat, dnaA, Rv0010c, mshA, hadA, Rv1129c, Rv1258c, ndh, Rv2752c, and glpK, are also found to be associated with INH resistance (21–27). While the specific biological functions of some of these genes remain incompletely understood, they are hypothesized to play roles in influencing drug metabolism, altering drug targets, and modifying cell wall synthesis, which might affect INH drug resistance or tolerance. For example, variants in kasA, a gene involved in meromycolic acid biosynthesis, can reduce INH binding to its target, leading to resistance (28). Similarly, variants in ndh, which encodes NADH dehydrogenase, may inhibit INH activation by KatG, contributing to tolerance (29). In this study, variants in mshA, dnaA, Rv0010c, Rv1129c, Rv1258c, and Rv2752c were detected, suggesting their potential involvement in INH resistance pathways.
Our results showed that strains often carry multiple variants associated with INH resistance, and we identified 15 specific variants (e.g., katG Arg463Leu) that are present in both high- and low-level INH-resistant strains. This overlap makes it difficult to identify variants that specifically confer high or low levels of INH resistance (30). Previous studies have suggested that the accumulation of variants in genes, such as katG, inhA, and ahpC, may correlate with increased INH resistance (19, 31). However, our analysis comparing the number of variants between the high- and low-level INH-resistant strains using a t-test did not show a statistically significant difference (t = 0.231, P = 0.818). It should be noted that the resistance levels in this study were quantified using the MIC testing method, which was not intended to validate phenotypic DST classifications. For instance, six strains (20330, 25707, 25949, 28802, 30918, and 78704) with INH MICs of 0.125 µg/mL were found to be phenotypically resistant by MGIT 960 testing, yet were classified as susceptible based on MIC testing according to the WHO-recommended critical concentration (13). This discrepancy likely reflects inherent methodological differences between the two testing approaches.
The limited sensitivity of the current molecular methods for detecting heteroresistance, e.g., the MTBDRplus assay requires resistant subpopulations to exceed 5% for reliable identification (12), makes heteroresistance a critical factor contributing to discrepancies between pDST and gDST. In this study, WGS revealed 21 variants with frequencies ranging from 10.8% to 99.0% across 18 strains (34.0%, 18/53), indicating the prevalence of heteroresistance in this population. However, in the case of strain 72043, while sequencing revealed a katG Ser315Asn variant at 42% frequency, the MTBDRplus assay failed to detect INH resistance. This discrepancy likely reflects technical limitations of the assay rather than true heteroresistance (11). These findings highlight the need for more sensitive diagnostic tools to accurately detect heteroresistance in clinical strains (21, 32).
Our results also showed that six strains exhibited a genetic distance of fewer than 12 SNPs, suggesting recent transmission. However, epidemiological investigations and case interviews did not confirm direct transmission links among these individuals. Notably, four variants, including katG Arg463Leu, Rv1129c −28T>C, Rv1258c Glu194fs, and mshA Ala187Val, were present exclusively in lineage 2 strains. This lineage-specific distribution suggests distinct genetic adaptations and selective pressures between the lineage 2 and lineage 4 populations (33).
This study has several limitations. First, the single-center design and relatively small sample size may restrict the generalizability of our findings. Second, our analysis focused on genes listed in the WHO variant catalogue, potentially leading to the oversight of other resistance mechanisms, such as efflux pump overexpression (e.g., Rv1218c) (34, 35). Finally, although WGS identified multiple resistance-associated variants, the functional interactions among these variants remain unclear and necessitate further investigation through gene knockout and complementation studies.
In conclusion, our study revealed that the variants classified as “Group 3: uncertain significance” may be the main genetic determinants causing discordant INH DST results (INH-resistant by MGIT but INH-susceptible by MTBDRplus), highlighting their associations with INH resistance that need to be further investigated. In addition, this study emphasizes the importance of integrating advanced sequencing tools into DST to improve the accuracy of INH resistance detection, ultimately enhancing clinical decision-making and supporting the global fight against drug-resistant TB.
The reference list from the paper itself. Each links out to its DOI / PubMed record.
- 1Jenkins HE, Zignol M, Cohen T. 2011. Quantifying the burden and trends of isoniazid resistant tuberculosis, 1994-2009. P Lo S One 6:e 22927. doi:10.1371/journal.pone.002292721829557 PMC 3146514 · doi ↗ · pubmed ↗
- 2Dean AS, Zignol M, Cabibbe AM, Falzon D, Glaziou P, Cirillo DM, Köser CU, Gonzalez-Angulo LY, Tosas-Auget O, Ismail N, Tahseen S, Ama MCG, Skrahina A, Alikhanova N, Kamal SMM, Floyd K. 2020. Prevalence and genetic profiles of isoniazid resistance in tuberculosis patients: a multicountry analysis of cross-sectional data. P Lo S Med 17:e 1003008. doi:10.1371/journal.pmed.100300831961877 PMC 6974034 · doi ↗ · pubmed ↗
- 3Shao Y, Li Y, Song H, Li G, Li Y, Zhu L, Lu W, Chen C. 2020. A retrospective cohort study of isoniazid-resistant tuberculosis treatment outcomes and isoniazid resistance-associated mutations in eastern China from 2013 to 2018. J Glob Antimicrob Resist 22:847–853. doi:10.1016/j.jgar.2020.07.01232739538 · doi ↗ · pubmed ↗
- 4Bahuaud O, Genestet C, Hodille E, Vallée M, Testard Q, Tataï C, Saison J, Rasigade J-P, Lina G, Ader F, Dumitrescu O, Lyon TB study group. 2024. Rapid resistance detection is reliable for prompt adaptation of isoniazid resistant tuberculosis management. Heliyon 10:e 29932. doi:10.1016/j.heliyon.2024.e 2993238726207 PMC 11078763 · doi ↗ · pubmed ↗
- 5Shao Y, Song W, Song H, Li G, Zhu L, Liu Q, Chen C. 2024. Incidence, outcomes, and risk factors for isoniazid-resistant tuberculosis from 2012 to 2022 in Eastern China. Antibiotics (Basel) 13:378. doi:10.3390/antibiotics 1304037838667054 PMC 11047343 · doi ↗ · pubmed ↗
- 6Bedewi Omer Z, Mekonnen Y, Worku A, Zewde A, Medhin G, Mohammed T, Pieper R, Ameni G. 2016. Evaluation of the Geno Type MTBD Rplus assay for detection of rifampicin- and isoniazid-resistant Mycobacterium tuberculosis isolates in central Ethiopia. Int J Mycobacteriol 5:475–481. doi:10.1016/j.ijmyco.2016.06.00527931690 · doi ↗ · pubmed ↗
- 7Moga S, Bobosha K, Fikadu D, Zerihun B, Diriba G, Amare M, Kempker RR, Blumberg HM, Abebe T. 2023. Diagnostic performance of the Geno Type MTBD Rplus VER 2.0 line probe assay for the detection of isoniazid resistant Mycobacterium tuberculosis in Ethiopia. P Lo S One 18:e 0284737. doi:10.1371/journal.pone.028473737099514 PMC 10132600 · doi ↗ · pubmed ↗
- 8Kang JY, Hur J, Kim S, Jeon S, Lee J, Kim YJ, Kim SC, Park YJ, Kim YK, Moon HS. 2019. Clinical implications of discrepant results between genotypic MTBD Rplus and phenotypic Löwenstein-Jensen method for isoniazid or rifampicin drug susceptibility tests in tuberculosis patients. J Thorac Dis 11:400–409. doi:10.21037/jtd.2019.01.5830962983 PMC 6409268 · doi ↗ · pubmed ↗