Ocean currents and environmental gradients shape prokaryotic community structure and function in the South China Sea
Yu Wang, Jinxin Xu, Yanting Liu, Lu Liu, Shicong Xiao, Xiaomeng Wang, Jiandong Zhang, Sijun Huang, Qiang Zheng

TL;DR
Ocean currents and environmental factors like temperature and nutrients shape prokaryotic communities in the South China Sea, influencing their diversity and function.
Contribution
The study reveals that ecological drift and environmental selection jointly drive prokaryotic community assembly in the South China Sea.
Findings
Ocean currents facilitate microbial dispersal, shaping community composition across the South China Sea.
Temperature gradients act as key selective pressures determining which prokaryotic species thrive.
Keystone microbes and biomarkers show adaptability to environmental changes, indicating dynamic community responses.
Abstract
The South China Sea (SCS) is characterized by complex hydrodynamic conditions that influence the structure and function of prokaryotic microbial communities. This study conducted a comprehensive analysis of prokaryotic diversity, community assembly, and functional potential across various water masses within the SCS. Using 16S rRNA gene sequencing and co-occurrence network analyses, we found that geographic distance and environmental gradients, particularly temperature and nutrient levels, significantly impacted community composition. Our findings indicate that ecological drift is the primary mechanism governing community assembly, with spatial turnover primarily driven by the dispersal of microorganisms facilitated by ocean currents. Distinct modules in co-occurrence networks were associated with specific environmental factors, reflecting potential environmental selection processes…
Genes, proteins, chemicals, diseases, species, mutations and cell lines named across the full text — each resolved to its canonical identifier and authoritative record.
Click any figure to enlarge with its caption.
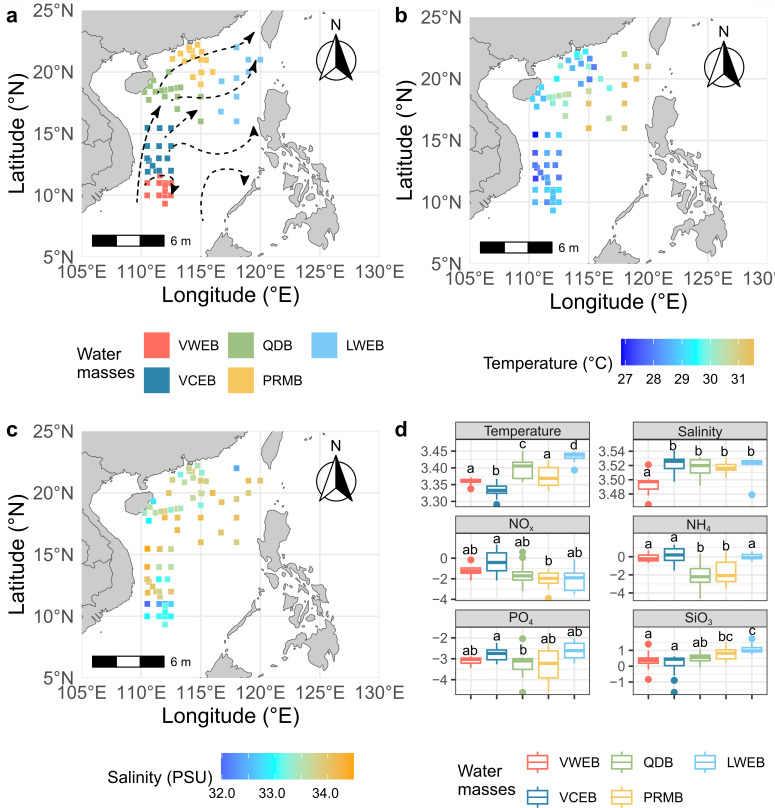 Fig 1
Fig 1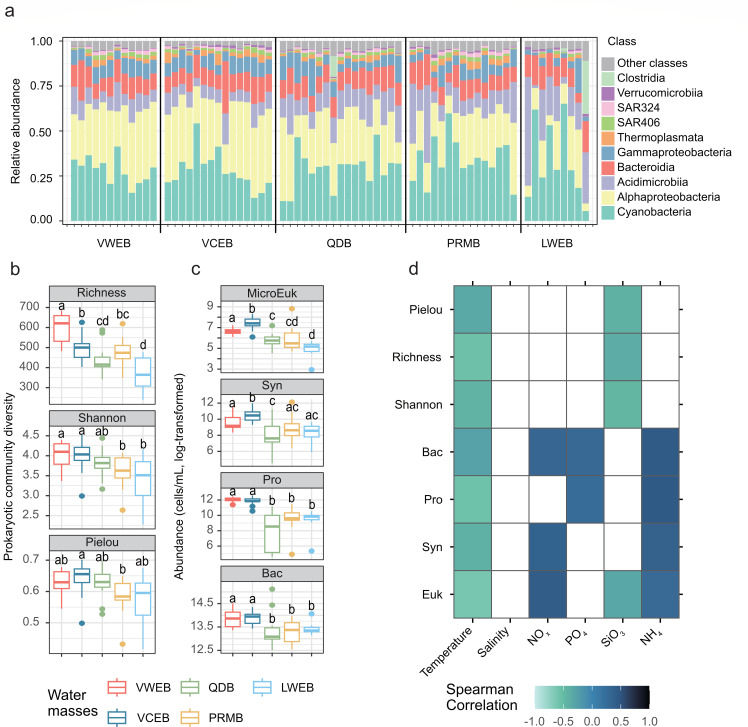 Fig 2
Fig 2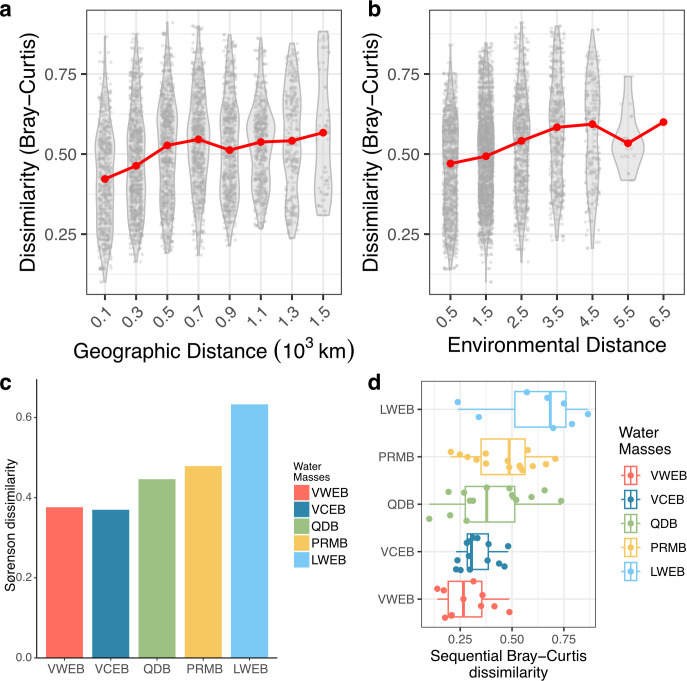 Fig 3
Fig 3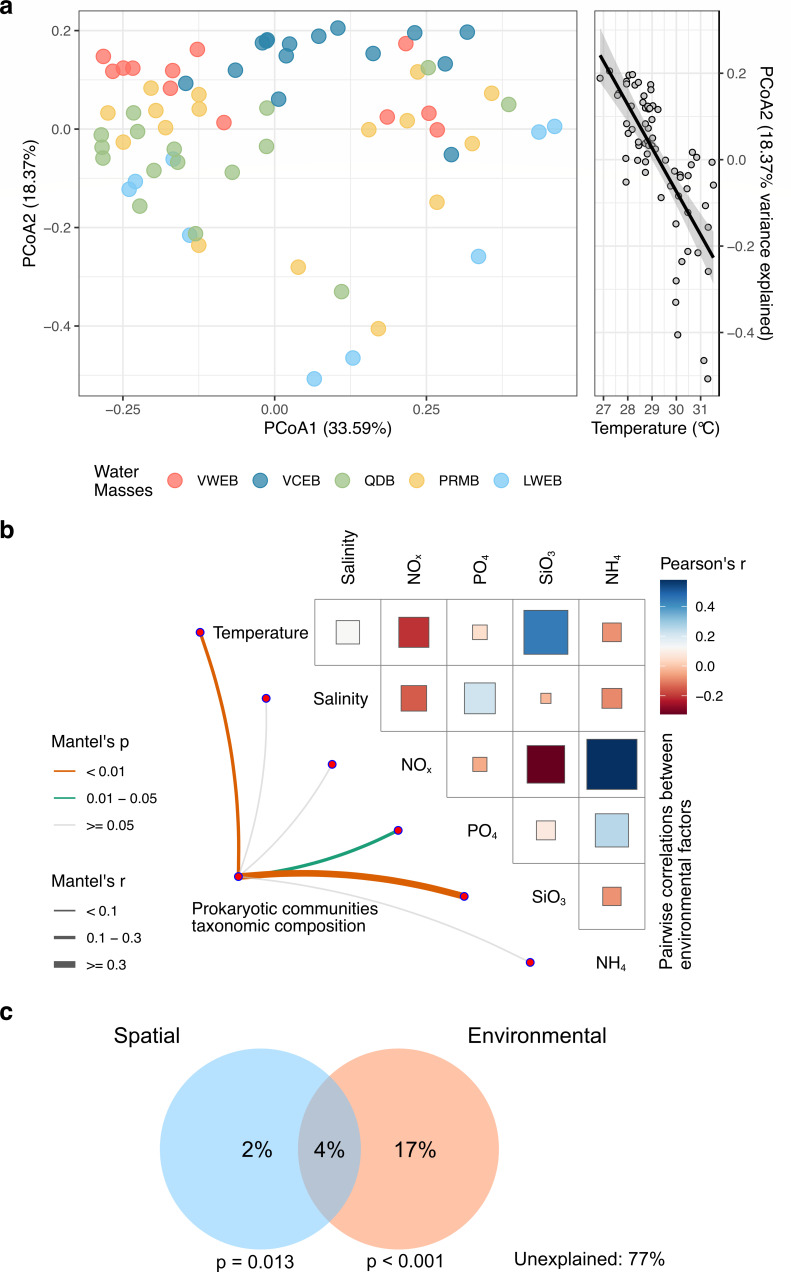 Fig 4
Fig 4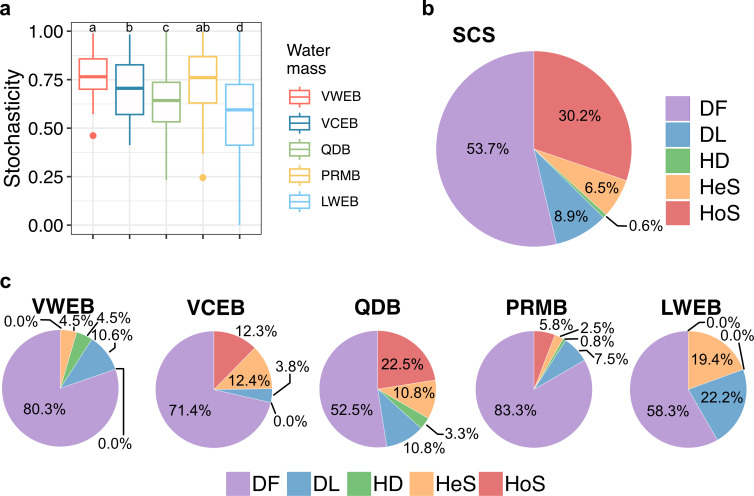 Fig 5
Fig 5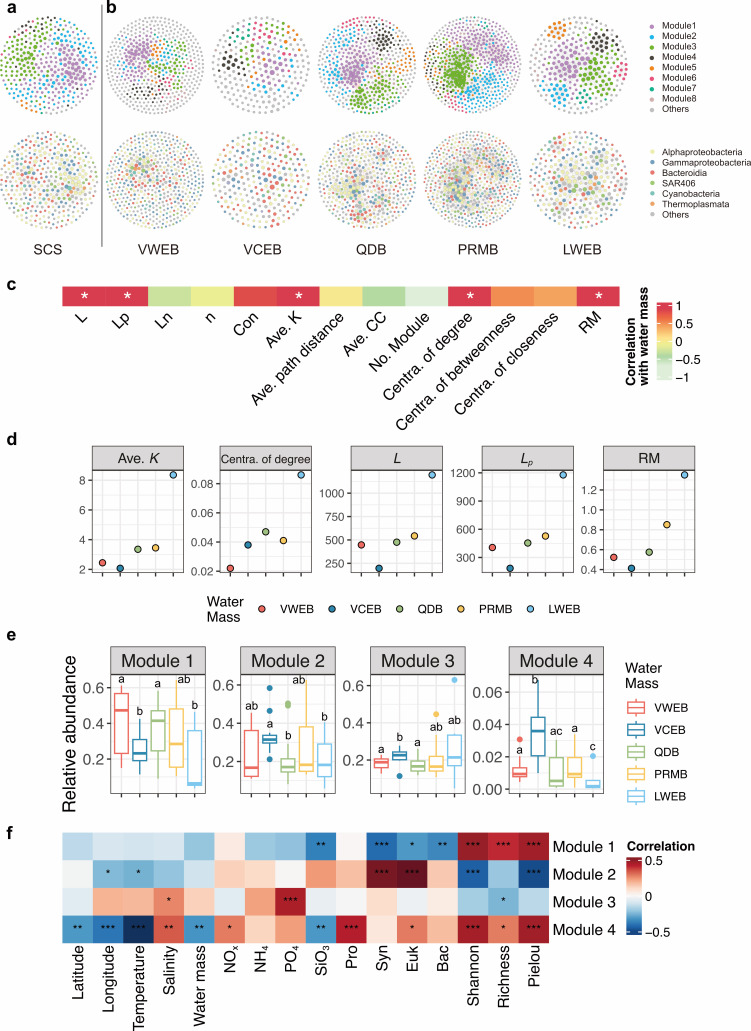 Fig 6
Fig 6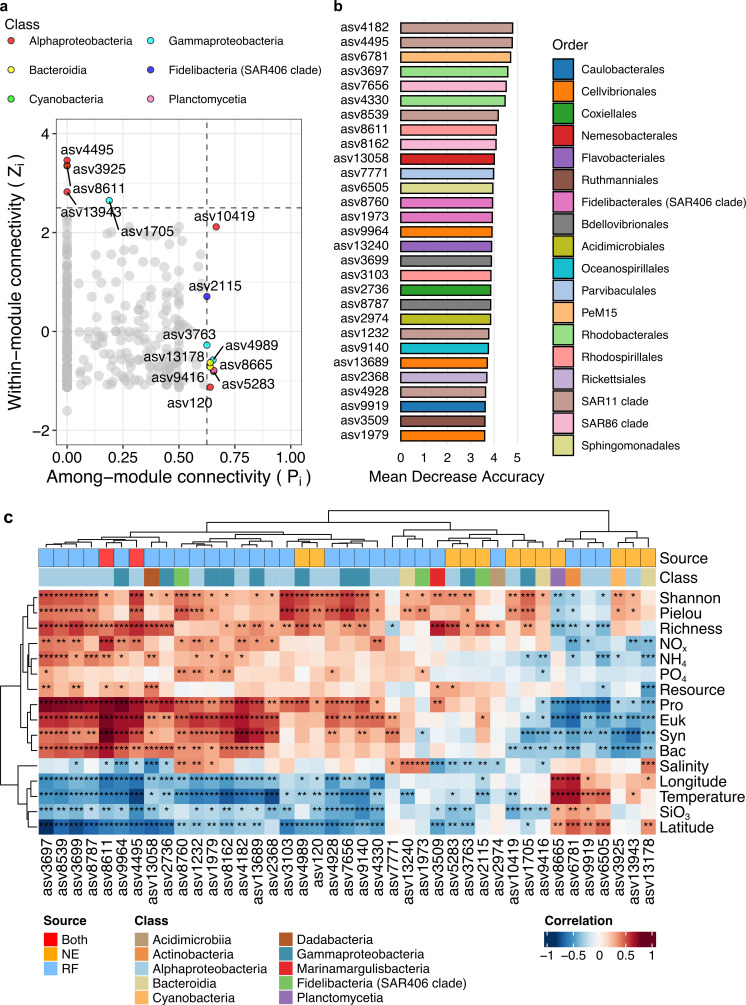 Fig 7
Fig 7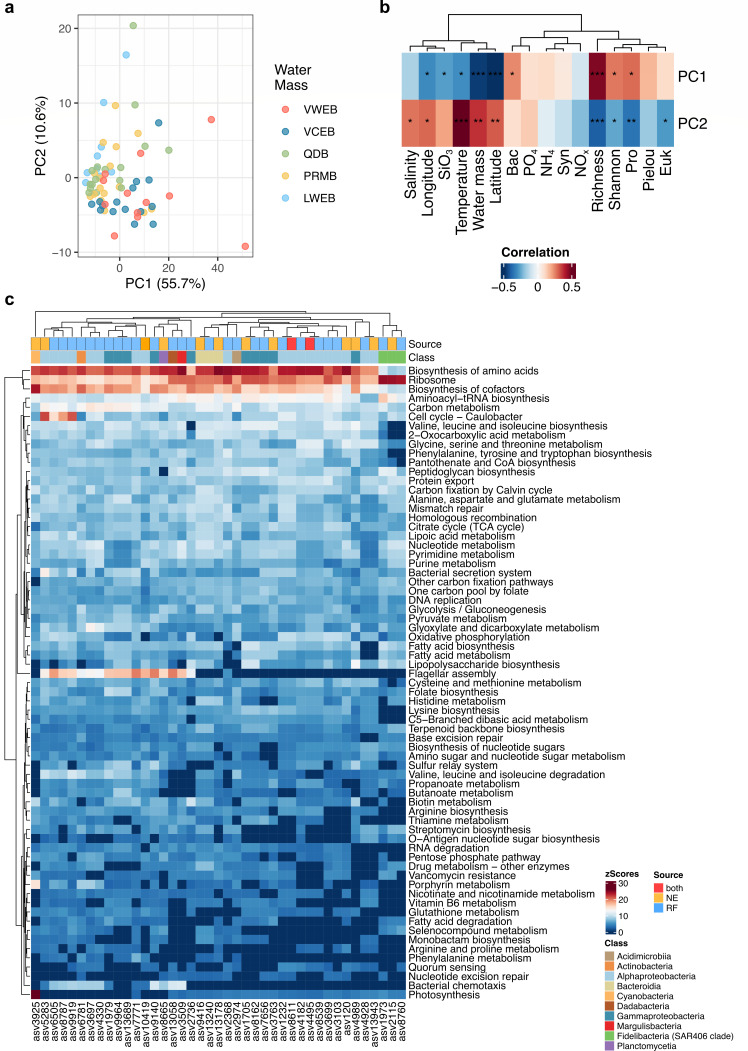 Fig 8
Fig 8- —National Natural Science Foundation of Chinahttp://dx.doi.org/10.13039/501100001809
- —National Natural Science Foundation of Chinahttp://dx.doi.org/10.13039/501100001809
- —China Postdoctoral Science Foundationhttp://dx.doi.org/10.13039/501100002858
- —Fundamental Research Funds for Central Universities of the Central South Universityhttp://dx.doi.org/10.13039/501100012476
- —National Key R&D Program of Chinahttp://dx.doi.org/10.13039/501100012166
Peer Reviews
No public reviews on file for this paper yet. If you reviewed it on a platform where reviews are public (OpenReview, ICLR, NeurIPS, ICML), you can paste yours below so the community can read it here.
Videos
No videos yet. Explain this paper in a talk, walkthrough, or lecture? Add one.
Taxonomy
TopicsMicrobial Community Ecology and Physiology · Gut microbiota and health · Genomics and Phylogenetic Studies
INTRODUCTION
Prokaryotes play a paramount role in marine ecosystems as key drivers in the cycling of major elements such as carbon, nitrogen, and sulfur, thereby forming the foundation of marine microbial food webs (1–3). The structure and diversity of microbial communities not only reflect their ecological functions but also influence primary production, organic matter decomposition, and carbon sequestration (4). Keystone species are crucial components of microbial communities that exert a significant influence on community structure and function, regardless of their abundance (5). Additionally, biomarkers are specific indicators that can distinguish between different microbial communities, such as those in the plastisphere and the aquatic environment, and are identified using models like random-forest machine learning (6). In marine ecosystems, these keystone taxa and biomarkers can drive biogeochemical processes and maintain ecosystem stability (6–8). Identifying and understanding these taxa is vital for predicting ecosystem responses to environmental changes, as they can modulate the effects of disturbances and contribute to the resilience of marine ecosystems (6). Understanding the factors that shape these communities is essential for predicting how marine ecosystems respond to environmental changes (9).
Ocean currents play a crucial role in shaping the diversity and distribution of marine microorganisms by modulating nutrient availability and facilitating the dispersal of species across vast distances (10–12). Currents influence nutrient circulation and productivity, which, in turn, affect microbial metabolism and community composition (13). For instance, upwelling currents bring nutrient-rich deep waters to the surface, stimulating phytoplankton blooms that form the foundation of the marine food web (14). These physical processes have cascading effects on higher trophic levels, illustrating the interconnectedness of marine life (15). Recent research has revealed that ocean currents not only transport microorganisms but also create dynamic environmental gradients that drive microbial adaptation and evolution (16, 17). Microbial hitchhiking on particulate matter and debris carried by currents can lead to the colonization of new habitats, enhancing genetic diversity and promoting the spread of functional traits (18). Additionally, the interaction between ocean currents and mesoscale eddies generates unique microenvironments that can harbor distinct microbial communities, contributing to regional biodiversity hotspots (19).
The South China Sea (SCS), the largest tropical-subtropical marginal sea, presents a unique environment to study these phenomena (20). Covering approximately 3.5 × 10^6^ km², it exhibits a variety of oceanographic processes akin to those in major ocean basins, including complex circulation patterns driven by monsoonal winds, mesoscale eddies, coastal upwelling, and significant riverine inputs (19). However, its semi-enclosed nature and smaller size relative to open oceans offer a more constrained system to investigate how physical processes influence microbial communities (21). In the SCS, the upper-layer circulation exhibits pronounced seasonal characteristics, primarily driven by monsoons (20). This circulation not only facilitates the dispersal of marine microorganisms but also influences nutrient influx and distribution (22). Prolonged stratification due to high temperatures can hinder nutrient replenishment from deeper layers, affecting microbial productivity (23). Mesoscale eddies are prevalent and can modulate nutrient conditions by displacing isopycnals within the euphotic zone, impacting microbial distribution and activity (24, 25). Coastal upwelling brings nutrient-rich, cold water to the surface, enhancing primary productivity and altering microbial community structures (26). Additionally, riverine inputs modify microbial community composition by introducing nutrients and organic matter, influencing microbial metabolic capacities (27).
Despite advances in regional studies (28–30), comprehensive basin-wide analyses of microbial diversity and distribution in the SCS remain limited. The dynamic environment of the SCS provides an opportunity to examine how large-scale oceanic processes influence microbial communities on a regional scale. Here, we present a broad survey of the SCS region to (i) analyze the spatial distribution patterns of prokaryotic microbial communities and diversity in the South China Sea, (ii) elucidate the mechanisms underlying the assembly of prokaryotic microbial communities in the SCS, and (iii) explore the influence of oceanic currents on the distribution of prokaryotic microorganisms, particularly the keystone species. By investigating these aspects, we aim to enhance the understanding of how ocean currents shape microbial community structure and function in the SCS, with implications for biogeochemical cycling and ecosystem health.
MATERIALS AND METHODS
Study area and sampling
Our sampling covered the South China Sea (SCS), excluding the southeastern region (Fig. 1a). We collected a total of 68 water samples across five zones, each characterized by distinct physicochemical properties: 27 samples from NORC2018-06 (collected from 18 August 2018 to 21 September 2018), 20 samples from NORC2019-07 (collected from 23 June 2019 to 3 October 2019), and 21 samples from NORC2020-05 (collected from 19 July 2020 to 8 October 2020). Sampling depths ranged from 1.5 m to 10 m across an area spanning 110.27°E to 120.00°E and 9.33°N to 22.21°N. One liter of seawater was pre-filtered through a 20 µm nylon mesh (Sefar Nitex, Bigman AB, Sweden) and then filtered through a 0.22 µm pore size polycarbonate filter (Millipore, Billerica, MA, USA). The filters were immediately frozen in liquid nitrogen onboard and stored at −20°C until DNA extraction. For microbial abundance estimation, 2 mL samples were pre-filtered through a 20 µm nylon mesh, fixed with 1% (vol/vol) glutaraldehyde, incubated in the dark for 15 min, then frozen in liquid nitrogen, and stored at −20°C for later analysis.
Water masses and environmental factors distribution in the South China Sea (SCS). (a) Sampling stations and water masses. (b and c) Temperature and salinity of each station, respectively. Dashed arrow lines indicate the currents in the surface SCS during the summer (31). (d) Differences of environmental factors, including temperature (°C), salinity (PSU), nitrite + nitrate (NOx, µM), ammonia (NH4, µM), phosphate (PO4, µM), and silicate (SiO3, µM), among the water masses. All the values were ln-transformed. Different lowercase letters above each box in the same represent significant differences between groups (Tukey’s HSD test, P value < 0.05). Vietnam Warm Eddy Basin (VWEB); the Vietnam Cold Eddy Basin (VCEB); the Qiongdong Basin (QDB); the Pearl River Mouth Basin (PRMB); and the Luzon Warm Eddy Basin (LWEB). Map made with Natural Earth. Free vector and raster map data at naturalearthdata.com.
16S rRNA gene sequencing and bioinformatic analysis
The phenol-chloroform-isoamyl alcohol method was applied to extract microbial DNA, as described previously (32). For the taxonomic identification of microbial compositions, the prokaryotic 16S rRNA V4-V5 fragments were amplified with forward primers (515F 5′-GTGCCAGCMGCCGCGGTAA-3′) and reverse primers (907R 5′-CCGTCAATTCMTTTRAGTTT-3′). Amplicons were quantified and sequenced using 2 × 250 bp paired-end reads on the Illumina MiSeq platform (Illumina, San Diego, CA, USA). Here, we used QIIME2-Deblur pipeline (33), and all sequences were trimmed to 225 bp with default parameters. The sequenced data set contained 2,651,200 sequences for 16S rRNA gene. The rarefaction of sample reads is performed by the qiime diversity core-metrics-phylogenetic command based on the minimum sample sequence number after denoise, the minimum sequence numbers for 16S rRNA were 18,789. The final data set contained 1,277,652 sequences comprising 3,730 amplicon sequence variants (ASVs) after removing the chloroplast or mitochondria for 16S rRNA gene.
Environmental factor measurement
Water temperature and salinity were measured in situ with conductivity-temperature-depth oceanic profilers (SBE-911 Plus). Inorganic nutrients, including nitrite + nitrate (NO_x), phosphate (PO_4), and silicate (SiO_3_) concentrations, were assessed by the Technicon AA3 Auto-Analyzer (Bran-Luebbe, GmbH) (34). Moreover, ammonium concentrations (NH_4_) were measured by the orthophthaldialdehyde fluorometric method (35).
Based on satellite remote sensing data (Global Ocean Gridded L4 Sea Surface Heights and Derived Variables Reprocessed 1993 Ongoing), we conducted an analysis of the monthly mean sea level anomaly (SLA; defined as the difference between the observed sea surface height and the mean sea level) and the direction and velocity of geostrophic currents during the sampling period (July to September from 2018 to 2020, Fig. S1). These two parameters were combined to identify mesoscale eddies in the ocean.
Microbial abundance measurement
For microbial abundance, thawed samples were stained with the nucleic acid-specific dye SYBR green I (Invitrogen, Carlsbad, CA, USA) for 15 min in a dark environment, after that they were analyzed using an Epics Altra II flow cytometer (Beckman Coulter, Inc., Brea, CA, USA) equipped with an external quantitative sample injector (Harvard Apparatus PHD 2000; Instech Laboratories, Inc.) following the protocols described previously (36).
Co-occurrence network inference and analysis
Co-occurrence network was used to explore co-occurrence patterns of prokaryotes in the SCS. Only the ASVs occurred more than 1/4 of all sites were selected. A Spearman’s correlation between ASVs was considered statistically robust if the Spearman’s coefficient |r| > 0.6, and adjusted P-value was <0.05 (Benjamin-Hochberg method). A set of network properties was calculated to describe the topology of the resulting networks (37), including no. edges (L), no. positive edges (L_p_), no. negative edges (L_n_), no. nodes (n), connectance (Con), average degree (Ave. K), average path distance, diameter (D), average clustering coefficient (Ave. CC), centralization of degree (Centra. of degree), centralization of betweenness (Centra. of betweenness), and centralization of closeness (Centra. of closeness). A fast greedy modularity optimization algorithm was used to partition the modulesl the no. module and relative modularity (RM) were calculated based on modules. Then, the metric of within-module connectivity (Zi) and between-module connectivity (Pi) were utilized to identify the connectors connecting distinct modules (37). Node can be categorized into four categories based on Zi and Pi scores (37): (i) peripheral nodes (Zi < 2.5, Pi < 0.62), (ii) connectors (Zi < 2.5, Pi > 0.62), (iii) module hubs (Zi > 2.5, Pi < 0.62), and (iv) network hubs (Zi > 2.5, Pi > 0.62). All co-occurrence analyses were carried out using “igraph” (38) and “ggClusterNet” (39) packages. Network visualizations were conducted in Cytoscape version 3.8.0 and Gephi 0.9.2.
Ecological mechanisms and niche breadth of prokaryotic community assembly
The phylogenetic bin-based null model analysis (iCAMP) was utilized with recommended default settings to calculate the nearest taxon index (NTI) and uncover the ecological drivers of prokaryotic community assembly (40) and to assess the relative influence of each ecological process on microbial community, including dispersal limitation (DL), homogenizing dispersal (HD), homogeneous selection (HoS), heterogeneous selection (HeS), and drift (DF). Moreover, the modified stochastic ratio (MST), which represents the relative contribution of stochasticity on prokaryotic community assembly, was calculated for each water mass using iCAMP.
Niche breadth is a key characteristic that shapes the balance between deterministic and stochastic processes in community assembly (41–43). Resource states were defined as the optimal categories of standardized seawater environmental variables across stations, determined through K-means partitioning using the cascadeKM function in the R package vegan (44). The number of resource states was identified based on the simple structure index (SSI) criterion, which integrates three elements: the maximum difference of each variable between clusters, the sizes of the most contrasting clusters, and the deviation of a variable’s cluster center from its overall mean. These elements collectively assess the interpretability of a partitioning solution, with the highest SSI value indicating the best partition (45). The number of resource states serves as a measure of habitat heterogeneity, where a larger number reflects more heterogeneous environmental conditions. Additionally, the niche breadth of prokaryotic amplicon sequence variants (ASVs), quantified using Levins’ niche breadth index (B), and community niche breadth (Bcom) were calculated based on the evenness of species abundance across different resource states, following methodologies outlined in previous studies (43, 46).
Function prediction
Phylogenetic investigation of communities by reconstruction of unobserved states (PICRUSt2, version 2.3.0b) and functional annotation of prokaryotic taxa (FAPROTAX) were used to predict the functional potential of the bacterial community based on 16S rRNA gene sequencing profiles, following the developers’ guidelines (47, 48). The predictions from PICRUSt2 were mapped to the annotated gene catalog of the Kyoto Encyclopedia of Genes and Genomes (KEGG) database. FAPROTAX, on the other hand, translated the taxonomic profiles of the microbial community into putative functional profiles using a database of cultured microorganisms. The genes annotated by PICRUSt2 were subsequently enriched into relevant pathways using the clusterProfiler package in R (49).
Statistics
Richness and Shannon indices of prokaryotic communities were calculated to evaluate the alpha diversity. A principal coordinate analysis (PCoA) based on Bray-Curtis dissimilarity was applied, and a permutational multivariate analysis (PERMANOVA) was conducted to assess the variance of prokaryotic community among all pairs of water masses. Variance portioning analysis (VPA) was conducted to explore the influence of environmental factors and geographic distance using vegan R package. Statistical analyses were performed in the R environment (v4.2.2; http://www.r-project.org/), and the packages “vegan,” “ggplot2,” and “ggpubr” were used without special comment (44, 50, 51).
The random forest model was applied to identify biomarkers for different water masses using the “randomForest” package in R (ntree = 1,000, with the default mtry of p/3, where p represents the number of ASVs) (52). Here, biomarkers are ASVs selected by the random-forest classifier because they best discriminate among water masses, whereas keystone taxa are nodes with high within-module (Z_i_ > 2.5) or among-module (P_i_ > 0.65) connectivity that uphold network integrity. Lists of ASVs ranked by feature importance were generated based on 100 iterations of the model. To determine the optimal number of marker taxa, we conducted 10-fold cross-validation with five repeats using the rfcv function from the same package. The minimum cross-validation error was achieved with 29 important ASVs (Fig. S2), and the error curve stabilized beyond this point. Therefore, we selected the 29 most important ASVs as marker taxa (biomarker), correlating with environmental factors.
RESULTS
Hydrological conditions of the South China Sea
The geostrophic currents in the SCS display intricate local variations, but the overall summer circulation is characterized by a dominant flow from the western coast of Vietnam toward the northeastern SCS (31), with increased dispersion as the current moves forward (Fig. 1). Additionally, satellite data showed the presence of a stable cold and warm eddy pair in the western SCS, with the warm eddy exerting a stronger influence near the Luzon Strait (Fig. S1). However, SLA heights in the northwestern SCS exhibited limited variability, showing no clear or consistent patterns of cold or warm eddies (Fig. S1). These results suggest the complicated hydrological conditions in the SCS.
Here, five water masses were identified based on temperature, salinity, and the locations (latitude and longitude) (temperature: 28.0–30.9°C and salinity: 32.9–33.9 PSU; Fig. 1 and Fig. S3). Furthermore, the water mass identification was corrected based on observed differences in SLA and geostrophic currents along the primary flow direction. These groups include the Vietnam Warm Eddy Basin (VWEB, 9 stations), the Vietnam Cold Eddy Basin (VCEB, 18 stations), the Qiongdong Basin (QDB, 13 stations), the Pearl River Mouth Basin (PRMB, 18 stations), and the Luzon Warm Eddy Basin (LWEB, 10 stations).
Among these water masses, the LWEB recorded the highest temperature (30.9 ± 0.53°C), while the VCEB had the lowest (28.0 ± 0.56°C) (Fig. 1). Salinity was lowest in the VWEB (32.9 ± 0.45 PSU), whereas the other four water masses exhibited higher, but similar, salinity values (~33.8 PSU). The inorganic nutrient concentrations varied across the five water masses. NO_x, NH_4, and PO_4_ were highest in the VCEB (1.13 ± 1.15 µM, 1.56 ± 1.16 µM, and 0.06 ± 0.02 µM, respectively), while the lowest NO_x_ was observed in the PRMB (0.17 ± 0.10 µM) and the lowest NH_4_ and PO_4_ in the QDB (0.30 ± 0.43 µM and 0.04 ± 0.03 µM, respectively). SiO_3_ ranged from 1.28 ± 0.53 µM in the VCEM to 3.16 ± 1.26 µM in the LWEB, generally increasing northward. In addition, environmental heterogeneity increased from south to north generally, suggesting that the environmental variation increased from south to north in the SCS. These findings suggest distinct hydrological conditions in each water mass, likely influencing the composition of prokaryotic communities within.
Diversity of prokaryotic communities and microbial abundance
The prokaryotic communities in the SCS are primarily composed of Cyanobacteria (accounted for total data set, 30.29%), Alphaproteobacteria (27.87%), Acidimicrobiia (13.10%), Bacteroidia (11.26%), and Gammaproteobacteria (7.32%) (Fig. 2a), collectively representing 89.84% of all prokaryotic communities across samples. Additionally, we observed an increasing trend in the proportions of Cyanobacteria and Acidimicrobiia along the ocean current from south to north (Table S1). Richness, Shannon diversity, and Pielou’s evenness also gradually declined along this south-to-north gradient (Fig. 2b), with significant correlations to temperature and SiO_3_ levels (Spearman correlation, P < 0.05) (Fig. 2b). These findings suggest a consistent pattern of alpha diversity changes in the prokaryotic communities along the SCS currents.
Taxonomic composition, abundance and alpha diversity of surface microbial communities in the South China Sea. (a) Taxonomic composition of prokaryotic communities at class level. The top 10 abundant classes were shown. (b) Alpha diversity of prokaryotic communities in the water masses, including richness, Shannon diversity, and Pielou’s evenness. Different lowercase letters above each box in the same represent significant differences between groups (Tukey’s HSD test, P value < 0.05). (c) Abundance of prokaryotes (cells/mL, ln-transformed) in the water masses, including microeukaryote (Euk), Synechococcus (Syn), Prochlorococcus (Pro), and bacteria (Bac). (d) Spearman correlations of abundance and diversity of microbes with environmental factors. Number and color indicate the Spearman correlation rho, while the white cell indicates the P value > 0.05.
The abundance of microbes varied among the water masses (Fig. 2c; Table S2). Microeukaryotes peaked in the VCEM (1.88 ± 0.97 × 10³ cells mL⁻¹), declined in the VWEB (0.81 ± 0.29 × 10³ cells mL⁻¹) and PRMB (0.82 ± 1.76 × 10³ cells mL⁻¹), and reached their minimum in the LWEB (0.17 ± 0.10 × 10³ cells mL⁻¹). Synechococcus and Prochlorococcus displayed a similar pattern: both were most abundant in the VCEB (4.85 ± 4.08 × 10⁴ and 1.54 ± 0.61 × 10⁵ cells mL⁻¹, respectively) and the VWEB (2.45 ± 3.02 × 10⁴ and 1.71 ± 0.46 × 10⁵ cells mL⁻¹), but least abundant in the QDB (0.96 ± 1.89 × 10⁴ and 0.17 ± 0.24 × 10⁵ cells mL⁻¹) and LWEB (0.64 ± 0.54 × 10⁴ and 0.18 ± 0.12 × 10⁵ cells mL⁻¹). Total bacterial counts were highest in the VWEB (1.11 ± 0.40 × 10⁶ cells mL⁻¹) and lowest in the PRMB (0.64 ± 0.29 × 10⁶ cells mL⁻¹).
Significant correlations of diversity and microbial abundances with environmental factors were observed in our study (Fig. 2d). However, only temperature and SiO_3_ showed significant correlations with the alpha diversity of prokaryotic communities. Instead, we found a strong negative correlation between microbial abundances and temperature (Spearman correlation rho = −0.61, −0.41, −0.56, and −0.28 for microeukaryotes, Synechococcus, Prochlorococcus, and bacteria, respectively, P values < 0.05). Nevertheless, no significant correlation was found between microbial abundances and salinity (Spearman correlation, P values > 0.05), suggesting a limited influence of salinity. For the inorganic nutrients, NO_x_ showed significantly positive correlations with the abundances of microeukaryotes (rho = 0.43, P value < 0.01), Synechococcus (rho = 0.37, P value = 0.01), and bacteria (rho = 0.33, P value = 0.02). PO_4_ was positive correlations with Prochlorococcus (rho = 0.26, P value = 0.04) and bacteria (rho = 0.30, P value = 0.01). NH_4_ was positively correlated with abundances of all four microbial groups (microeukaryotes: rho = 0.29, P value = 0.02; Synechococcus: rho = 0.37, P value < 0.01; Prochlorococcus: rho = 0.45, P value < 0.01; bacteria: rho = 0.45, P value < 0.01). In contrast, SiO_3_ was significantly correlated only with microeukaryotic abundances (rho = −0.32, P value = 0.01). Overall, these results suggest that temperature and inorganic nutrient levels within the water masses play a significant role in influencing prokaryotic community diversity and microbial abundances in the SCS.
Distance decay of prokaryotic communities on geographic and environmental distances
We found that prokaryotic community dissimilarity increased with both geographic and environmental distance in the SCS (Fig. 3a and b), indicating that community differences across samples were largely due to spatial species turnover. Additionally, we found the Sørenson and sequential dissimilarity within individual water masses rose from south to north (Fig. 3c and d), suggesting the increased spatial variation along the current. A PCoA of taxonomic compositions did not show clear separation by water mass (Fig. 4a), though significant structural differences were observed across water masses (Table S3). Instead, temperature was strongly correlated with PCoA2 (Pearson’s correlation, adjusted R² =0.51, P < 0.01). To assess the geographic independence of these patterns and identify environmental drivers, we examined correlations between distance-corrected taxonomic dissimilarities and environmental factors (Fig. 4b). Temperature emerged as the strongest correlation of taxonomic composition (Mantel R = 0.21, P < 0.01), while salinity showed no significant correlation (Fig. 4b). Most nutrients had weak correlations with prokaryotic communities, except for SiO_3_. Despite the influences of environmental factors varied across the water masses, temperature appears to be a significant driver in most water masses, with other factors such as salinity and nutrients (PO_4_ and SiO_3_) playing variable roles across the basins (Fig. S4). Furthermore, VPA revealed that environmental factors explained 17% of the variation in prokaryotic communities, with spatial location accounting for only 2% (Fig. 4c). However, a substantial portion of variation (77%) remained unexplained by either environmental factors or spatial location.
Beta diversity and environmental drivers of surface prokaryotic community composition. (a and b) Distance decay of surface SCS prokaryotic communities based on geographic distance (a) and environmental distance (b). Pairwise prokaryotic community dissimilarity (Bray-Curtis) were calculated based on relative ASV abundances increases with distance (geographic and environmental distances) between sampling stations. Environmental distances were calculated based on temperature, salinity, NOx, NH4, PO4, and SiO3. (c) Sørenson dissimilarity of surface prokaryotic communities within each water mass. (d) Sequential Bray-Curtis dissimilarities for surface prokaryotic communities, along with means were significantly different between domains (Wilcoxon test, P values < 0.05).
Environmental drivers of surface prokaryotic community composition. (a) Principal coordinate analysis (PCoA) of surface samples shows that samples are not clearly grouped by their regional origin (left), but rather separated by the local temperatures as shown by the strong correlation (adjusted R2: 0.51) between the second PCoA and temperature (right). (b) Pairwise comparisons of environmental factors are shown, with a color gradient denoting Pearson’s correlation coefficient. Taxonomic community composition was related to each environmental factor by partial (geographic distance–corrected) Mantel tests. Edge width corresponds to Mantel’s r statistic for the corresponding distance correlations, and edge color denotes the statistical significance based on 9,999 permutations. (c) Variance portioning analysis on Bray-Curtis dissimilarity of prokaryotic communities showing the relative contribution of spatial and environmental factors alone and in combination. Partial R2 values are provided for each fraction. Blue cycle represents spatial structure, and orange circle represents environmental factors. The P values are obtained using redundancy analysis for spatial and environmental factors, respectively, with 999 permutations.
Difference in niche breadth of prokaryotic communities between water masses
Based on SSI derived from K-means partitioning, the environmental conditions across stations were classified four, three, four, six, and three resource states of each water mass, respectively (Fig. S5). In general, the Levins’ niche breadth of prokaryotic communities (Bcom) was higher in the VWEB, VCEB, and QDB compared to PRMB and LWEB (Wilcoxon test, adjusted P values < 0.001). Additionally, Bcom of the PRMB was significantly higher than that in the LWEB (adjusted P value < 0.001), whereas no significant differences were detected among the VWEB, VCEB and QDB (adjusted P values > 0.05; Fig. S6).
Assembly process of prokaryotic communities
MST of prokaryotic communities decreased from south to north in the SCS (Fig. 5a). Overall, ecological drift emerged as the dominant mechanism of driving community assembly, accounting for 53.7% (Fig. 5b). Environmental selection, encompassing HeS and HoS, contributed 38.7% of relative importance, while dispersal, including DL and HD, accounted for only 9.5%. Within individual water masses, drift remained the primary driver of community assembly but showed a gradual decline in influence from south to north, except in the QDB (Fig. 5c). However, other processes showed no clear north-south trend. Environmental selection was notably higher in the QDB than in other water masses, while DL reached its highest value in the LWEB.
Prokaryotic community assembly processes. (a) Modified stochasticity ratio of prokaryotic communities in the SCS. Different lowercase letters above each box in the same represent significant differences between water masses (Tukey’s HSD test, P value < 0.05). (b) Relative proportion of ecological processes for the prokaryotic community across all stations in the SCS. Five different ecological processes (homogeneous selection [HoS], heterogeneous selection [HeS], drift [DF], dispersal limitation [DL], and homogeneous dispersal [HD]) were analyzed. (c) Ecological processes for the prokaryotic community among different water masses in the SCS.
Co-occurrence network of prokaryotic communities
To highlight the role of biotic associations in shaping community variation, we constructed a co-occurrence network for the SCS region (Fig. 6a) and water masses along with five subnetworks, each specific to one water mass (Fig. 6b). This SCS network comprised 353 nodes and 1,712 edges, with 90.48% of edges indicating positive associations and 9.52% negative (Table S4). Notably, over one-third of these edges involved Alphaproteobacteria (638 edges), followed by Gammaproteobacteria (319 edges), Bacteroidia (181 edges), and SAR406 (132 edges). Among individual ASVs, asv3925 (Cyanobacteria) displayed the highest connectivity, likely due to its autotrophic nature, while Thermoplasmata also exhibited substantial connectivity, suggesting unique ecological roles among archaea, ranking just below Alphaproteobacteria and Gammaproteobacteria.
*Succession of prokaryotic networks over water masses. (a) Co-occurrence networks of prokaryotic communities in the South China Sea. (b) Subnetworks in each water mass. A connection indicates a strong (Spearman’s |r| ≥ 0.6) and significant (FDR-corrected P-value < 0.05) correlation. Colors in the upper six networks indicate the module, while the ones in the lower six networks indicate the class of ASVs. (c) Spearman correlation between subnetwork properties and water masses (from south to north). The asterisk indicates the P value < 0.05. (d) Changes of network topology, including Ave. K, Centra. of degree (centralization of degree), L, Lp and RM, which were significantly correlated with water masses showing in panel c. (e) Differences in relative abundances of dominant co-occurrence modules among different prokaryotic communities. Different lowercase letters above each box in the same panel represent significant differences between water masses (Tukey’s HSD test, P value < 0.05). (f) Heatmap showing Spearman correlations between co-occurrence modules and environmental factors. *, P value < 0.05; **, P value < 0.01; **, P value < 0.001.
Several topological properties of the subnetworks, including L, L_p_, Ave.K, degree of centrality, and RM, showed significantly positive correlations with both water mass and the latitudinal gradient from south to north (Fig. 6c and d). Additionally, four major modules (modules 1–4) were identified based on the node number (>10). The relative abundance of ASVs within modules 1, 2, and 4 generally declined from south to north (Fig. 6e), whereas ASVs in module 3 increased in abundance along this gradient. Modules 1, 2, and 4 were significantly associated with prokaryotic community diversity (Fig. 6f); however, modules 1, 2, and 3 displayed weaker correlations with environmental factors compared to module 4, suggesting lower sensitivity of these modules to environmental changes. Overall, these results highlight modular shifts in prokaryotic community composition across different water masses in the SCS.
Keystone species and prokaryotic biomarkers
We identified potential keystone species within the network by categorizing nodes into four groups—network hubs, module hubs, connectors, and peripherals—based on their Zi and Pi values (Fig. 7a) (see Materials and Methods for details). Given their structural importance in network topology, module hubs and connectors were designated as keystone taxa. Based on these criteria, prominent keystone taxa included members of Alphaproteobacteria (six ASVs), Gammaproteobacteria (three ASVs), Bacteroidia (two ASVs), the SAR406 clade (one ASV), Cyanobacteria (one ASV), and Planctomycetia (one ASV). Their relative abundance ranged from 0.003% to 11.8% to total sequence number. Additionally, a random forest model was used to identify biomarkers specific to each water mass, yielding an out-of-bag (OOB) error rate of 22%, indicating a reliable model. Biomarker ASVs exhibited diverse taxonomy, including the SAR11 clade (five ASVs), Cellvibrionales (three ASVs), SAR86 clade (two ASVs), and SAR406 clade (two ASVs) (Fig. 7b). Their proportion ranged from 0.002% to 1.16% to total sequence number.
*Keystone species and biomarkers. (a) Keystone species was identified by within-module connectivity (Zi) and among-module connectivity (Pi). Gray dots indicate hyper. The dots with Zi > 2.5 and Pi < 0.65 are the module hubs, while the dots with Zi < 2.5 and Pi > 0.65 are the connectors. (b) Top 29 ASVs were identified using random forest model. The higher means decrease accuracy indicates the more importance of ASV. The random forest model was tested by 100 iterations and revealed a P value < 0.05. (c) Spearman correlations between keystone species and environmental factors. Source indicates the ASV identified by network (NE), random forest model (RF), or both. The Class color indicates the class of these ASVs. *, P value < 0.05; **, P value < 0.01; **, P value < 0.001.
Two major clusters of these key species (both keystone taxa and biomarkers) were identified based on their correlations with environmental factors (Fig. 7c). For example, asv6781 (Actinobacteria), asv9919 (Alphaproteobacteria), and asv6505 (Alphaproteobacteria) showed positive correlations with temperature but negative correlations with nutrients such as NO_x, NH_4, and microbial abundance. In contrast, several ASVs, including asv4182, asv4495, and asv3697 (all Alphaproteobacteria), were negatively correlated with temperature but positively correlated with nutrients. Most biomarker ASVs were positively correlated with diversity, suggesting a contributory role in enhancing community diversity.
Function of prokaryotic community
The PCA analysis revealed functional differences in prokaryotic communities, predicted using PICRUSt2, across the water masses (Fig. 8a). Notably, PC1 displayed positive correlations with Bac and Pro, as well as the richness and Shannon index of prokaryotic communities, while showing negative correlations with geographical location (longitude and latitude), SiO₃, temperature, and water mass classifications (Fig. 8b). In contrast, PC2 exhibited positive correlations with salinity, location, temperature, and water mass, but negative correlations with Euk and Pro, as well as the richness and Shannon index of prokaryotic communities. These findings suggest that variations in the functional composition of prokaryotic communities are closely associated with environmental changes in the SCS water masses.
*Functional profile of prokaryotic communities and key species. (a) Principal coordination analysis (PCA) of the function of prokaryotic communities based on PICRUST2 prediction. (b) Spearman correlations of PC1 and PC2 with environmental factors and diversity of prokaryotic communities. P values were adjusted using the FDR method. *, adjusted P value < 0.05; **, adjusted P value < 0.01; **, adjusted P value < 0.001. (c) Metabolism enrichment of biomarkers and keystone species (adjusted P < 0.05). Only metabolism with more than half ASVs was shown here. The function was predicted based on PICRUSt2. Abundance of each metabolism was transformed by z-score. NE represents the ASV identified by network, while RF represents the ASV identified by random forest model. Both represent the ASV were identified by both NE and RF. Class shows the class of these ASVs belonging.
Furthermore, the metabolism enrichment of the keystone species and biomarkers revealed that general functions of these species were similar, such as biosynthesis of amino acids, ribosome, biosynthesis of cofactors carbon metabolism (Fig. 8c; Fig. S8). However, distinct patterns of functional contributions were observed among different microbial taxa, with certain functions being more enriched in specific sources or classes. For instance, flagellar assembly and chemotaxis were predominantly enriched in the biomarkers, while photosynthesis was more prominently associated with the keystone species. These findings highlight the functional divergence across their ecological roles and suggest a potential link between prokaryotic community composition and environmental conditions.
DISCUSSION
Hydrodynamic conditions, such as ocean currents and swell waves, are well-recognized drivers of marine microbial dispersal and migration, affecting both local and large-scale distribution patterns (11, 53). These physical forces not only facilitate the movement of microbial populations but also create spatial heterogeneity by altering nutrient availability and environmental conditions. The impact of current-induced dispersal on prokaryotic communities has been studied in both freshwater and marine microbial ecosystems (53, 54). Here, we provide a systematic comparison of prokaryotic communities in the semi-enclosed SCS basin, emphasizing the significant role of water mass and ocean currents play in shaping community structure.
We observed a clear gradient in shifts of both alpha and beta diversity along the trajectory of the SCS current ([Fig. 2 and 3](#F2 F3)), suggesting that ocean currents influence microbial dispersal. There are two hypotheses to describe this effect: the “dispersal mechanism” and the “bulk transport hypothesis” (55). The dispersal mechanism posits that advection mainly affects the presence and diversity of taxa, with minimal impact on abundance, whereas the bulk transport hypothesis suggests that advection primarily alters taxa abundance (55). Our findings revealed that geographic distance had a more pronounced effect on the presence-absence dissimilarity of prokaryotic communities (Sørensen dissimilarity, 0.49 ± 0.08) compared to abundance-based dissimilarity (Bray-Curtis dissimilarity, 0.32 ± 0.06) (Table S5). This pattern supports the dispersal hypothesis, suggesting that advection primarily influences microbial community structure by increasing colonization opportunities (55). Additionally, we found the high and decreased contribution of ASVs in the VWEB to other water masses (Fig. S9). Our findings, therefore, suggest that microbes can travel long distances via ocean currents, significantly shaping community structures (10, 56, 57). These patterns underscore the strong role of ocean currents in structuring microbial populations and shaping biodiversity gradients in the SCS (58, 59).
A meta-analysis of studies on microbial community composition showed that distance effects accounted for 10% of the variance, while environmental factors explained 27%, suggesting a stronger influence of contemporary environmental conditions over historical processes like dispersal limitation (60). Our findings align with this pattern, with dispersion processes, including dispersal limitation and homogenizing dispersal, explaining around 10% of the variance in the SCS. However, the variance attributed to geographic distance (2%) and environmental factors (17%) in our study was lower than previous estimates (Fig. 4c), possibly due to the smaller spatial scale. Similar trends have been observed in the Southern Ocean, where geographic distance had a minimal effect (55). Although incorporating the main physiochemical and spatial variables, our VPA left 77% of the community variance unexplained. This residual likely reflects ecological forces that were not quantified in the present survey, such as the molecular complexity of DOM, virus-mediated infection and lysis cycles, and centimeter-scale physical heterogeneity that creates patchy viscous seascapes (61). Despite the conservative estimate of the advection effect, it remains significant, indicating that physical transport plays an important role in microbial biogeography (10, 56, 57). Furthermore, a previous study has been reported the dynamic currents and diverse water mass composition in the SCS (62), highlighting the importance of understanding how physical processes shape microbial distribution at both global and regional scales.
Regionally, microbial communities can be influenced by local water masses along the current in at least two ways (63). First, water masses serve as a barrier to dispersal, influenced by differences in water density (64). Second, they act as a selective force due to variations in temperature, salinity (65), and organic matter composition (66–68). The negligible effect of salinity in our models is consistent with the very small range observed (32.9–33.9 PSU; SD = 0.3 PSU), which provides insufficient osmotic or ionic contrast to drive marked community differentiation. However, we found significant correlations between prokaryotic community structure and temperature in the SCS (Fig. 4), which aligns with previous studies that found bacterial communities associated with specific water masses (64, 66). Furthermore, a stronger Mantel correlation between environmental distance and prokaryotic communities, compared to geographic distance, supports this observation (Table S5). These findings lead us to further analyze how selection pressures within water mass shape the prokaryotic communities.
Selection pressures, encompassing both heterogeneous and homogeneous processes, varied across different water masses in our study (Fig. 6). The temperature is the most important driver of diversity globally (53). Likely, we found the significant influence of the temperature on the structure and diversity, as well as the function, of the prokaryotic communities. In contrast, the declined influence of nutrients on structure compared to temperature might relate to low concentrations of oligotrophic area studied. Furthermore, the different responses of prokaryotic communities are likely linked to different types of organic matter in each water mass (69–72), which likely select for different prokaryotes (66, 67). The significant correlation of prokaryotic community with SiO_3_ partially support this, which is one of the factors controlling phytoplankton distribution, especially the diatom in the SCS (73). Overall, these results suggest that local and regional environmental factors exert differential influences on microbial communities distributed along the current (74, 75).
Ecological drift also plays a predominant role in shaping the assembly of prokaryotic communities in the surface SCS, even though selection contributes significantly. Such findings align with studies conducted in the North Pacific Ocean, which also revealed high contribution of drift on microbial community assembly (76). This drift, arising from stochastic variations in population sizes, birth rates, and death rates (77), can have diverse impacts on bacterial dynamics (78). Previous studies have assumed that communities with relatively large population sizes would be less influenced by random births and deaths and thus less impacted by ecological drift, which may then influence the strength of dispersal limitation that operates alongside drift (43, 46). Supporting this, we found decreased abundances of heterotrophic bacteria, Prochlorococcus, and Synechococcus along the current from south to north, companying decreased drift effect. Moreover, the increase of habitat heterogeneity across the water masses from south to north (Fig. S5 and S6), could lead to higher habitat preference and, thus, less importance of stochasticity over determinism (79). Therefore, the spatial changes in prokaryotic niche breadths and habitat heterogeneity along the current could be related to the local variations of determinism-stochasticity in assembly mechanisms. In turn, the high contribution of ecological drift implies the well mixed water mass in the surface SCS, similar to patterns in river ecosystems (80, 81). Given seasonal changes in current directions (31), future studies should focus on assessing the impact of these directional changes on the assembly processes of marine microbiota.
Unlike macroorganisms, where individual populations simply accumulate, microorganisms in natural ecosystems form complex ecological networks critical for maintaining ecosystem functions (82). Biotic interactions play a crucial role in species sorting, thereby influencing microbial community assembly and biogeographic patterns (83). The co-occurrence network revealed an increased complexity of interactions among prokaryotes, as evidenced by the rise in the L, L_p_, Ave. K, Contra. of degree and RM values from south to north (Fig. 5), which also indicates the increase in stability (84). Microbial interactions could also be reshaped by gaining adaptive genes to extend niche breadth, which alters interaction patterns (85). The distinct functional structure of the prokaryotic communities might partially support this phenomenon (Table S6). While the prokaryotic communities along the current display highly redundant functional potential, evidenced by insignificant differences in functional diversity (ANOVA test, P = 0.51; Fig. S10), we observed that the network’s keystone species exhibit distinct metabolic functions. These keystone species are adapting to a variety of environmental conditions by expanding their metabolic capabilities (Fig. 8; Fig. S8), leading to altered interaction patterns and increased network complexity. Meanwhile, since we found significantly negative correlations between MST and several network properties (e.g., n, Con, Ave. K, and RM) (Table S7), selection likely amplifies the complexity of interactions among bacterial communities (Fig. 6), thereby contributing to greater overall stability (84).
Previous studies have shown the existence of environmentally driven modules, such as water depth (86) or soil properties (87). We found that the modules dominated by abundant ASVs (modules 1 and 2) were less affected by the environment, whereas the rare species modules (modules 3 and 4) were significantly affected (Fig. 7). Rare taxa, known for enhancing ecosystem stability across diverse environments (88–90), played key roles in nitrogen cycling (e.g., nitrate reduction and ammonification pathways predicted by PICRUSt2; Fig. 8), akin to patterns observed in soils (91). In contrast, modules 1 and 2 correlated with photoautotrophic metabolisms (Fig. S7), suggesting their role in carbon cycling. Given that modules in microbial co-occurrence networks may represent different niches (92), the present patterns of modules may also indicate a change in niches among the water masses. These module-specific functions indicate niche differentiation driven by ocean currents, influencing microbial interactions, functionality, and community stability in the SCS.
The response of specific species to different water masses varied based on their ecological traits (58). Keystone species made greater contributions to ecosystem functions (93), with 14 identified through network analysis and 29 biomarker ASVs identified via random forest analysis (Fig. 7). Stochastic processes, particularly ecological drift, had significant impacts on these species (Fig. S11), may relate to their metabolisms (e.g., fatty acid degradation and nucleotide metabolism) (Fig. S12). While both keystone species and biomarkers were affected by stochasticity, biomarkers were more strongly shaped (82% influence) than keystone species (60%). The limited overlap between biomarkers and keystone species suggests that distinct processes shape their composition and interactions, emphasizing the important role of stochastic factors in microbial community dynamics under environmental variability (94). The difference in the flagellar assembly ability of biomarkers with keystone species indicates that the mobility of prokaryotes influences their ability to respond rapidly to environmental changes, making them more prevalent as biomarkers. In contrast, keystone species may perform their critical ecological roles independently of mobility traits. This underscores that motility can enhance a microorganism’s responsiveness to environmental variability, thereby influencing its role as a biomarker, while keystone species contribute to community stability through other mechanisms. Additionally, most ASVs exhibiting motility possess bacterial chemotaxis abilities, whereas those without motility are capable of photosynthesis. The study of phytoplankton in the western Pacific Ocean shows that the mobility of Trichodesmium helps it adapt to environmental changes, similar to how motility aids biomarkers, while their photosynthetic ability parallels the role of non-motile ASVs (95). Therefore, the differential impacts of stochastic processes on biomarkers and keystone species, attributable to their distinct ecological traits, particularly motility and photosynthetic capabilities, highlight the crucial role these traits play in shaping microbial community dynamics and determining species-specific responses under environmental variability.
Conclusions
This study demonstrates that ocean currents and environmental factors, especially temperature, are key drivers shaping prokaryotic community structure and function in the SCS by facilitating microbial dispersal and influencing diversity patterns along the current. While ocean currents enhance colonization opportunities supporting the dispersal mechanism hypothesis, temperature acts as a critical selection pressure affecting community composition. Stochastic processes like ecological drift also play a significant role, indicating a dynamic interplay between deterministic and stochastic factors in community assembly. Increased complexity and stability of microbial interactions are observed along the current, with niche differentiation driven by environmental selection and rare taxa contributing to ecosystem stability and nitrogen cycling. The differing responses of keystone species and biomarkers to environmental variability, due to traits like motility and photosynthetic capabilities, affect their ecological roles. Understanding these combined effects is essential for predicting microbial community dynamics under environmental variability, with important implications for ecosystem management and conservation.
The reference list from the paper itself. Each links out to its DOI / PubMed record.
- 1Bardgett RD, Freeman C, Ostle NJ. 2008. Microbial contributions to climate change through carbon cycle feedbacks. ISME J 2:805–814. doi:10.1038/ismej.2008.5818615117 · doi ↗ · pubmed ↗
- 2Jackson R, Gabric A. 2022. Climate change impacts on the marine cycling of biogenic sulfur: a review. Microorganisms 10:1581. doi:10.3390/microorganisms 1008158136013999 PMC 9412504 · doi ↗ · pubmed ↗
- 3Moran MA. 2015. The global ocean microbiome. Science 350:aac 8455. doi:10.1126/science.aac 845526659059 · doi ↗ · pubmed ↗
- 4Azam F, Malfatti F. 2007. Microbial structuring of marine ecosystems. Nat Rev Microbiol 5:782–791. doi:10.1038/nrmicro 174717853906 · doi ↗ · pubmed ↗
- 5Banerjee S, Schlaeppi K, van der Heijden MGA. 2018. Keystone taxa as drivers of microbiome structure and functioning. Nat Rev Microbiol 16:567–576. doi:10.1038/s 41579-018-0024-129789680 · doi ↗ · pubmed ↗
- 6Li C, Wang L, Ji S, Chang M, Wang L, Gan Y, Liu J. 2021. The ecology of the plastisphere: microbial composition, function, assembly, and network in the freshwater and seawater ecosystems. Water Res 202:117428. doi:10.1016/j.watres.2021.11742834303166 · doi ↗ · pubmed ↗
- 7Steele JA, Countway PD, Xia L, Vigil PD, Beman JM, Kim DY, Chow C-ET, Sachdeva R, Jones AC, Schwalbach MS, Rose JM, Hewson I, Patel A, Sun F, Caron DA, Fuhrman JA. 2011. Marine bacterial, archaeal and protistan association networks reveal ecological linkages. ISME J 5:1414–1425. doi:10.1038/ismej.2011.2421430787 PMC 3160682 · doi ↗ · pubmed ↗
- 8Zhao D, Shen F, Zeng J, Huang R, Yu Z, Wu QL. 2016. Network analysis reveals seasonal variation of co-occurrence correlations between Cyanobacteria and other bacterioplankton. Sci Total Environ 573:817–825. doi:10.1016/j.scitotenv.2016.08.15027595939 · doi ↗ · pubmed ↗