Burden of Central Nervous System Cancer in the United States, 1990-2021
Hyun Jin Han, Yun Seo Kim, Seoyeon Park, Jae Il Shin, Min Seo Kim, Ju Hyung Moon, Yong Bae Kim, Hazim S. Ababneh, Ahmed Abu-Zaid, Demelash Areda, Santhosh Arul, Ahmed Y. Azzam, Mainak Bardhan, Mohammad Amin Bayat Tork, Babak Behnam, Gokce Belge Bilgin, Prarthna V. Bhardwaj

TL;DR
This study examines trends in central nervous system cancer burden in the US from 1990 to 2021, finding stable incidence but declining mortality and disability-adjusted life-years, with disparities across regions and demographics.
Contribution
The study provides a detailed, nationwide analysis of CNS cancer burden in the US using the Global Burden of Disease Study data, highlighting geographic and demographic disparities.
Findings
CNS cancer incidence remained stable, but disability-adjusted life-years and mortality rates declined from 1990 to 2021.
Geographic disparities persist, with states like Mississippi and West Virginia facing higher burdens.
Age-specific trends show decreasing incidence in young children but increasing rates in older adults.
Abstract
This cross-sectional study analyzes data from the Global Burden of Disease Study to determine trends in central nervous system cancer over 3 decades in the United States. What were the trends of central nervous system (CNS) cancer burden in the US from 1990 to 2021? In this cross-sectional study, analysis of the Global Burden of Disease Study 2021 data on US CNS cancers revealed that although the incidence rate remained relatively stable, both disability-adjusted life-years and mortality rates declined. However, substantial disparities persisted across geographical location, age, sex, and sociodemographic profile. The persistent disparity in CNS cancer burden highlights the urgent need to reevaluate public health policies and redistribute health care resources to better support marginalized and underserved populations. Primary brain and central nervous system cancer (collectively…
Genes, proteins, chemicals, diseases, species, mutations and cell lines named across the full text — each resolved to its canonical identifier and authoritative record.
Click any figure to enlarge with its caption.
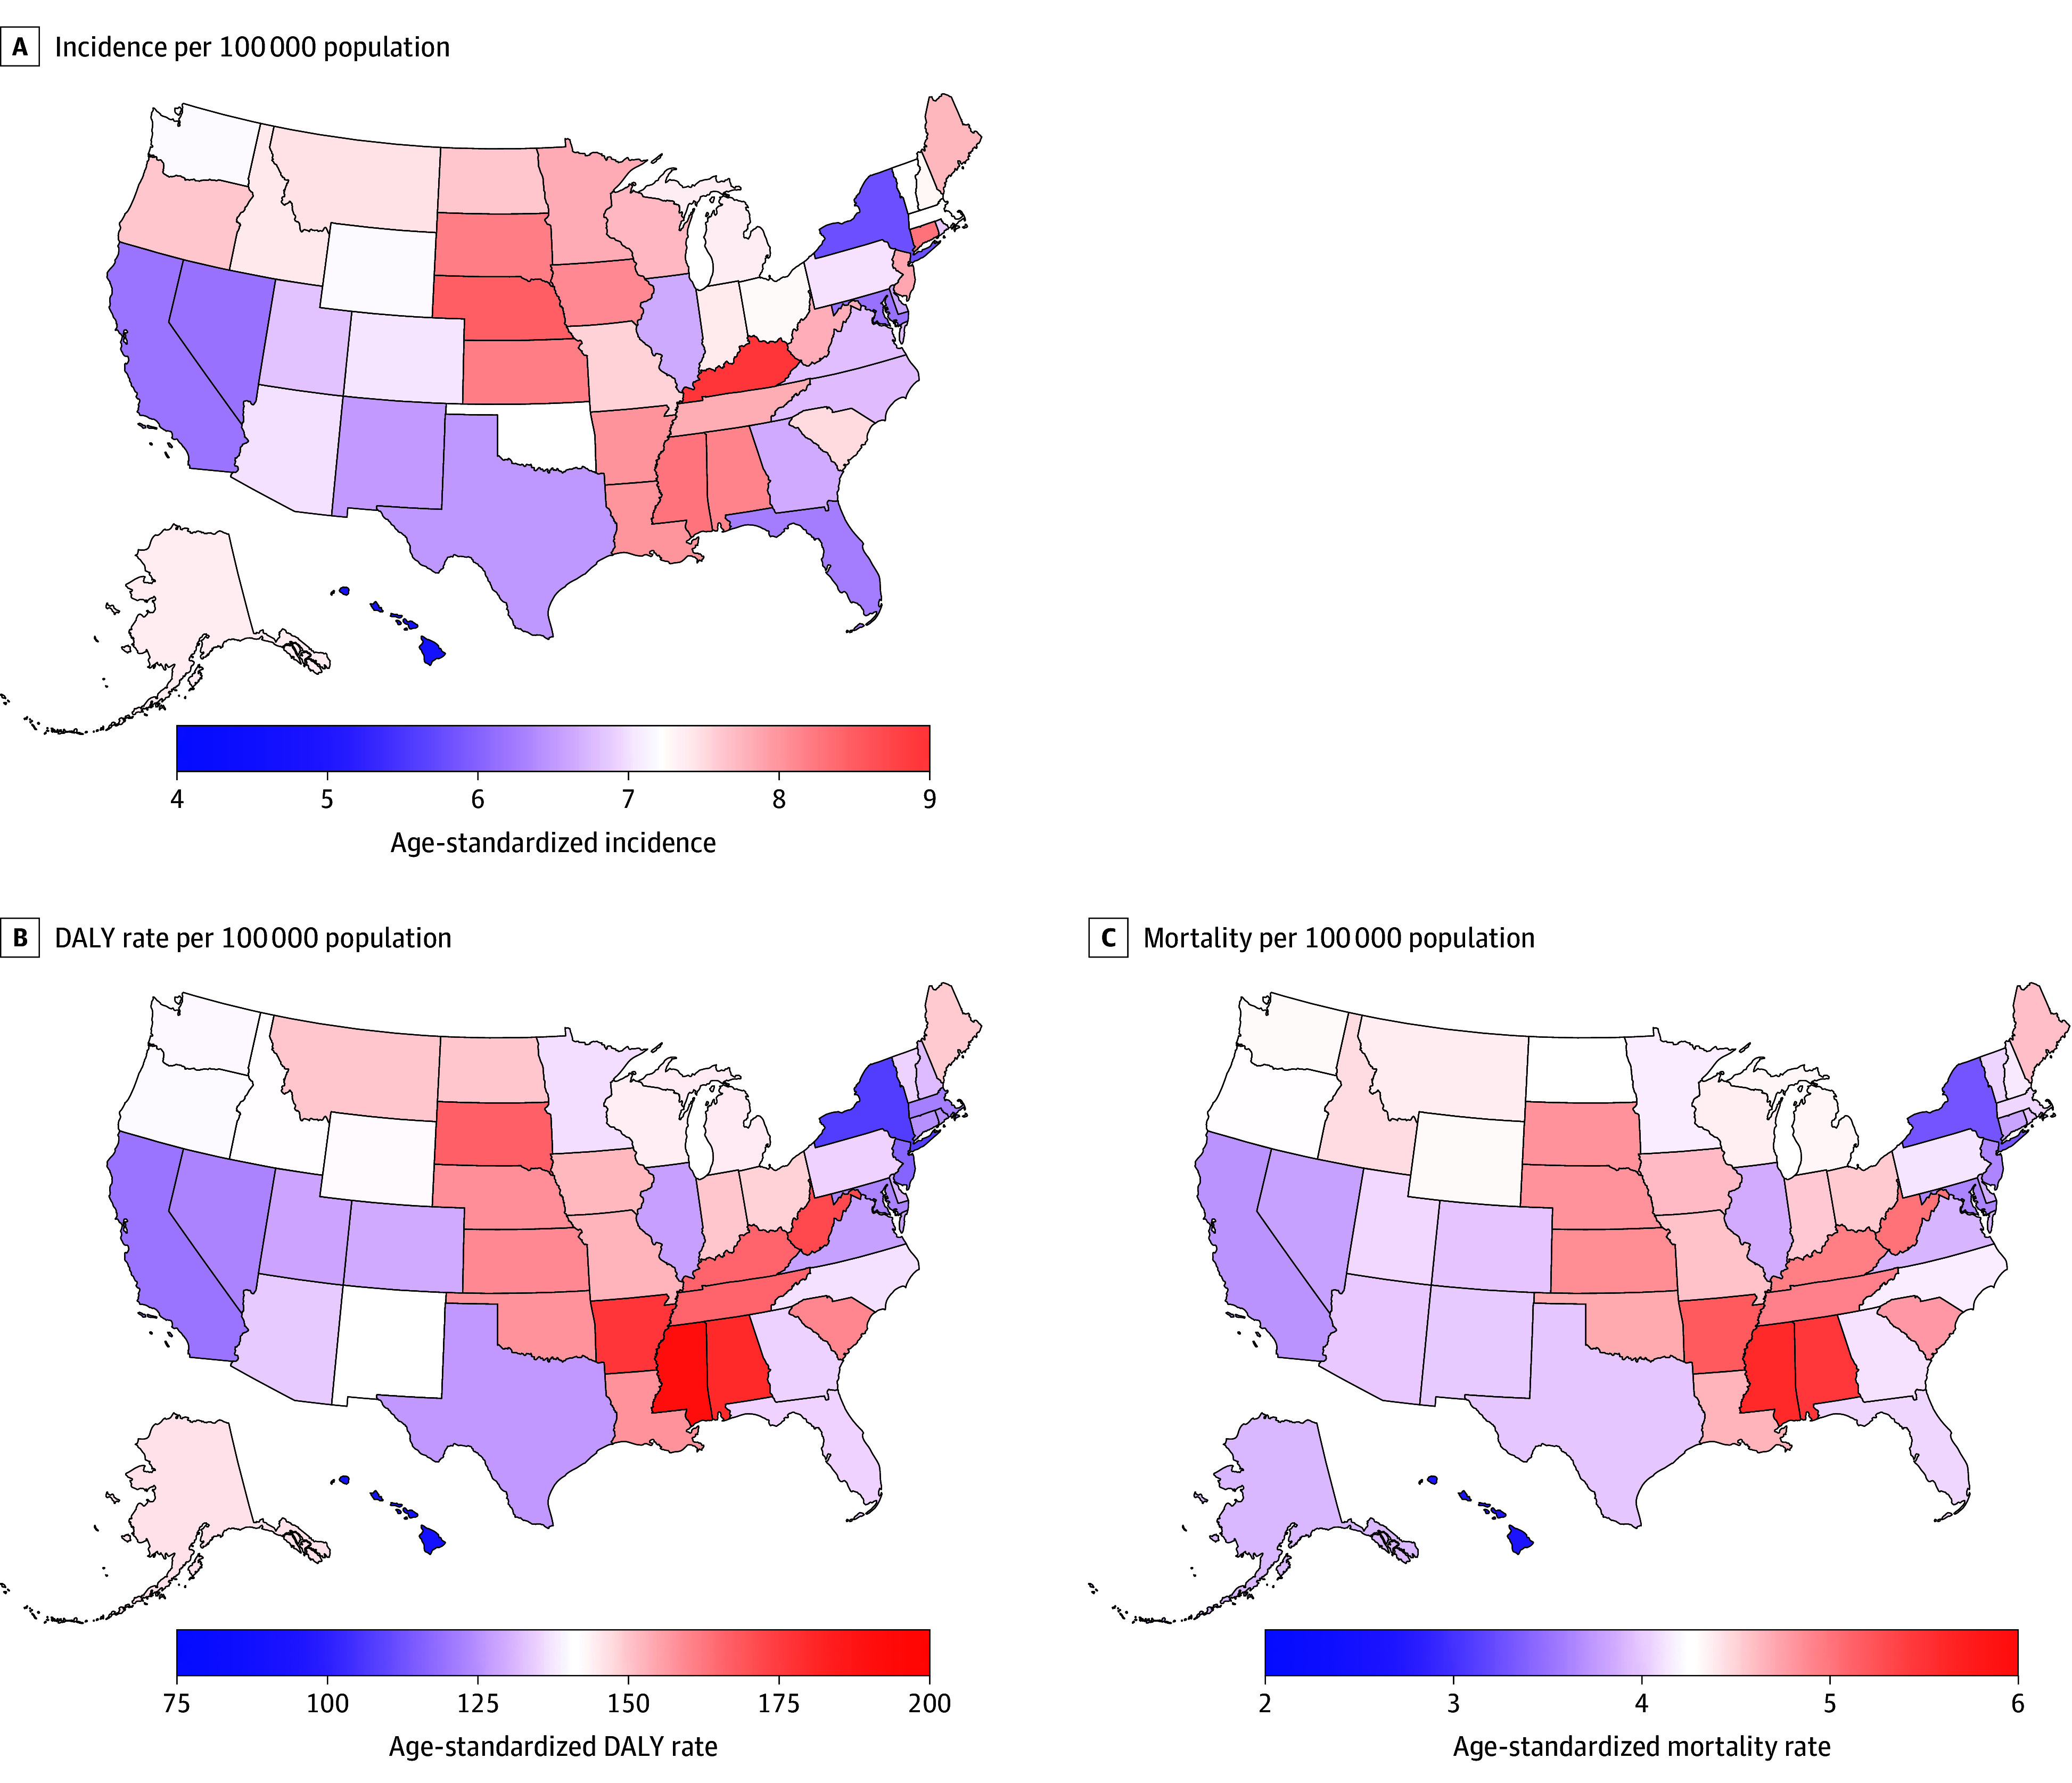 Figure 1
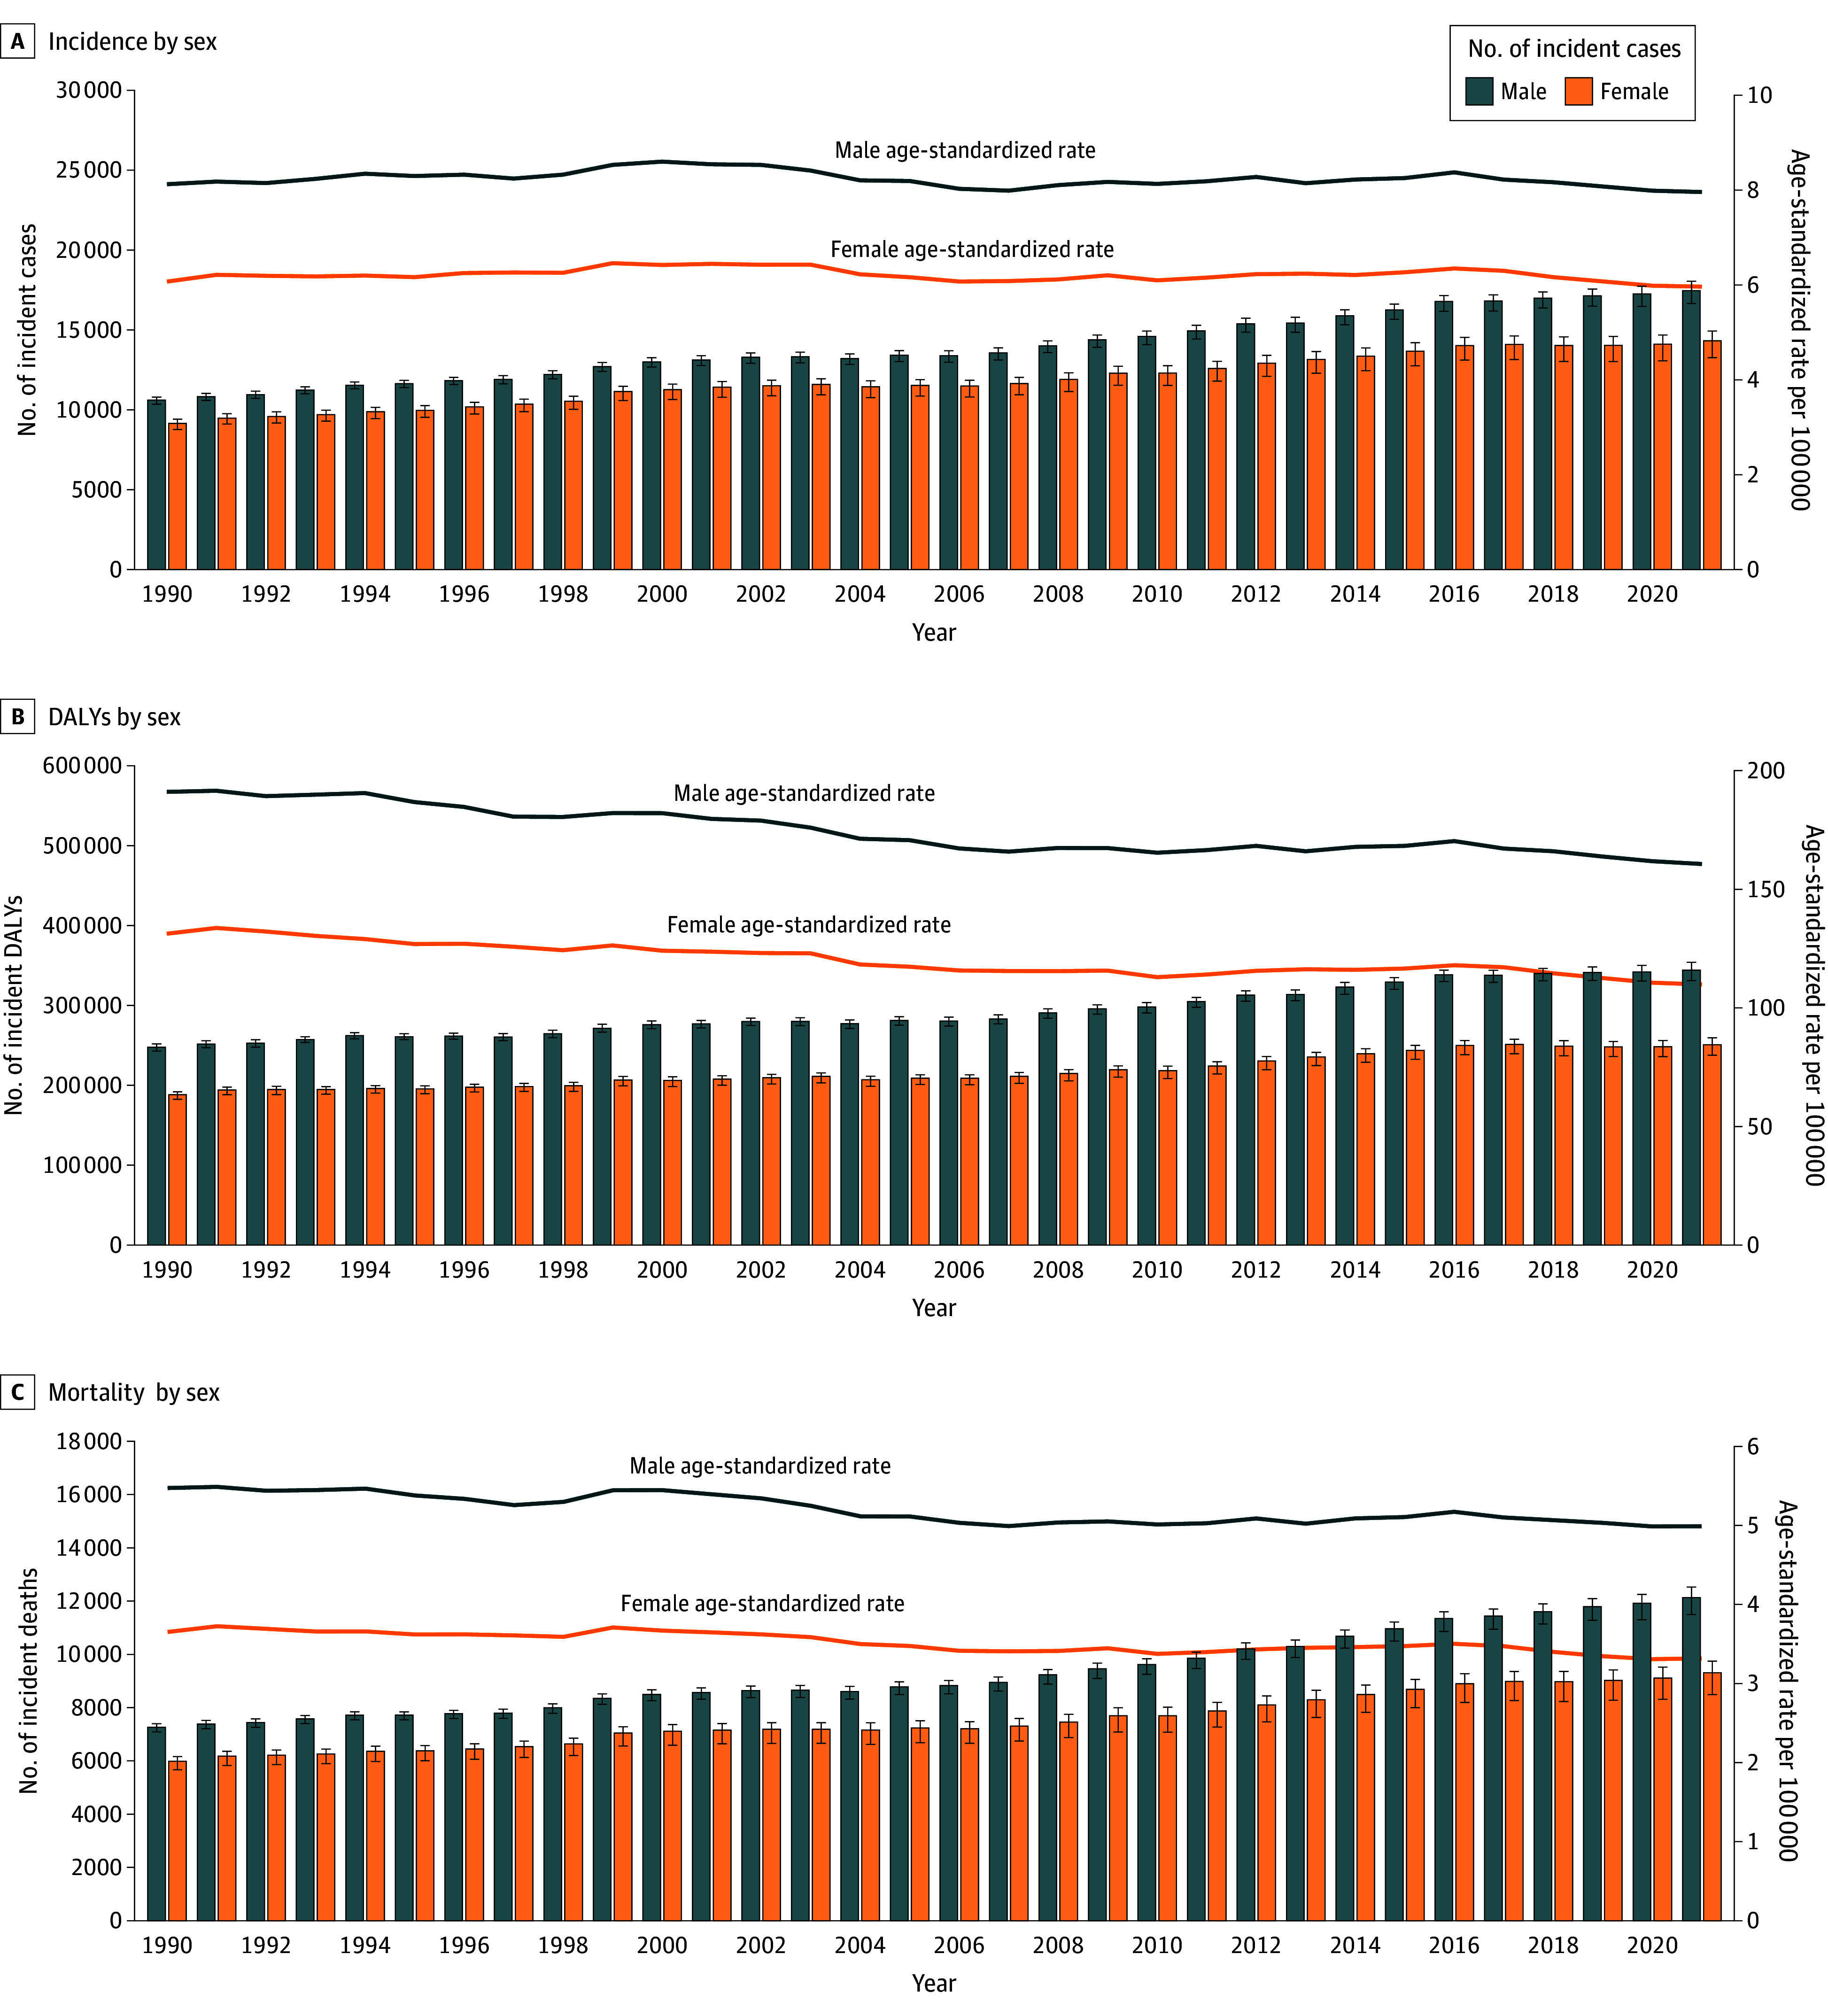 Figure 2
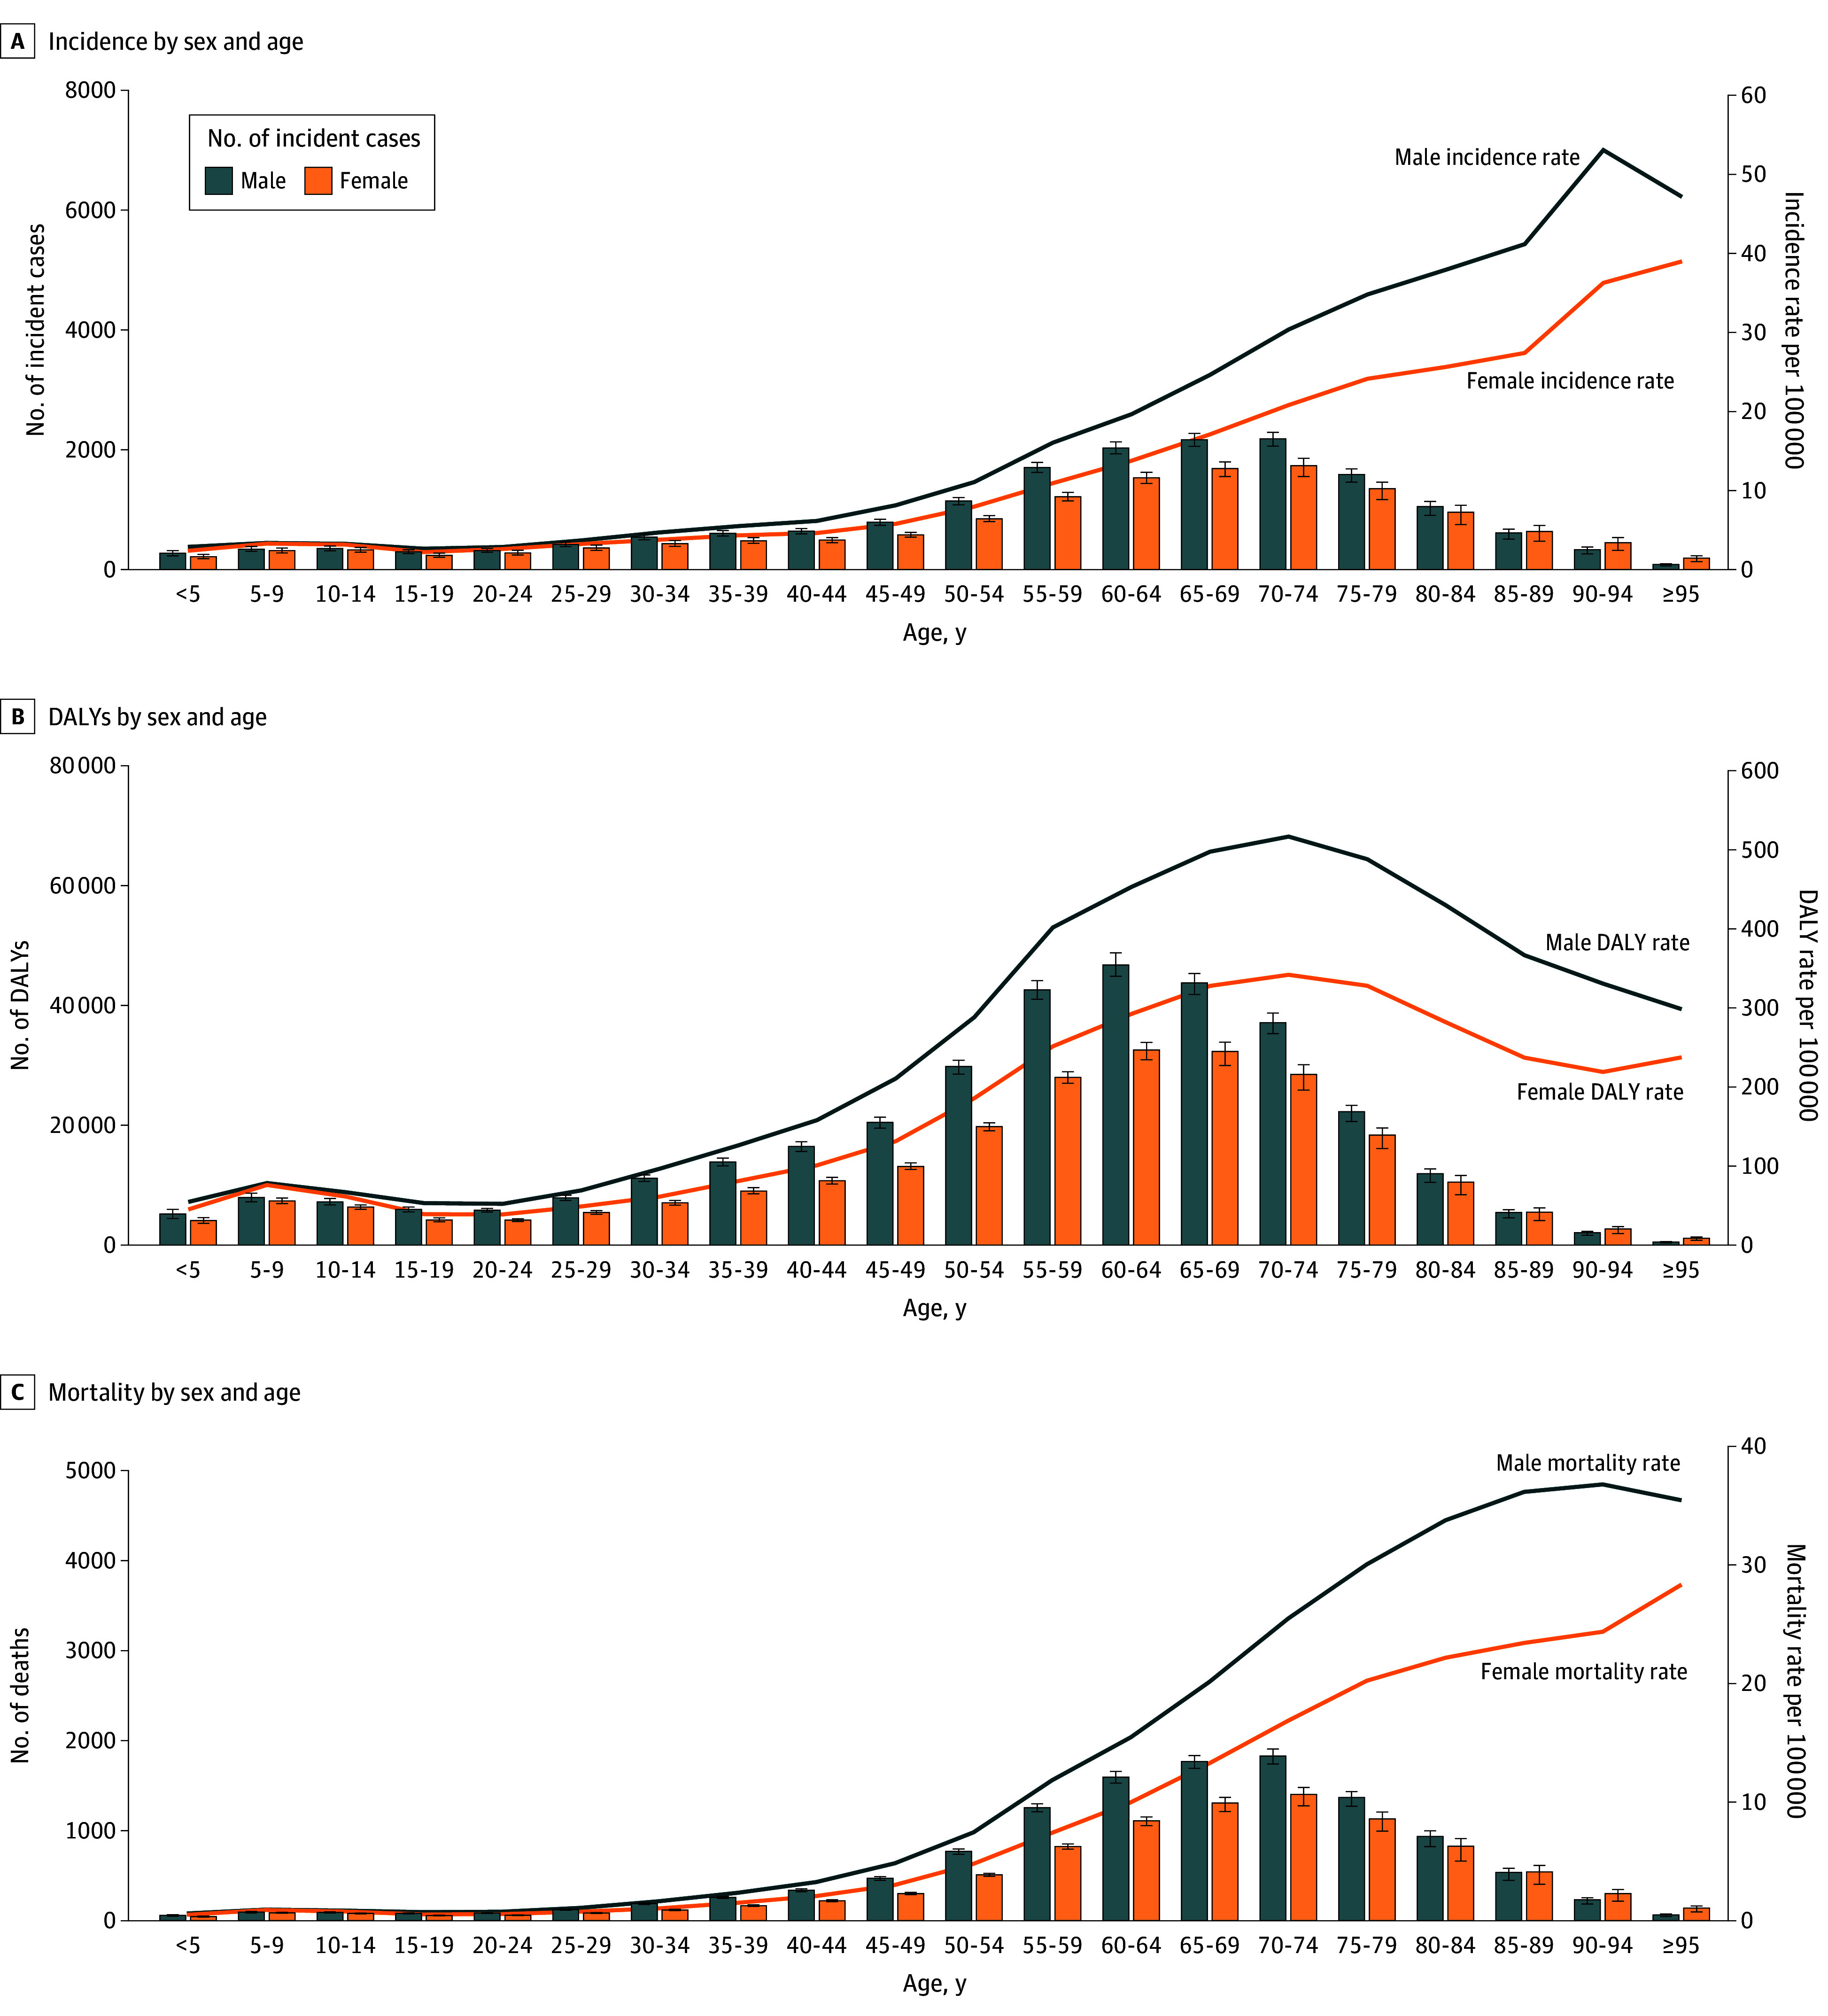 Figure 3
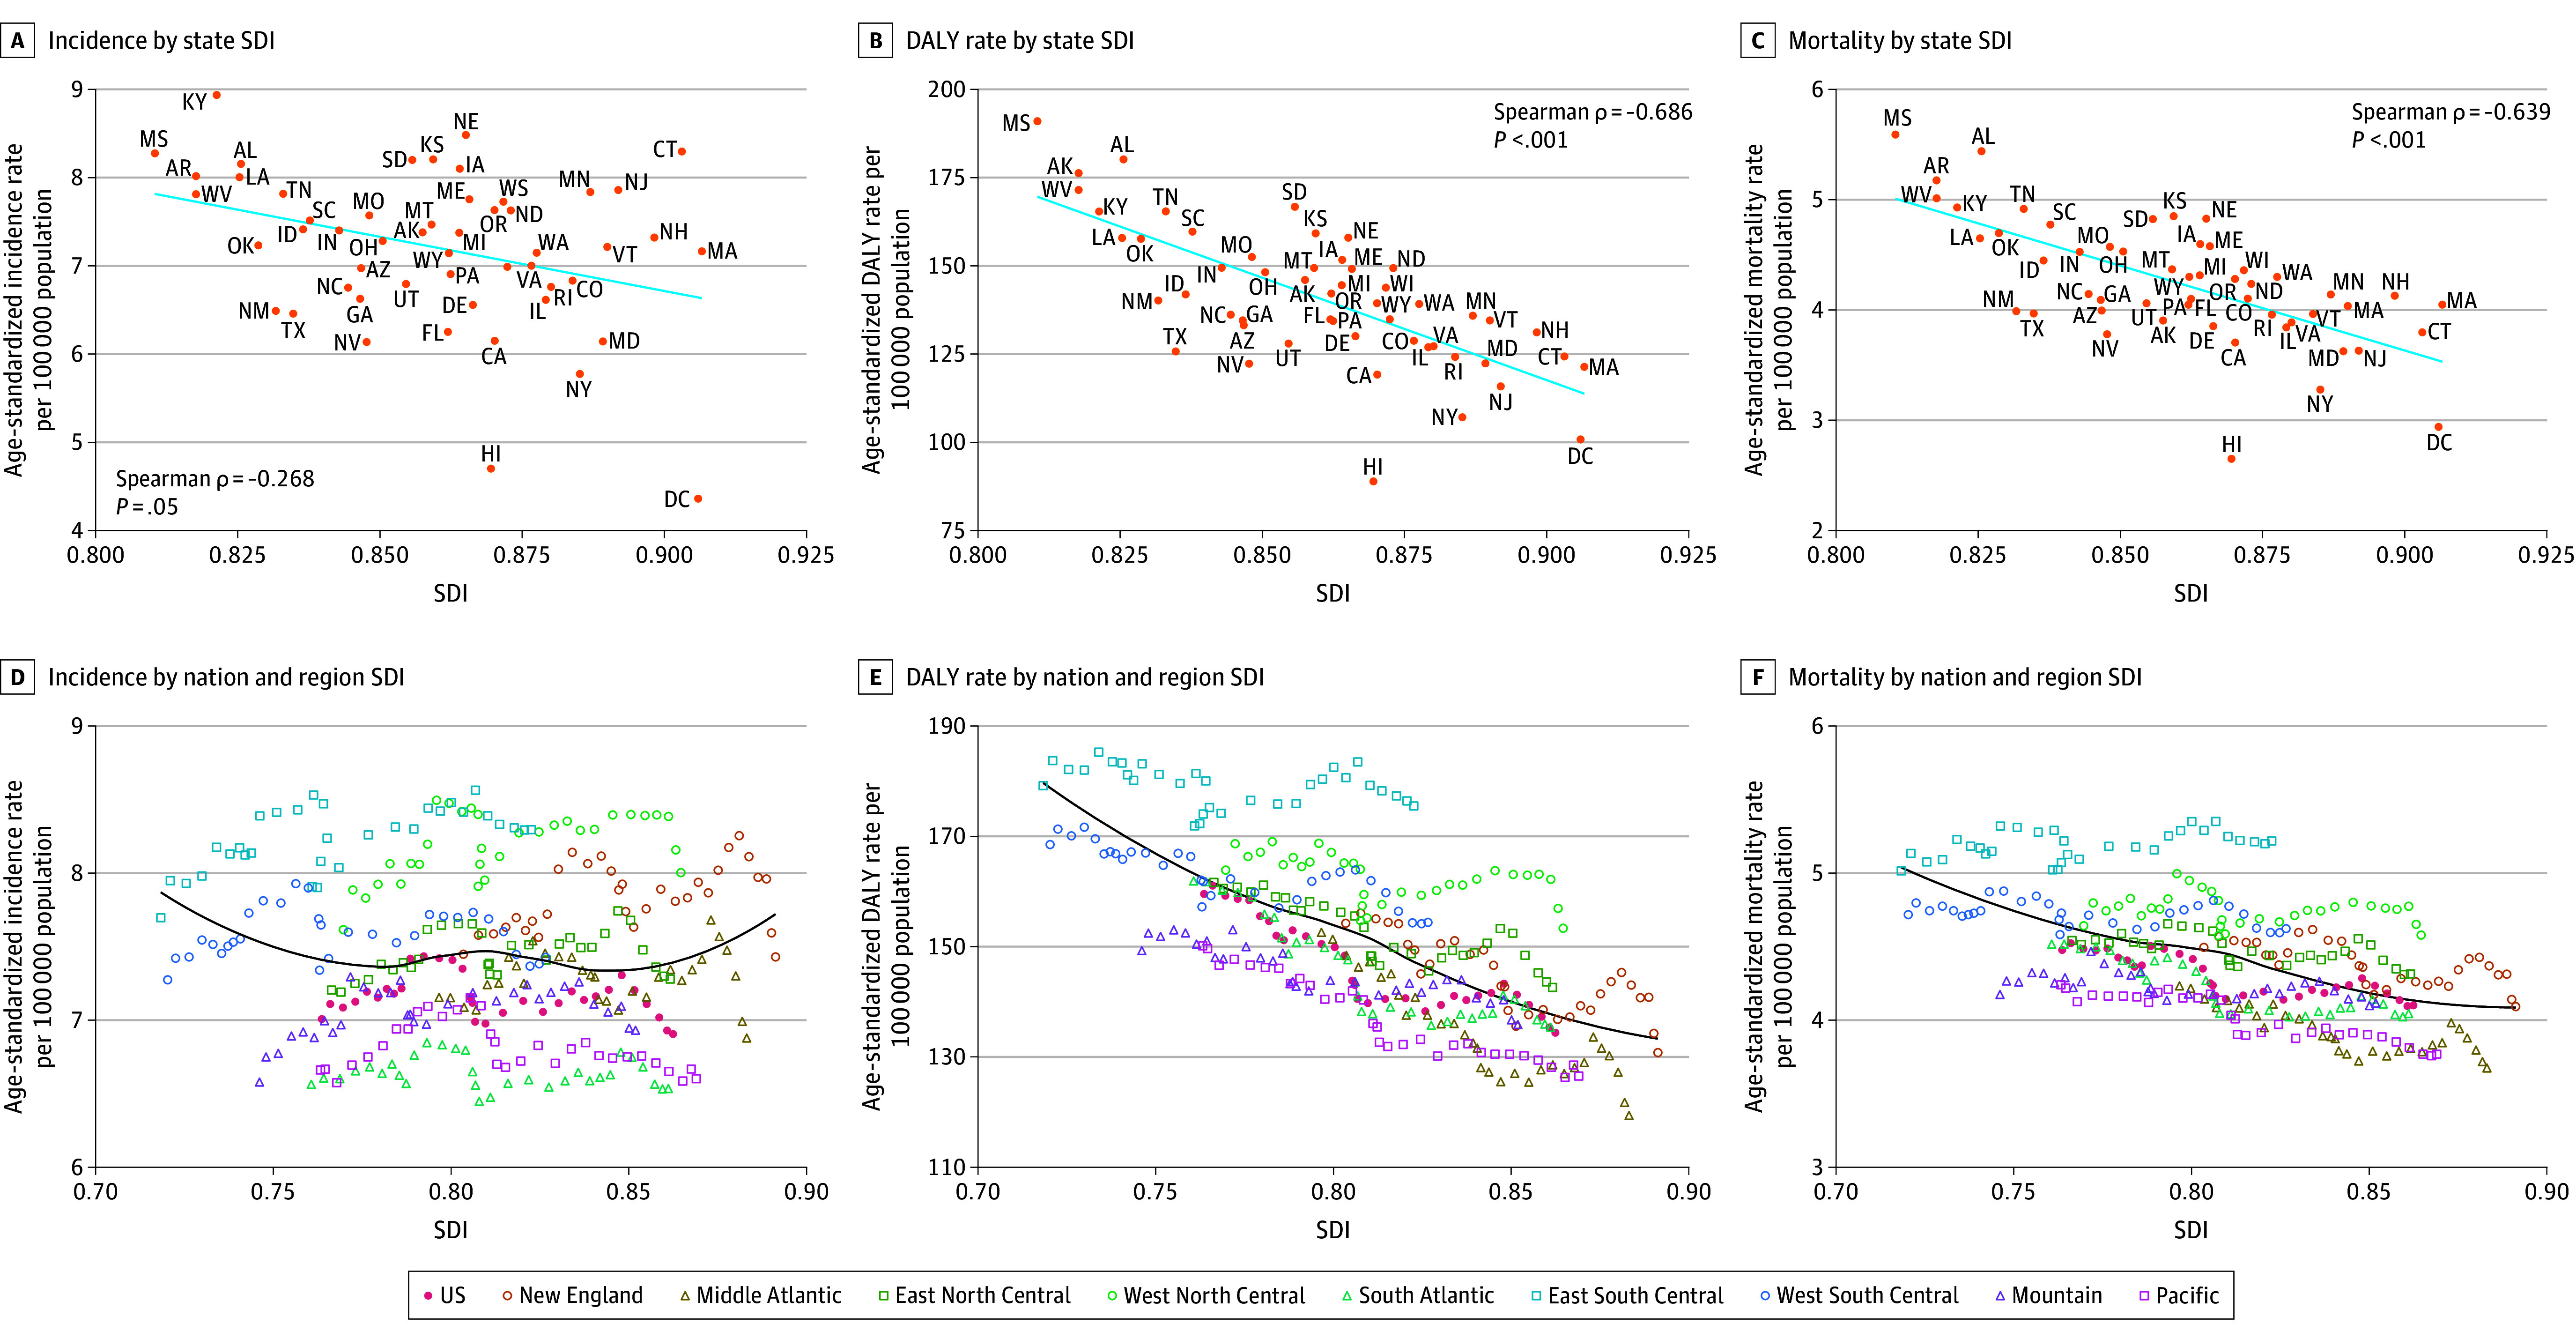 Figure 4
| Location | Incidence (95% UI) | DALYs (95% UI) | Deaths (95% UI) | ||||||
|---|---|---|---|---|---|---|---|---|---|
| Absolute No. (2021) | Age-standardized rate per 100 000 people (2021) | Percentage change, % (1990-2021) | Absolute No. (2021) | Age-standardized rate per 100 000 people (2021) | Percentage change, % (1990-2021) | Absolute No. (2021) | Age-standardized rate per 100 000 people (2021) | Percentage change, % (1990-2021) | |
| United States | 31 780.00 (29 971.10 to 32 843.90) | 6.91 (6.58 to 7.12) | −1.45 (−4.41 to 0.91) | 594 996.15 (571 294.69 to 610 278.40) | 134.38 (129.83 to 137.95) | −15.77 (−17.75 to −13.68) | 21 444.08 (20 045.85 to 22 166.97) | 4.10 (3.87 to 4.22) | −8.41 (−11.09 to −6.22) |
| Alabama | 577.20 (494.55 to 664.25) | 8.15 (7.05 to 9.33) | 8.51 (−7.36 to 25.85) | 12 101.20 (10 421.29 to 13 949.93) | 180.17 (157.11 to 205.96) | −2.28 (−14.59 to 12.56) | 431.10 (369.87 to 497.72) | 5.44 (4.69 to 6.26) | 5.79 (−8.70 to 22.35) |
| Alaska | 62.55 (54.14 to 73.83) | 7.38 (6.29 to 9.24) | 18.53 (−0.70 to 47.07) | 1236.42 (1060.70 to 1443.72) | 146.00 (124.29 to 176.99) | −0.07 (−15.75 to 22.19) | 37.31 (32.51 to 42.78) | 3.90 (3.38 to 4.51) | −4.80 (−17.40 to 10.28) |
| Arizona | 689.13 (592.22 to 794.93) | 6.97 (6.02 to 8.01) | 8.88 (−6.21 to 26.03) | 12 601.23 (10 792.16 to 14 520.14) | 133.18 (115.31 to 152.62) | −8.63 (−20.92 to 4.66) | 454.62 (390.36 to 525.31) | 3.99 (3.45 to 4.60) | 1.42 (−12.51 to 16.81) |
| Arkansas | 329.31 (282.82 to 379.18) | 8.02 (6.95 to 9.18) | 3.75 (−11.37 to 19.38) | 6852.66 (5916.10 to 7889.39) | 176.27 (153.36 to 201.80) | −5.44 (−18.70 to 8.89) | 239.37 (205.65 to 276.38) | 5.17 (4.47 to 5.96) | 0.64 (−13.70 to 16.89) |
| California | 3222.04 (2821.36 to 3667.82) | 6.15 (5.42 to 7.02) | −6.16 (−18.70 to 7.46) | 61 314.24 (53 415.78 to 69 330.06) | 119.18 (105.50 to 134.14) | −22.15 (−31.47 to −12.10) | 2210.66 (1869.90 to 2503.29) | 3.70 (3.17 to 4.19) | −12.56 (−24.18 to −1.20) |
| Colorado | 546.88 (458.09 to 640.35) | 7.00 (5.88 to 8.18) | −1.08 (−17.16 to 15.51) | 9900.18 (8274.83 to 11 553.66) | 128.77 (109.46 to 148.96) | −16.11 (−29.51 to −2.75) | 348.79 (287.07 to 408.63) | 3.96 (3.29 to 4.62) | −9.33 (−24.20 to 6.00) |
| Connecticut | 441.28 (364.92 to 524.88) | 8.30 (6.93 to 9.77) | −3.87 (−19.98 to 14.96) | 6305.03 (5250.93 to 7410.65) | 124.32 (103.84 to 144.44) | −18.07 (−31.23 to −3.83) | 233.62 (195.62 to 275.14) | 3.80 (3.17 to 4.46) | −11.33 (−25.37 to 4.96) |
| Delaware | 93.57 (82.96 to 105.27) | 6.56 (5.78 to 7.36) | 1.63 (−10.61 to 14.82) | 1772.88 (1569.10 to 1993.90) | 130.07 (116.15 to 144.98) | −12.90 (−23.30 to −2.16) | 63.60 (56.43 to 72.18) | 3.85 (3.42 to 4.34) | −10.88 (−21.09 to 0.47) |
| Washington, DC | 36.01 (30.73 to 41.41) | 4.36 (3.76 to 5.02) | −23.70 (−36.04 to −10.90) | 803.70 (688.50 to 927.22) | 100.80 (87.13 to 116.03) | −43.24 (−51.77 to −33.88) | 26.10 (22.39 to 30.10) | 2.94 (2.53 to 3.39) | −34.07 (−44.23 to −22.97) |
| Florida | 2014.68 (1705.77 to 2361.49) | 6.25 (5.38 to 7.30) | −1.40 (−16.34 to 15.53) | 41 025.10 (35 027.99 to 47 563.22) | 134.83 (116.98 to 154.42) | −16.55 (−27.28 to −4.04) | 1550.85 (1306.73 to 1804.19) | 4.05 (3.45 to 4.68) | −9.00 (−21.41 to 4.78) |
| Georgia | 944.64 (817.93 to 1088.00) | 6.63 (5.75 to 7.60) | −0.94 (−13.40 to 15.11) | 18 538.30 (16 038.82 to 21 346.26) | 134.53 (117.65 to 153.81) | −17.99 (−27.91 to −6.08) | 642.28 (552.39 to 742.02) | 4.09 (3.54 to 4.70) | −10.12 (−21.77 to 3.63) |
| Hawaiʻi | 98.41 (83.81 to 113.45) | 4.70 (4.04 to 5.38) | 0.44 (−15.36 to 16.65) | 1765.70 (1500.81 to 2043.79) | 88.92 (76.15 to 103.05) | −14.52 (−26.75 to −1.07) | 64.48 (54.20 to 75.40) | 2.65 (2.25 to 3.06) | −7.30 (−21.29 to 8.23) |
| Idaho | 186.15 (155.07 to 215.44) | 7.41 (6.22 to 8.51) | 2.07 (−14.30 to 17.97) | 3432.33 (2882.96 to 4000.04) | 141.91 (120.67 to 164.02) | −11.89 (−25.48 to 2.71) | 124.88 (104.84 to 145.33) | 4.45 (3.73 to 5.18) | −3.44 (−18.46 to 12.87) |
| Illinois | 1153.81 (983.09 to 1328.59) | 6.61 (5.67 to 7.63) | −0.73 (−14.83 to 14.85) | 21 395.86 (18 231.59 to 24 675.02) | 126.94 (110.01 to 145.35) | −18.65 (−29.96 to −6.79) | 763.47 (644.06 to 882.76) | 3.84 (3.27 to 4.43) | −12.17 (−24.69 to 1.40) |
| Indiana | 683.75 (590.63 to 785.55) | 7.40 (6.43 to 8.46) | 3.60 (−11.72 to 19.33) | 13 277.60 (11 457.27 to 15 223.53) | 149.46 (130.71 to 170.79) | −7.32 (−19.90 to 6.49) | 473.13 (400.75 to 545.55) | 4.53 (3.89 to 5.20) | 0.10 (−13.45 to 15.30) |
| Iowa | 369.42 (314.54 to 424.47) | 8.10 (6.91 to 9.31) | 10.10 (−7.45 to 30.95) | 6470.76 (5462.96 to 7484.52) | 151.68 (129.75 to 173.70) | −3.00 (−17.89 to 12.42) | 238.12 (202.57 to 276.29) | 4.60 (3.89 to 5.31) | 3.00 (−13.12 to 19.52) |
| Kansas | 325.60 (274.03 to 379.48) | 8.21 (6.96 to 9.48) | 8.55 (−8.11 to 27.71) | 6065.12 (5093.86 to 7057.89) | 159.20 (134.37 to 184.40) | −1.65 (−16.67 to 14.31) | 217.02 (181.89 to 252.41) | 4.85 (4.06 to 5.63) | 6.28 (−10.57 to 23.74) |
| Kentucky | 555.83 (476.87 to 643.56) | 8.94 (7.69 to 10.30) | 4.12 (−10.60 to 22.22) | 9934.74 (8481.61 to 11386.97) | 165.41 (141.72 to 189.20) | −2.87 (−16.54 to 11.71) | 347.09 (296.82 to 398.74) | 4.93 (4.22 to 5.64) | 1.86 (−12.88 to 17.21) |
| Louisiana | 493.28 (425.83 to 572.70) | 8.00 (6.91 to 9.28) | 11.74 (−3.52 to 29.91) | 9368.70 (8129.14 to 10827.33) | 157.90 (137.87 to 180.31) | −2.25 (−15.60 to 12.50) | 318.33 (274.31 to 368.21) | 4.65 (4.03 to 5.39) | 4.59 (−9.95 to 21.43) |
| Maine | 168.80 (143.45 to 196.71) | 7.75 (6.62 to 9.06) | 7.85 (−8.56 to 26.84) | 3074.00 (2633.58 to 3581.83) | 149.12 (128.42 to 173.16) | −2.03 (−17.38 to 14.16) | 117.46 (100.96 to 136.39) | 4.58 (3.95 to 5.32) | 3.04 (−12.96 to 19.54) |
| Maryland | 514.77 (437.04 to 601.98) | 6.14 (5.25 to 7.18) | −10.53 (−24.45 to 5.36) | 9925.91 (8409.08 to 11 597.29) | 122.36 (104.67 to 142.28) | −23.64 (−35.50 to −11.19) | 345.07 (290.35 to 401.34) | 3.62 (3.09 to 4.21) | −20.78 (−32.67 to −7.05) |
| Massachusetts | 759.53 (631.27 to 915.03) | 7.16 (6.00 to 8.52) | −5.84 (−20.41 to 12.62) | 12 399.13 (10 299.74 to 14 737.10) | 121.38 (101.83 to 143.06) | −23.54 (−36.75 to −8.91) | 487.27 (407.18 to 578.58) | 4.05 (3.39 to 4.79) | −11.83 (−26.33 to 5.12) |
| Michigan | 1087.91 (926.13 to 1269.72) | 7.37 (6.33 to 8.53) | −1.13 (−16.19 to 14.79) | 19 945.49 (17 186.55 to 23 066.13) | 144.51 (125.37 to 164.88) | −14.85 (−26.33 to −2.02) | 723.15 (618.15 to 837.42) | 4.31 (3.72 to 4.97) | −8.83 (−21.45 to 5.63) |
| Minnesota | 615.17 (512.29 to 719.75) | 7.84 (6.63 to 9.13) | −1.20 (−18.05 to 16.59) | 10 384.67 (8675.63 to 12 151.06) | 135.87 (115.22 to 157.35) | −14.84 (−28.20 to −1.15) | 376.87 (312.99 to 442.82) | 4.14 (3.47 to 4.85) | −10.20 (−24.67 to 5.50) |
| Mississippi | 329.45 (286.04 to 379.53) | 8.27 (7.22 to 9.53) | 15.31 (−0.51 to 34.73) | 7219.27 (6234.69 to 8334.50) | 190.99 (166.57 to 218.22) | 4.85 (−8.82 to 20.26) | 247.62 (211.82 to 286.37) | 5.59 (4.83 to 6.43) | 12.39 (−2.59 to 30.38) |
| Missouri | 651.66 (557.40 to 752.73) | 7.57 (6.52 to 8.74) | 6.22 (−10.29 to 24.03) | 12 559.74 (10 689.92 to 14 584.60) | 152.51 (130.91 to 175.56) | −6.28 (−20.62 to 8.50) | 449.74 (384.83 to 521.45) | 4.57 (3.92 to 5.29) | 0.46 (−14.45 to 16.53) |
| Montana | 117.41 (101.33 to 135.59) | 7.47 (6.47 to 8.59) | 10.43 (−5.27 to 28.74) | 2221.65 (1921.92 to 2575.68) | 149.41 (131.00 to 172.50) | −1.20 (−14.66 to 14.87) | 80.73 (68.94 to 93.86) | 4.37 (3.77 to 5.05) | 2.83 (−11.83 to 18.94) |
| Nebraska | 225.00 (192.92 to 259.31) | 8.48 (7.33 to 9.79) | 6.40 (−9.96 to 23.21) | 4010.40 (3422.24 to 4614.39) | 157.97 (136.30 to 181.23) | −6.97 (−20.95 to 8.06) | 145.54 (124.62 to 167.70) | 4.83 (4.14 to 5.55) | 0.43 (−14.31 to 16.03) |
| Nevada | 258.69 (221.47 to 298.64) | 6.14 (5.25 to 7.01) | −2.03 (−16.05 to 13.61) | 5017.97 (4270.03 to 5791.08) | 122.27 (105.48 to 140.03) | −17.23 (−29.16 to −4.55) | 177.35 (150.53 to 205.76) | 3.78 (3.21 to 4.36) | −9.48 (−22.91 to 4.97) |
| New Hampshire | 155.97 (131.01 to 181.13) | 7.32 (6.25 to 8.50) | 4.67 (−11.56 to 22.24) | 2721.21 (2316.43 to 3187.75) | 131.15 (112.06 to 152.69) | −11.21 (−24.68 to 4.28) | 102.97 (87.20 to 119.74) | 4.13 (3.50 to 4.80) | −5.77 (−20.29 to 10.74) |
| New Jersey | 1041.90 (886.76 to 1234.29) | 7.86 (6.75 to 9.17) | −4.59 (−20.32 to 12.04) | 15 117.62 (12 809.10 to 17 713.22) | 115.83 (99.03 to 134.88) | −22.84 (−34.72 to −10.03) | 553.34 (464.85 to 648.87) | 3.63 (3.07 to 4.25) | −12.25 (−25.75 to 2.38) |
| New Mexico | 187.84 (159.85 to 220.23) | 6.49 (5.54 to 7.55) | 20.20 (0.31 to 41.59) | 3851.21 (3292.56 to 4506.07) | 140.18 (120.51 to 162.98) | 6.32 (−9.70 to 24.49) | 131.70 (111.89 to 154.40) | 3.99 (3.40 to 4.68) | 12.96 (−4.28 to 32.98) |
| New York | 1634.52 (1363.18 to 1896.40) | 5.77 (4.90 to 6.61) | −3.95 (−17.61 to 11.62) | 29 165.78 (24 989.81 to 33 942.49) | 107.08 (92.70 to 123.05) | −25.71 (−35.88 to −14.22) | 1064.05 (889.34 to 1243.64) | 3.28 (2.78 to 3.81) | −16.71 (−28.68 to −2.53) |
| North Carolina | 986.00 (841.10 to 1133.65) | 6.75 (5.83 to 7.73) | −2.29 (−16.41 to 13.32) | 19 069.23 (16 258.53 to 22 105.39) | 136.16 (117.31 to 156.27) | −17.40 (−29.19 to −4.57) | 686.44 (583.68 to 797.34) | 4.14 (3.53 to 4.78) | −11.71 (−24.77 to 2.24) |
| North Dakota | 77.91 (66.43 to 89.53) | 7.63 (6.62 to 8.72) | 0.22 (−14.58 to 17.22) | 1448.59 (1250.01 to 1651.14) | 149.37 (129.48 to 169.48) | −8.39 (−20.47 to 5.77) | 49.93 (42.66 to 57.53) | 4.24 (3.62 to 4.86) | −9.76 (−22.63 to 4.27) |
| Ohio | 1233.82 (1057.31 to 1415.40) | 7.28 (6.26 to 8.36) | 4.62 (−10.38 to 20.75) | 23 938.82 (20 681.47 to 27 426.39) | 148.18 (129.22 to 168.38) | −6.58 (−18.03 to 6.62) | 875.23 (752.41 to 1002.29) | 4.53 (3.91 to 5.17) | 1.92 (−11.44 to 16.96) |
| Oklahoma | 384.58 (332.27 to 439.83) | 7.23 (6.25 to 8.22) | 1.98 (−12.44 to 17.19) | 7986.77 (6975.08 to 9163.00) | 157.67 (138.54 to 178.51) | −2.24 (−14.60 to 11.19) | 277.78 (241.11 to 322.28) | 4.70 (4.10 to 5.41) | 2.38 (−11.06 to 17.15) |
| Oregon | 477.20 (403.52 to 570.51) | 7.63 (6.48 to 8.96) | −6.62 (−20.80 to 10.65) | 8370.64 (7216.96 to 9925.13) | 139.39 (120.78 to 163.47) | −19.94 (−31.20 to −5.79) | 311.07 (263.81 to 368.72) | 4.28 (3.67 to 5.05) | −14.28 (−26.75 to 1.14) |
| Pennsylvania | 1332.71 (1132.28 to 1555.43) | 6.99 (6.00 to 8.03) | −2.95 (−16.64 to 11.87) | 24 365.97 (20 850.12 to 28 080.39) | 134.86 (116.92 to 153.91) | −17.31 (−28.41 to −5.28) | 910.51 (773.63 to 1056.32) | 4.10 (3.52 to 4.73) | −11.06 (−23.71 to 2.53) |
| Rhode Island | 111.80 (93.65 to 130.90) | 6.83 (5.75 to 7.93) | −9.49 (−24.61 to 7.29) | 1942.70 (1642.19 to 2285.10) | 124.20 (104.76 to 145.85) | −24.70 (−37.61 to −10.80) | 74.87 (63.27 to 88.05) | 3.96 (3.37 to 4.65) | −18.17 (−31.43 to −3.07) |
| South Carolina | 550.04 (466.96 to 624.86) | 7.51 (6.42 to 8.55) | 5.83 (−8.85 to 22.18) | 11 109.62 (9461.01 to 12 826.51) | 159.68 (137.93 to 182.62) | −11.16 (−22.98 to 2.92) | 396.86 (336.80 to 455.84) | 4.77 (4.08 to 5.46) | −5.08 (−19.19 to 9.53) |
| South Dakota | 98.02 (85.47 to 111.68) | 8.20 (7.20 to 9.28) | 5.83 (−9.62 to 21.34) | 1882.96 (1652.59 to 2151.85) | 166.73 (147.66 to 188.62) | −4.01 (−16.42 to 9.54) | 66.38 (57.98 to 76.28) | 4.82 (4.24 to 5.51) | 0.49 (−13.29 to 15.36) |
| Tennessee | 749.94 (644.39 to 868.91) | 7.82 (6.78 to 8.99) | 4.05 (−10.38 to 19.87) | 15 222.68 (13 134.04 to 17 647.11) | 165.44 (144.36 to 190.32) | −8.01 (−20.46 to 5.89) | 532.38 (457.98 to 619.03) | 4.92 (4.25 to 5.68) | −3.73 (−17.06 to 11.01) |
| Texas | 2391.76 (2093.89 to 2712.52) | 6.46 (5.67 to 7.32) | −9.25 (−20.86 to 4.57) | 45 797.20 (40 265.43 to 52 077.42) | 125.75 (111.40 to 141.99) | −23.70 (−32.75 to −13.49) | 1604.18 (1403.74 to 1822.03) | 3.97 (3.49 to 4.50) | −15.48 (−25.61 to −3.85) |
| Utah | 255.49 (219.38 to 295.14) | 6.79 (5.85 to 7.84) | 2.95 (−12.60 to 20.36) | 4742.85 (4125.22 to 5436.38) | 127.97 (111.60 to 145.88) | −13.54 (−24.83 to −0.90) | 160.82 (138.23 to 186.08) | 4.06 (3.50 to 4.69) | −2.74 (−16.17 to 11.84) |
| Vermont | 70.10 (60.97 to 79.92) | 7.21 (6.31 to 8.18) | 7.34 (−6.71 to 22.79) | 1248.30 (1102.58 to 1425.51) | 134.51 (120.29 to 152.18) | −10.34 (−20.66 to 1.62) | 46.74 (40.96 to 53.18) | 4.04 (3.55 to 4.59) | −8.87 (−19.78 to 3.77) |
| Virginia | 795.77 (675.35 to 932.51) | 6.76 (5.79 to 7.90) | 1.22 (−14.50 to 19.09) | 14 572.70 (12 356.32 to 17 082.83) | 127.22 (108.47 to 147.46) | −15.64 (−27.74 to −2.13) | 520.14 (439.82 to 607.38) | 3.89 (3.33 to 4.52) | −10.21 (−23.22 to 4.85) |
| Washington | 783.06 (661.33 to 912.26) | 7.15 (6.10 to 8.24) | −6.85 (−21.17 to 8.27) | 14 588.27 (12 284.27 to 16 899.23) | 139.19 (117.82 to 159.54) | −19.71 (−32.53 to −7.22) | 528.58 (446.54 to 611.98) | 4.30 (3.63 to 4.96) | −14.16 (−27.50 to 0.20) |
| West Virginia | 208.19 (179.15 to 241.45) | 7.81 (6.80 to 9.03) | 24.47 (6.71 to 44.56) | 4285.35 (3696.15 to 4948.00) | 171.50 (148.81 to 197.70) | 16.12 (0.32 to 34.27) | 153.77 (132.29 to 177.74) | 5.01 (4.34 to 5.79) | 19.21 (2.23 to 38.80) |
| Wisconsin | 644.43 (539.76 to 757.27) | 7.73 (6.49 to 8.98) | −0.93 (−17.26 to 16.45) | 11 553.83 (9837.41 to 13 515.33) | 143.82 (123.71 to 166.72) | −11.52 (−24.62 to 3.03) | 421.84 (357.27 to 493.42) | 4.36 (3.71 to 5.11) | −5.96 (−19.87 to 11.32) |
| Wyoming | 57.03 (49.90 to 64.12) | 7.14 (6.25 to 8.03) | 4.60 (−9.11 to 19.72) | 1093.84 (973.53 to 1231.17) | 142.15 (127.18 to 159.27) | −7.68 (−17.94 to 4.49) | 38.84 (33.99 to 43.70) | 4.30 (3.80 to 4.82) | −0.60 (−12.20 to 12.84) |
Peer Reviews
No public reviews on file for this paper yet. If you reviewed it on a platform where reviews are public (OpenReview, ICLR, NeurIPS, ICML), you can paste yours below so the community can read it here.
Videos
No videos yet. Explain this paper in a talk, walkthrough, or lecture? Add one.
Taxonomy
TopicsBrain Metastases and Treatment · Meningioma and schwannoma management · COVID-19 and healthcare impacts
Introduction
Primary brain and central nervous system cancer (collectively referred to as CNS cancer) constitutes 2% of all human cancers and is a heterogeneous disease that consists of solid tumors originating in the brain, spinal cord, cranial nerves, or meninges.^1^ The outcome of CNS cancers is quite variable, depending on tumor location and histology. In addition to high mortality, patients frequently experience neurological sequelae that can impair daily functioning and impose substantial stress on caregivers.^2^ Furthermore, the cost of advanced diagnostic tools and treatment methods (eg, drugs or adjuvant radiotherapy) potentially represents major economic challenges,^3^ especially in the most aggressive tumors and highest-grade malignancies.^4,5^
Previous analyses of the Global Burden of Disease Study (GBD) reported that the global age-standardized incidence rate of CNS cancer, per 100 000 population, increased from 3.75 in 1990 to 4.28 in 2021,^6,7^ with the US among the countries with the highest incidence.^8^ In 2023, a US nationwide analysis estimated 24 810 incident cases and 18 990 deaths,^9^ and total health care expenditures on CNS cancers increased by 2.5-fold (from 6.85 billion) over a decade, signifying significant upward trends in per capita expenditures.^10^
The contemporary public health and clinical medicine landscape calls for an up-to-date comprehensive study of the CNS cancer burden. Previous studies have highlighted the high incidence and economic burden of CNS cancer in the US but lacked detailed analyses of temporal trends, regional variations, and disparities across sociodemographic groups. Such disparities, well documented for other cancers in the US, are likely pertinent for CNS cancer.^11^
This study aimed to provide updated epidemiological estimates of CNS cancer in the US from 1990 to 2021, further stratified by geographic location (state and division), age, sex, and sociodemographic profile. Investigating these subgroup-specific burdens is vital for identifying disproportionately affected populations and guiding targeted resource allocation and public health interventions to reduce health inequalities.
Methods
Overview of Study and Data
The GBD 2021 adhered to the Guidelines for Accurate and Transparent Health Estimates Reporting (eAppendix 1 in Supplement 1).^12^ Because this study used publicly available, deidentified, and aggregated data from the GBD 2021, informed consent and institutional review board approval were not required. This article was produced as part of the GBD Collaborator Network and adheres to the GBD Protocol.^13^
This study used data from the repeated cross-sectional GBD 2021, coordinated by the Institute for Health Metrics and Evaluation (IHME), which integrates multiple data sources, including vital registration, verbal autopsy, and cancer registry data, to develop the GBD cause of death database, containing cancer mortality data.^14,15^ Epidemiologic estimates, including incidence, prevalence, deaths, years lived with disability (YLDs), years of life lost (YLLs), and disability-adjusted life-years (DALYs), were obtained for CNS cancers in all US states and the District of Columbia.^14,15^ CNS cancer cases were identified using the International Statistical Classification of Diseases and Related Health Problems, Tenth Revision, with CNS cancer codes C70-C72.9 and C75.1-C75.3 (eAppendix 2 in Supplement 1).^14^ US CNS cancer metrics were estimated from 183 registries and health records (eAppendix 3 in Supplement 1).
Statistical Analysis
The GBD estimation framework has been detailed previously.^14,15^ Briefly, mortality was derived using mortality to incidence ratios modeled with spatiotemporal gaussian process regression. Mortality estimates were calculated by multiplying the mortality to incidence ratios with cancer registry incidence data. Cause-specific mortality across states, years, and age groups was modeled using the cause of death ensemble model. YLLs were calculated by applying age-specific GBD life expectancy to the age-specific mortality estimates. YLDs were derived by combining prevalence estimates with the corresponding disability weights for various cancer survival stages. DALYs represents the sum of YLLs and YLDs, stratified by age, sex, location, and year, following methodologies described in the GBD capstone articles.^14,15^ The results were presented as mean values with 95% uncertainty intervals (UIs), which are used in the GBD study to reflect multiple sources of uncertainty (eg, sampling, modeling, and data sources) beyond what is captured by a traditional confidence interval. UIs were calculated from 500 draws from a log-normal distribution that incorporates this combined uncertainty. Significance was inferred if the UI excluded zero.
The Sociodemographic Index (SDI) is a composite metric of lag-distributed income per capita, average years of education for individuals aged 15 years and older (EDU15+), and the total fertility rate of those younger than 25 years (TFU25). The indicators were normalized (0-1), and their geometric mean was used for the final SDI. State-specific data extracted from the GBD 2021 demographics database were matched to each state-year.^16^ The division-level SDI was averaged from state-level values within each of the 9 geographic divisions defined by the US Census Bureau (eg, New England, Pacific), which group states into regions for analysis.^17^ As suitable data for lag-distributed income and EDU15+ were unavailable, the 2021 per capita income and high school graduation (or equivalency) rates for individuals 18 years and older were used as proxies.^18,19^ TFU25 data were sourced from the Centers for Disease Control and Prevention.^20,21^
Spearman rank-order correlation quantified the overall monotonic association between the SDI of US states and the age-standardized incidence, mortality, and DALY rates, while locally weighted scatterplot smoothing was used to visualize potential nonlinear associations between SDI and the age-standardized burden metrics at the division level. Statistical significance was defined as 2-sided P < .05. Secondary analyses were performed using Python version 3.10.4 (Python Software Foundation) and R version 4.2.1 (R Foundation).
Results
Overall Trends in the US
In 2021, there were estimated 31 780 incident cases (95% UI, 29 971.10 to 32 843.90) of CNS cancer in the US, corresponding to an age-standardized incidence rate of 6.91 (95% UI, 6.58 to 7.12) per 100 000 population (Table). The DALY rate per 100 000 population in 2021 was 134.38 (95% UI, 129.83 to 137.95), primarily from YLLs (131.78; 95% UI, 127.25 to 134.95) rather than YLDs (2.60; 95% UI, 1.92 to 3.40). Between 1990 and 2021, DALYs and mortality significantly decreased (15.77%; 95% UI, −17.75% to −13.68%; and 8.41%; 95% UI, −11.09% to −6.22%, respectively), whereas the incidence rate did not change significantly (−1.45%; 95% UI, −4.41% to 0.91%). The changes in the DALY rate were primarily driven by YLLs (−16.06%; 95% UI, −18.03% to −14.00%; YLDs, 2.03%; 95% UI, −2.10% to 6.25%).
Geographic Variation in CNS Cancer Burden
Age-standardized incidence, DALYs, and mortality rates showed notable geographic variations. In 2021, age-standardized incidence rates per 100 000 population were generally higher in the West North Central (Nebraska, Kansas) and East South Central divisions (Kentucky, Mississippi) (Figure 1A), with the highest in Kentucky (8.94; 95% UI, 7.69 to 10.30). In contrast, coastal states generally had lower rates, with the lowest in Washington, DC (4.36 per 100 000 population; 95% UI, 3.76 to 5.02), followed by Hawaiʻi, New York, and Maryland. From 1990 to 2021, the change in incidence rates ranged from 24.47% (95% UI, 6.71% to 44.56%) in West Virginia to −23.70% (95% UI, −36.04% to −10.90%) in Washington, DC. However, no significant changes were observed in 48 of 50 states and Washington, DC.
Central Nervous System Cancer Burden Across US States, 2021Age-standardized rates for incidence (A), disability-adjusted life-years (DALYs) (B), and mortality (C) per 100 000 population of central nervous system cancer in the US, 2021.
In 2021, age-standardized DALYs resembled the incidence pattern, with higher rates in the East South Central division (Mississippi, Alabama) and lower rates in the coastal states (Figure 1B). Mississippi had the highest rate, at 190.99 per 100 000 population (95% UI, 166.57 to 218.22). Hawaiʻi recorded the lowest rate at 88.92 per 100 000 population (95% UI, 76.15 to 103.05), followed by New York, New Jersey, and California. Between 1990 and 2021, DALY rates significantly decreased in 24 states, and West Virginia was the only state that exhibited a significant increase of 16.12% (95% UI, 0.32% to 34.27%).
The age-standardized mortality rates per 100 000 population in 2021 mirrored the geographic trends in incidence and DALYs (Figure 1C) and ranged from 5.59 (Mississippi: 95% UI, 4.83 to 6.43) to 2.65 (Hawaiʻi: 95% UI, 2.25 to 3.06). Although most states showed a decreasing trend in deaths from 1990 to 2021, only 5 states/district (California; Washington, DC; Maryland; New York; Rhode Island) showed statistically significant decreases. West Virginia was the only state with a significant increase in the age-standardized mortality rate (19.21%; 95% UI, 2.23% to 38.80%).
Sex-Specific CNS Cancer Burden
In 2021, males had higher CNS cancer incidence rates compared with females. Males accounted for 17 459.65 cases (95% UI, 16 653.75-18 044.82), with an age-standardized incidence rate of 7.96 per 100 000 population (95% UI, 7.64-8.22), whereas females had 14 320.35 cases (95% UI, 13 269.49-14 929.73), with a rate of 5.97 per 100 000 population (95% UI, 5.66-6.21) (Figure 2). Between 1990 and 2021, the incidence count increased significantly for both sexes, albeit without significant changes in the age-standardized incidence rates.
Sex-Stratified Trends of Central Nervous System Cancer Burden in the USIncidence (A), disability-adjusted life-years (DALYs) (B), death count (C), and age-standardized rates per 100 000 population by sex, 1990-2021. Error bars indicate 95% uncertainty intervals.
The DALYs and mortality count and rate were significantly higher in males compared with females in 2021 (Figure 2). For both sexes, the counts increased, but the age-standardized rates decreased between 1990 and 2021. The percentage changes in these measures were comparable between males and females.
Age- and Sex-Group–Specific CNS Cancer Burden
The incidence rate for CNS cancer generally increased with age, with a minor peak in the 5- to 9-year and 10- to 14-year age groups (Figure 3). No sex-based differences were noted in childhood; however, the incidence rates began to diverge after age 30 years, with males having significantly higher rates than females in all age groups from 30 to 89 years. The rates converged after age 90 years, with no significant differences observed in the age group 95 years and older.
Age- and Sex-Stratified Trends of Central Nervous System Cancer Burden in the USIncidence (A),disability-adjusted life-years (DALYs) (B), death count (C), and rates per 100 000 population by sex and age, 2021. Error bars indicate 95% uncertainty intervals.
A bimodal peak pattern was observed in age-specific DALY rates, with peaks in the 5- to 9-year and 70- to 74-year age group (Figure 3). The difference between male and female rates was insignificant up to the 10- to 14-year age group, after which sex differences widened with age. The highest DALY rate per 100 000 population was observed in males aged 70 to 74 years (516.96; 95% UI, 491.24-539.07), which significantly exceeded the corresponding rate in females (342.10; 95% UI, 310.44-361.34). Following this secondary peak, the rates for both sexes and the difference between them decreased with age.
The age-specific mortality trend mirrored that of incidence, with rates increasing with age. A slight increase was noted in the 5- to 9-year and 10- to 14-year age groups. Male mortality rates were significantly higher than female mortality rates from age 30 years to 95 years and older, after which the difference narrowed. (Figure 3).
The distribution of measures across the age groups changed over time. From 1990 to 2021, DALY and mortality rates decreased significantly across all age groups under 70 to 74 years. In older age groups, the rates were initially lower in 1990 and 1995 but increased over time, reflecting an evolving demographic impact on the disease burden.
CNS Cancer Patterns With SDI
Epidemiological measures for 2021 were plotted against the SDI of the US and individual states to analyze the correlation. The incidence rates (ρ = −0.2683) approached significance (P = .05) (Figure 4A). Both DALY (ρ = −0.6860; P < .001) and mortality (ρ = −0.6391; P < .001) rates showed a significant negative correlation with SDI. The pattern for DALYs can be attributed to YLLs (ρ = −0.6929; P < .001) as opposed to YLDs (ρ = −0.0412; P = .77). States in the South Atlantic division, including Florida and Georgia, tended to have lower incidence, DALY, and mortality rates. Comparatively, states in the West North Central division, such as Nebraska and Kansas, had higher rates than states with similar SDI values.
Correlation of Sociodemographic Index (SDI) With Age-Standardized Rates of Incidence, Disability-Adjusted Life-Years (DALYs), and Mortality per 100 000 Population of Central Nervous System Cancer in the USIncidence (A), DALYs (B), and death (C) by state SDI, 2021. Incidence (D), DALYs (E), and death (F) by nation and region SDI, 1990–2021. The yearly average SDI and DALY rates for each division from 1990 to 2021 were calculated. The year-wise notation of each datapoint has not been marked. Trendlines for panels A-C and D-F indicate linear and locally weighted scatterplot smoothing regression trendlines, respectively.
Among SDI components, high school graduate or higher education status for individuals 18 years and older was negatively correlated with DALYs and death but positively correlated with prevalence. The TFU25 rate was positively correlated with all 3 measures, whereas income per capita was negatively correlated with all 3 measures. The East South Central division, including Mississippi, Alabama, and Tennessee, had higher rates than expected based on the general trend for academic achievement and income per capita.
Regional variations were observed when plotting by US division and SDI. Prevalence was higher in divisions with a higher SDI (Figure 4B); the South Atlantic division had lower prevalence rates than the general trend. Age-standardized DALY rates generally decreased as the SDI increased. The East South Central and West North Central divisions displayed higher DALY rates than expected for the corresponding SDI. The mortality rate showed a similar relationship with the SDI.
The CNS cancer estimates (incidence, DALYs, death, prevalence, YLDs, and YLLs) for the years 1990 to 2021 and corresponding figures are available in eAppendixes 4 and 5 in Supplement 1, as well as online through the GBD Results Tool.
Discussion
In the GBD 2021, CNS cancers were newly defined to include malignant neoplasms of other endocrine glands and the associated structures. This study presents the first detailed analysis of epidemiologic trends in and disease burden of CNS cancer by state in the US under this revised definition. These findings could clarify public health challenges, guiding medical resource reallocation and health care policy for CNS cancer at the state level in the US.
The observations from this study regarding the geographic variations in the CNS cancer burden aligned with registry-based studies reporting on data from 2010 to 2014, with incidence and mortality rates per 100 000 population ranging from 4.86 to 8.0 and 2.93 to 5.64, respectively.^21^ Several studies suggest that biological factors, environmental carcinogens (such as ionizing radiation), and socioeconomic factors are associated with CNS cancer development.^22,23^ Genetic predisposition has been associated with many CNS tumors, including established genetic tumor syndromes and noncoding variants. Racial and ethnic disparities potentially exist, as the incidence rate of glioblastoma was twice as high in White people as it was in Black people and was much higher in Hispanic individuals from 2016 to 2020.^24^ These disparities may partially reflect sociodemographic differences and inequities in access to health care, which contribute to the detection of CNS cancer.^25,26^ Moreover, the accessibility of medical infrastructure further impacts diagnostic rates. The observed geographic diversity underscores the need for targeted public health policies that account for social, biological, and environmental factors.
To understand sex-specific differences, we found that males had a higher CNS cancer burden and incidence in all age groups from 30 to 34 years up to 85 to 89 years. This contrasts with US registry data showing a higher incidence rate in females,^27^ a discrepancy likely due to methodological differences such as age-standardization methods and data modeling, which may yield sex-specific variations in case attribution. Part of this discrepancy may also stem from how CNS cancers are defined across datasets (eAppendix 6 in Supplement 1). Although less common than nonmalignant types,^1^ malignant neoplasms are more lethal and have a higher incidence in males than females (8.06 vs 5.84 per 100 000, respectively) based on US data from 2017 to 2021.^27^ For instance, glioblastoma, which accounts for 51.5% of malignant CNS brain tumors, had a 1.6-fold higher incidence in males.^27^ However, females have a higher survival rate for glioblastoma.^27,28^ CNS cancers demonstrate measurable sex disparities in disease progression and therapeutic response, often attributed to differences in the timing of mutations, metabolic requirements, and immune landscape.^29,30^ Therefore, sex differences in CNS cancers should be noted in future studies.^31^ Sex-specific health policies, such as health checkups that include brain imaging or tumor marker screening, may be warranted in at-risk groups to aid early identification.
This study revealed differing temporal trends across age groups. CNS cancer is the most common tumor in children in the US.^24,32^ However, we observed a significant decrease in incidence rate among children younger than 5 years between 1990 and 2021 (−23.76%; 95% UI, −34.42% to −11.56%). Improved prenatal care and maternal health may be 1 of the major contributors to this decline.^33^ In international studies, pediatric CNS cancers were associated with prenatal alcohol use, advanced maternal age, and low body mass index.^34,35^ In the US, 88.1% of women received “at least adequate” prenatal care, as defined by the Adequacy of Prenatal Care Utilization Index, with a 0.8% increase in first trimester prenatal care from 1980 to 2016.^36^ However, the US has yet to establish tailored policies for populations with lower educational attainment or higher-order births, both of which are critical for sustaining the reduction of pediatric CNS cancer burden.^36,37^
In contrast to the younger groups, our study found that the older groups (>70 years) experienced increasing incidence, DALYs, and mortality rates.^38^ Over the past 6 decades, US life expectancy has increased by 9 years (from 69.9 to 78.9 years).^39^ As the population has aged, the overall incidence of CNS cancer has risen, and the majority of CNS cancer has shifted to glioblastoma, meningioma, and pituitary tumors.^24,32^ Another plausible explanation is the higher rate of medical utilization in older groups.^40^ The frequent use of neuroimaging, such as computed tomography scans for conditions like stroke or head trauma, likely increases the incidental detection of asymptomatic CNS tumors. This, combined with increased medical access for those older than 70 years, contributes to higher reported incidence rates and more accurate documentation of CNS cancer-related deaths.
This study also found a significant negative association between SDI and DALYs and mortality rates. Furthermore, subgroup analysis revealed that high education levels and income per capita were negatively correlated with DALYs and mortality rates, whereas higher education levels were positively correlated with prevalence. Population-based studies from the US and Europe have reported higher survival in patients with higher education levels and higher incidence rates of CNS cancer among those with higher socioeconomic status.^41,42,43^ The significant financial and logistical demands of CNS cancer treatment likely drive these disparities, as care requires a multidisciplinary approach with advanced and expensive technology.^44^ These characteristics therefore highlight the need for national- or state-level support, such as community-based cancer care programs with financial support.
Between 2016 and 2020, the incidence, DALYs, and mortality rates of CNS cancer have steadily declined. However, this trend shifted between 2020 and 2021, with incidence and DALYs decreasing by only 0.289% and 0.717%, respectively. Studies have shown that COVID-19 disrupted all standardized processes from diagnosis to treatment: tumor volumes increased at initial diagnosis and survival decreased, especially in malignant CNS cancers.^45,46^ In contrast, the monthly incidence declined, especially for nonmalignant CNS cancers.^47^ Only 2 years of the COVID-19 pandemic period were evaluated in this study; the significance and permanence of these effects requires further studies, considering potential changes in health care utilization and resource availability.
Limitations
This study has several limitations. GBD data exhibit quality variations across states and divisions, which may introduce information bias, such as measurement error in reported cases or outcomes.^9^ This study relies on the epidemiological estimates from the GBD 2021, derived from a model using gathered data and published findings. The radiological diagnostic challenges in CNS cancer and the GBD classification by anatomical site prevent histology-specific disaggregation by tumor subtype, grade, or stage. Thus, our findings represent a population-level average across this heterogeneous disease. The heterogeneity of CNS cancers limits identifying precise risk factors and allows only broad associations with covariates. Additionally, the absence of subtype-specific data restricts conclusions regarding targeted treatment and prevention strategies for malignancies like glioblastoma or nonmalignant tumors such as meningioma. Moreover, GBD data lack granular demographics like race and ethnicity, precluding investigation into how these factors correlate with geographic or SDI-related disparities. Future research should prioritize improving data collection frameworks to reduce biases and enhance regional comparability.
Conclusions
To our knowledge, this is the first comprehensive analysis to focus on newly defined CNS cancers across the US and provide age-, sex-, geographic-, and SDI-stratified estimates and 30-year trends, lending valuable insight into disease trends and risk factors. These findings may help assess the public health landscape and inform health policy and resources reallocation for CNS cancer in the US.
The reference list from the paper itself. Each links out to its DOI / PubMed record.
- 1Lapointe S, Perry A, Butowski NA. Primary brain tumours in adults. Lancet. 2018;392(10145):432-446. doi:10.1016/S 0140-6736(18)30990-530060998 · doi ↗ · pubmed ↗
- 2Schubart JR, Kinzie MB, Farace E. Caring for the brain tumor patient: family caregiver burden and unmet needs. Neuro Oncol. 2008;10(1):61-72. doi:10.1215/15228517-2007-04017993635 PMC 2600839 · doi ↗ · pubmed ↗
- 3Olesen J, Gustavsson A, Svensson M, Wittchen HU, Jönsson B; CDBE 2010 study group; European Brain Council. The economic cost of brain disorders in Europe. Eur J Neurol. 2012;19(1):155-162. doi:10.1111/j.1468-1331.2011.03590.x 22175760 · doi ↗ · pubmed ↗
- 4Khanmohammadi S, Mobarakabadi M, Mohebi F. The economic burden of malignant brain tumors. In: Rezaei N, Nanaei S, eds. Human Brain and Spinal Cord Tumors: From Bench to Bedside Volume 1: Neuroimmunology and Neurogenetics. Springer; 2023:209-221.
- 5Raizer JJ, Fitzner KA, Jacobs DI, . Economics of malignant gliomas: a critical review. J Oncol Pract. 2015;11(1):e 59-e 65. doi:10.1200/JOP.2012.00056025466707 PMC 4295423 · doi ↗ · pubmed ↗
- 6Zhou J, Gu L, Du F, . The global, regional, and national brain and CNS cancers burden and trends from 1990 to 2021. Sci Rep. 2025;15(1):19228. doi:10.1038/s 41598-025-04636-740451904 PMC 12127437 · doi ↗ · pubmed ↗
- 7Zhao X, He M, Yang R, Geng N, Zhu X, Tang N. The global, regional, and national brain and central nervous system cancer burden and trends from 1990 to 2021: an analysis based on the Global Burden of Disease Study 2021. Front Neurol. 2025;16:1574614. doi:10.3389/fneur.2025.157461440606128 PMC 12213423 · doi ↗ · pubmed ↗
- 8Patel AP, Fisher JL, Nichols E, ; GBD 2016 Brain and Other CNS Cancer Collaborators. Global, regional, and national burden of brain and other CNS cancer, 1990-2016: a systematic analysis for the Global Burden of Disease Study 2016. Lancet Neurol. 2019;18(4):376-393. doi:10.1016/S 1474-4422(18)30468-X 30797715 PMC 6416167 · doi ↗ · pubmed ↗