Large-scale generation of in silico based spectral libraries to annotate dark chemical space features in non-target analysis
Emil Egede Frøkjær, Martin Hansen

TL;DR
This paper introduces a large in silico spectral library to help identify unknown chemicals in environmental and other non-targeted analyses.
Contribution
A novel open-access in silico fragmentation spectral library for non-targeted analysis of dark chemical space features.
Findings
The library enabled the discovery of previously unreported pollutants in groundwater.
Xenobiotics like hexafluoroacetone and transformation products of several chemicals were identified for the first time.
The library supports level 3 annotations in environmental, exposomic, food safety, and forensic investigations.
Abstract
In this study, we develop and present an open-access LC-electrospray-HRMS/MS forward in silico fragmentation spectral library, based on the NORMAN Suspect List Exchange containing 120,514 chemicals, that can be used for level 3 annotations to support elucidation of the dark molecular features detected in environmental, exposomic, food safety, and forensic investigations. Using these forward generated in silico spectral libraries, several pollutants previously unreported in non-targeted workflows were discovered in groundwater for the first time through retrospective non-targeted screening analysis. Among these are xenobiotics such as hexafluoroacetone, hexazinone metabolites A, B, and C, and transformation products of triflusulfuron, fluazifop-butyl, triallate, and propiconazole. The generated in silico spectral libraries are freely available at https://doi.org/10.5281/zenodo.14854025.…
Genes, proteins, chemicals, diseases, species, mutations and cell lines named across the full text — each resolved to its canonical identifier and authoritative record.
Click any figure to enlarge with its caption.
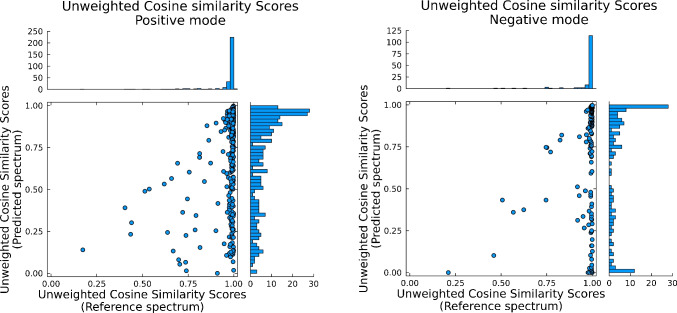 Figure 1
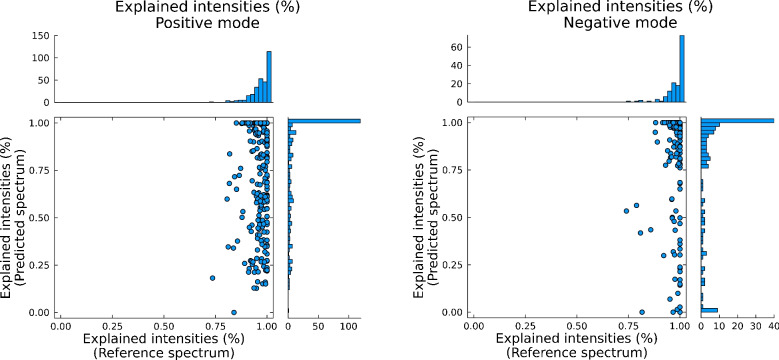 Figure 2
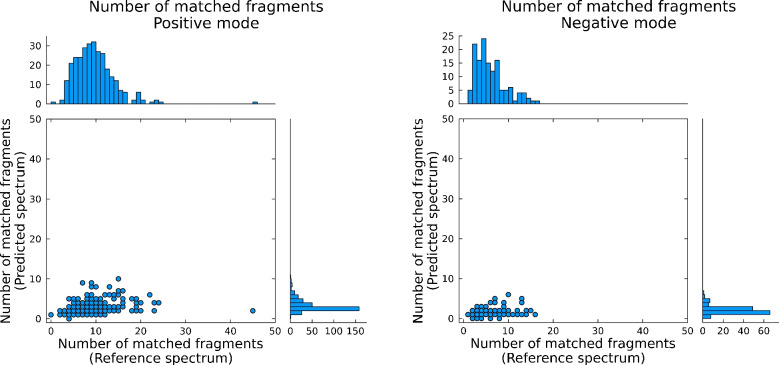 Figure 3
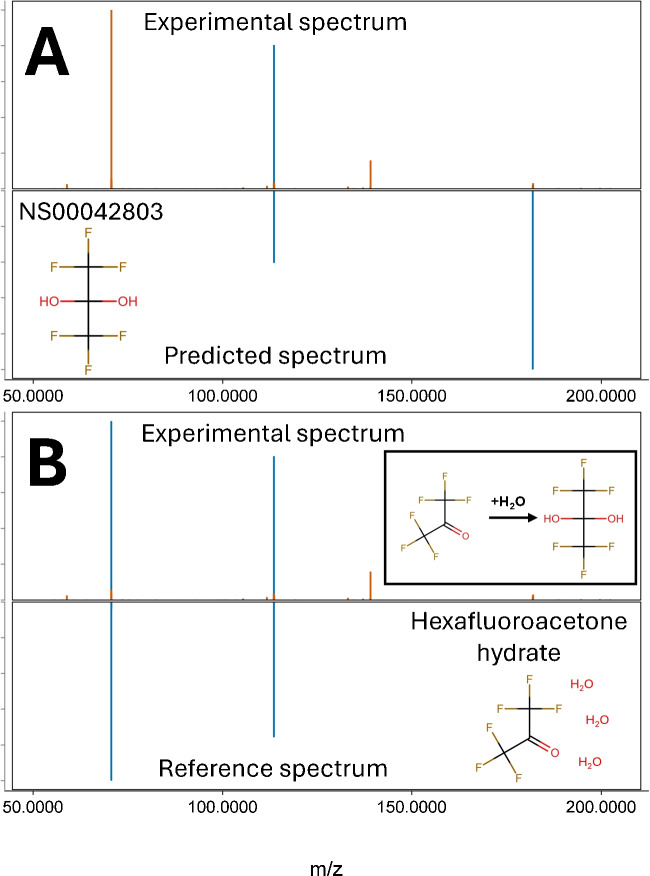 Figure 4
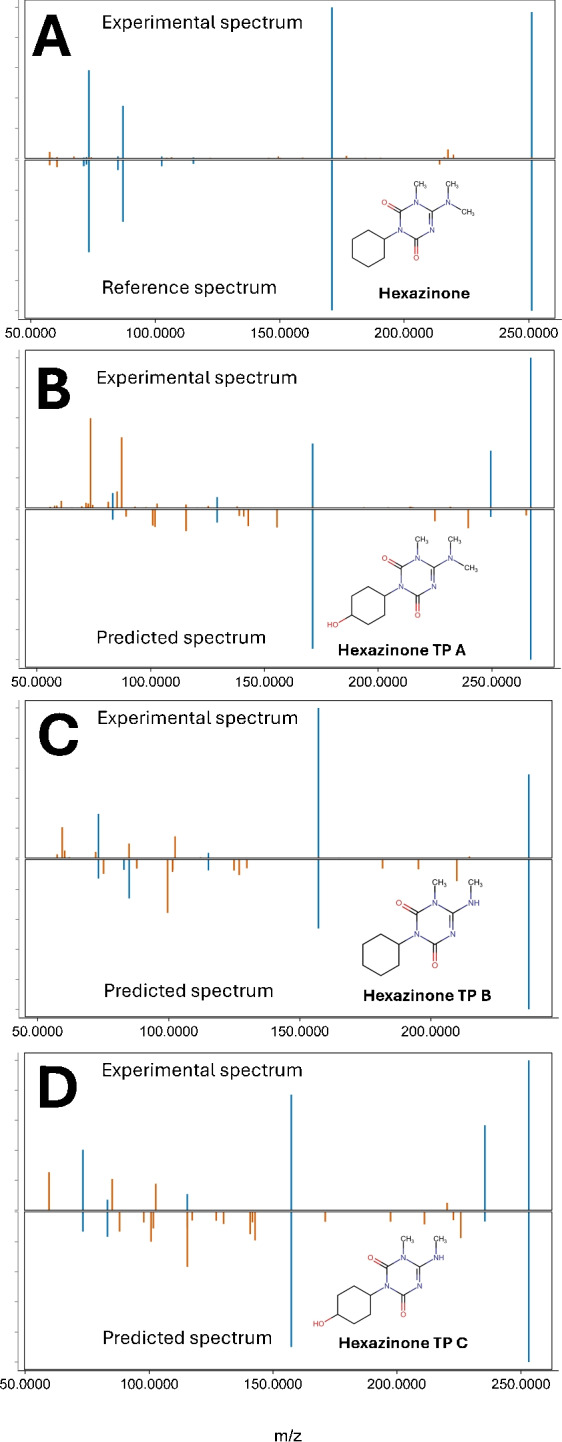 Figure 5
 Figure 6
- —http://dx.doi.org/10.13039/501100004836Danmarks Frie Forskningsfond
- —http://dx.doi.org/10.13039/501100007036Miljøstyrelsen
Peer Reviews
No public reviews on file for this paper yet. If you reviewed it on a platform where reviews are public (OpenReview, ICLR, NeurIPS, ICML), you can paste yours below so the community can read it here.
Videos
No videos yet. Explain this paper in a talk, walkthrough, or lecture? Add one.
Taxonomy
TopicsMetabolomics and Mass Spectrometry Studies · Advanced Chemical Sensor Technologies · Analytical Chemistry and Chromatography
Introduction
Non-target analysis and suspect screening analysis (NTA) are powerful tools used in the elucidation of unknown chemicals in environmental [1–11], exposome [12, 13], food safety [14, 15], and forensic investigations [16, 17]. In NTA, samples or sample extracts are typically recorded using high-resolution mass spectrometry platforms hyphenated with liquid or gas chromatography separation techniques (LC-HRMS and GC-HRMS). In GC-HRMS, a hard ionization (electron impact) is most often used to generate a mass spectrum containing the pseudo-molecular ion and its fragments. In LC-HRMS, however, a soft ionization, electrospray, is typically used in combination with collision-induced tandem mass spectrometry to generate a fragmentation spectrum (MS2) of isolated precursor ions (MS1). Even though data processing pipelines and analytical platforms are under constant development, these methodologies often only manage to annotate a few percent of the total detected molecular feature space [18], as annotation of compound identities often relies on the presence of a given compound in reference spectral fragmentation libraries [19] or through the use of masslists or in silico tools [20–22]. And even then, the annotation confidence for the majority of annotations rarely exceeds that of tentatively suggested structures (levels 3–4 according to the Schymanski scale [23]). This especially poses a challenge when reporting findings to regulatory institutions and authorities as they often refute low-confidence annotations. Subsequently, most lower level annotations tend to get ignored in favor of higher confidence annotations, where these are then confirmed (level 1) or rejected through the purchasing of analytical reference standards. However, the scientific and regulative community risk losing valuable information hidden outside the chemical space contained by experimental reference spectra. And if one relies solely on high-confidence annotations, NTA pipelines become practically indistinguishable from traditional targeted analysis with circular identification workflows with little to no new discoveries. If scientists are to continuously push NTA methodologies forward and increase the identifiable space [24–26], it is vital to continue the development and utilization of computational tools [27, 28]. Many initiatives are made to annotate the “dark” or unannotated chemical space. A frequently used methodology is the generation and implementation of wide-scope, but narrowly aimed, suspect lists. One such list is the NORMAN SusDat 2024 [29] list, containing 120,514 compounds of particular interest for the environment. The implementation of suspect lists improves the annotation space greatly—at the cost of annotation confidence, as most annotations are then made solely from a matching m/z value. However, by combination with in silico fragmentation techniques, suspect lists could be used for both MS1 and MS2 compound matching at a potential confidence level of 3 with the possibility to identify MS2 spectra relevance where no reference match exists either due to lack of data entries or chemical unavailability of reference compounds.
There are two main ways of performing in silico fragmentation for the annotation of (unknown) compounds: the reverse approach, also referred to as spectrum-to-compound (MS2C), and the forward approach (compound-to-spectrum (C2MS)) [22]. In MS2C, an experimental fragmentation spectrum is recorded and compared to a database of known structures in order to rank the most probably structure based on matching fragmentation pattern. Such methods are well described in literature and can be implemented through various tools like CFM-ID [22], FISh [30], MetFrag [20], DarkNPS [31], MS-Finder [32, 33], CSI:FingerID [21, 34], and the de novo approach MSNovelist [35], where structural elucidation can be extended to completely unknown structures. Reverse fragmentation tools are thus useful in finding structural candidates for spectra where no experimental reference spectra are matched and have been shown to widen the identifiable space of novel compounds [36–40]. The implementation of these tools is however not always straight forward and often requires some knowledge of coding to avoid doing manual search and curation for potentially thousands of spectral candidates. Instead, the forward fragmentation approach (C2MS) can be implemented to predict spectra from known structures found in, for example, suspect lists. This is especially beneficial as C2MS can be used to improve the confidence of suspect screening by generation of predicted spectra. As these predicted spectra can be used to perform spectral similarity scoring in the same way as with experimental spectral libraries (by ranking similarity by, for example, cosine score), the implementation of in silico libraries—once generated—requires little to no knowledge of coding to implement. Examples of the forward in silico approach have been widely explored in literature with models such as LipidBlast [41], MyCompoundID [42], CFM-ID [22], GrAFF-MS [43], NPS-MS [44], MassKG [45], and SingleFrag [46]. Of these, CFM-ID is especially well founded for the generation of predicted fragmentation libraries. Using SMILES [47], in silico libraries have been made for the entire DSSTox database [48, 49]. CFM-ID v. 2.0 has additionally been used as a forward prediction tool to generate an in silico library of the NORMAN SusDat knowledgebase [50]. Likewise, CFM-ID has been used to generate an in silico library of predicted biotic and abiotic transformation products of PFAS [51] with this library being freely available, allowing for a great boost in identification rates within the PFAS community.
Both of these in silico techniques complement each other. While reverse screening can be associated with a non-targeted methodology, forward screening shares characteristics with that of ordinary suspect screening. As such, pregenerated C2MS libraries can be used as high-confidence screening tools in both ordinary and retrospective suspect screening analysis to assist in the discovery of novel and potentially hazardous chemicals [36, 52, 53]. With community effort, these findings can then be shared and integrated into public MS2 repositories for improvements in future identification workflows. Another utility of forward in silico libraries is the ability to easily include retention time values, if known, as many processing software allow for a retention time windows threshold during both spectral matching and masslist searches. Thus, an added layer of confidence can be attained for compound annotations (by easier filtration of false positives) if measured retention times do not fall outside the desired range. For unknown retention times of known structures, these can be predicted (within a certain accuracy) using some of the many available prediction tools [54–58].
As such, it is the opinion of the authors of this work that in silico methodologies constitute an essential part in NTA workflows and should not be omitted, as they are necessary to fill the information gap between the detectable and identifiable chemical space. While it is understood that most in silico tools rely on the user’s ability to program and integrate solutions into specific applications, this should not prevent some researches from fully utilizing these techniques. We therefore present the complete NORMAN SusDat suspect list (as of version 2024) prepared as in silico generated spectral libraries, ready for direct use in open-access software such as MZmine [59] and MS-DIAL [60], as well as commercial software such as Compound Discoverer, to support the community in the discovery of novel compounds in NTA studies.
Methods
Software and packages
Several software and software packages were used throughout this study: Excel 365 (Microsoft) was used for quick data visualization and prioritization; CFM-ID 4.4.7 [22, 61–65] was used to perform in silico calculations of compound SMILES; Docker Desktop 4.28.0.0 (https://www.docker.com/) was used to connect to the CFM-ID container for non-web-based batch processing; PowerShell (Microsoft) was used to call command lines through the CFM-ID Docker image for batch processing; Julia 1.10.2 [66] was used for data clean-up of CFM-ID outputs, filling of metadata, package integration for structural clean-up, and for generation of figures used throughout; the RDKit package (version 2024.09.4) [67] was used for structural clean-up of SMILES and to obtain compound metadata; PugRest API (https://pubchem.ncbi.nlm.nih.gov/docs/pug-rest) [68] was used to obtain information of missing SMILES; mzVault 2.3 (Thermo Scientific) was used for conversion of.msp outputs to.db format; DB Browser for SQLite 3.12.2 (https://sqlitebrowser.org/) was used to perform SQLite queries on generated databases for fast structural assignment; Matlab R2024a [69] was used for merging of database duplicate entries using Database Explorer integration [70]; MZmine 4.3 [59] was used for feature detection in a non-targeted LC-HRMS dataset; Chemical Sketch Tool (https://www.rcsb.org/chemical-sketch) was used for drawing of chemical structures.
Masslist clean-up
The NORMAN SusDat (version 2024) suspect list was downloaded as.xlsx format from https://www.norman-network.com/nds/SLE/. This version contains information of 120,514 unique compounds present in NORMAN suspect list exchange lists S001-S111. Of these, 110,402 (91.6% of the original list) compounds had compatible SMILES. The remaining missing SMILES entries were mined from PubChem [71] using the PugRest API [68] through a Matlab script. Thus, an additional 2997 SMILES were obtained through either names, CAS, InChI, or InChIKey, to reach a total of 113,399 (94.1%) substances with computation ready SMILES (cf. SI-1). Before in silico predictions, RDKit [67] was used to clean-up the SMILES structures by removal of salts and neutralization of the structure. After this step, 330 structures were still in their salted form (i.e., containing “.” in the SMILES string) and were removed from the dataset. Then, 67 compounds with masses less than 40 Da were removed, as well as 1487 compounds with masses higher than 1000 Da—including all 336 compounds with more than 200 atoms (the current limitation for CFM-ID calculations). Lastly, 316 compounds with charge \documentclass[12pt]{minimal} \usepackage{amsmath} \usepackage{wasysym} \usepackage{amsfonts} \usepackage{amssymb} \usepackage{amsbsy} \usepackage{mathrsfs} \usepackage{upgreek} \setlength{\oddsidemargin}{-69pt} \begin{document}$$\ge $$\end{document} 2 were removed, as CFM-ID only supports calculation of single-charged species. As some de-salted structures might be identical, identical SMILES were merged by string comparison of canonical SMILES, removing replicates, resulting in a final number of 93,590 unique compounds. SMILES representing various stereoisomers, e.g., were kept due to their different chemical representation, though these would provide (near-)identical predicted MS/MS spectra. The compounds were then divided into three groups: negatively charged compounds (50) for [M+e]^-^ predictions, positively charged compounds (2,536) for [M-e]^+^ predictions, and 91,004 neutral compounds for [M+H]^+^ and [M-H]^-^ predictions, respectively. All other adduct types (e.g., ammonium and sodium) are not supported by CFM-ID calculations and were therefore omitted from this study.
CFM-ID 4.4.7 calculations
In silico calculations of SMILES were performed in batch mode using CFM-ID 4.4.7 [22] through the use of PowerShell and connection to the CFM-ID Docker container. CFM-ID provides a predicted spectrum for 10 eV, 20 eV, and 40 eV for each SMILES entry, and as such, it calculated around 550,000 spectra, which took around 10 days on a Thinkpad T16 AMD Gen 2 (AMD Ryzen 7 Pro 7840U / 3.3–5.1 GHz / 16 MB Cache, 32 GB LPDDR5X DRAM). The resulting output file formats were .msp (NIST) and contained information of compound ID, SMILES, collision energy, the number of fragments, and m/z and abundance of each fragment.
NIST format
Metadata of the output .msp-files were filled in using Julia [66] and RDKit [67] to obtain InChI, InChIKey, adduct type, ionization mode, corrected collision energies, formula, and precursor mass for each entry. This allowed for easy integration into open-access data processing software such as MZmine [59]. Compound names were kept as the SusDat ID to avoid special characters while still allowing for easy cross-referencing with the NORMAN Suspect List Exchange knowledgebase (https://www.norman-network.com/nds/susdat/).
Database format
For integration into the commercial software Compound Discoverer (Thermo Scientific), additional steps are required to convert the .msp file format into a cleaned database (.db format). For this, Julia, mzVault, Matlab, and DB Browser for SQLite were used. First, as part of the .msp output clean-up procedure described above, the Julia script also corrects for potential inconsistencies between defined peak number and actual peak number if present. Afterwards, mzVault was used to import and convert the .msp into a .db format. The resulting database file thereby contained a compound entry per spectrum (thus three entries per compound—one for each collision energy) with lacking structural information. mzVault could in principle be used to mine both metadata—including molecular structures—and to merge duplicates. However, this is done by mining the ChemSpider [72] knowledgebase, which is both time-consuming and can result in still missing—or even incorrect—annotations. Another challenge was—due to the size of the databases (over 250,000 entries in each)—that merging and metadata search within the mzVault software was not easily resolved without experiencing stability and run-time issues. Instead, DB Browser for SQLite in conjunction with Julia and Matlab was used to quickly (in less than 10 min) merge duplicate compound entries and mine and insert molecular structures (SDF-format) using SQLite queries. The cleaned databases could thus be used directly with Compound Discoverer, containing all necessary (structural) metadata for optimal identification workflows with respect to both ease-of-use and accuracy.
Feature detection and spectral matching
To explore and to evaluate the quality of the generated in silico libraries, a feature detection workflow using MZmine [59] was performed on a dataset of 81 ground water samples previously analyzed with a nanoLC-Orbitrap Q Exactive HF (240K) recorded in ddMS2-mode using 20, 70, and 120 NCE in stepped collision energies, described in detail elsewhere [73]. Peaks were identified using a minimum intensity threshold of 1E6 and a mass accuracy threshold of 5 ppm. Following smoothing [74], feature resolution, alignment across samples (±0.50 min), keep MS2-only, isotope, and duplicate filtering, gap filling, ion identity networking [75], and blank filtration (S/B > 10), detected features were screened towards either experimental spectral libraries (described below) or the generated in silico libraries. Spectral matching was done using a precursor m/z tolerance of 3 ppm, fragment m/z tolerance of 5 ppm, and unweighted cosine similarity scoring, defined in Eq. 1, where \documentclass[12pt]{minimal} \usepackage{amsmath} \usepackage{wasysym} \usepackage{amsfonts} \usepackage{amssymb} \usepackage{amsbsy} \usepackage{mathrsfs} \usepackage{upgreek} \setlength{\oddsidemargin}{-69pt} \begin{document}$${\textbf {v}}$$\end{document} and \documentclass[12pt]{minimal} \usepackage{amsmath} \usepackage{wasysym} \usepackage{amsfonts} \usepackage{amssymb} \usepackage{amsbsy} \usepackage{mathrsfs} \usepackage{upgreek} \setlength{\oddsidemargin}{-69pt} \begin{document}$${\textbf {u}}$$\end{document} are intensity vectors of the experimental and reference spectra, respectively, with a minimum score of 0.1 and minimum required number of fragments of 2—including the precursor ion. Though several modifications (weighting towards intensities and/or m/z) exist for calculating the cosine similarity, the unweighted algorithm was used for the most general representation of similarity scoring.
\documentclass[12pt]{minimal} \usepackage{amsmath} \usepackage{wasysym} \usepackage{amsfonts} \usepackage{amssymb} \usepackage{amsbsy} \usepackage{mathrsfs} \usepackage{upgreek} \setlength{\oddsidemargin}{-69pt} \begin{document}$$\begin{aligned} \text {cos}\theta =\frac{{\textbf {v}}\cdot {\textbf {u}}}{\left| {\textbf {v}}\right| \cdot \left| {\textbf {u}}\right| } \end{aligned}$$\end{document}Unmatched reference and experimental signals were kept but matched to zero. Results were then manually investigated to filter out potential false positives. The lenient spectral search parameters were implemented to allow for more matches in the initial data processing by ensuring the inclusion of compounds with either little fragmentation or with spectrum predictions of sub-optimal quality. This step was important to prevent the loss of many interesting suspects as empirical data suggested that spectra measured on the Orbitrap system were heavily affected by both chimeric and/or matrix-related interference. Since CFM-ID is trained on (and predicts) spectra obtained on QTOF analyzers, small discrepancies are expected in the spectral similarity scores between these two analyzer architectures (TOF and Orbitrap). Exact MZmine-processing parameters can be found in the batch file attached with the Supporting Information.
Experimental spectral libraries
A total of 1,543,129 high-resolution reference spectra were obtained through various open-access spectral databases: MS-DIAL [60], version 19, downloaded August 8, 2024, 367,674 spectra. MSnLib [76], downloaded April 11, 2024, 85,382 spectra. Massbank of North America (MoNA) (https://mona.fiehnlab.ucdavis.edu/), downloaded July 11, 2024, 148,546 spectra. Massbank EU [77], downloaded June 5, 2024, 117,283 spectra. GNPS [78], a public collection of user-curated spectral databases, downloaded November 1, 2024, 816,675 spectra. HighResNPS, a spectral library containing entries of new psychoactive substances [79], downloaded April 28, 2023, 3280 spectra. Folberth et al. [80], a library of endogenous metabolite, downloaded October 30, 2024, 4159 spectra. Wang et al. [81], a spectral library of polyfluoroalkyl substances (PFAS), downloaded July 9, 2024, 130 spectra.
Results and discussion
Validation
To assess the quality of the in silico-based annotations, 344 chemical standards (cf. SI-3) were spiked (100 ng of each compound) into a 1 L groundwater sample—prior to sample preparation—for an anticipated final concentration of 100 ng/L. These standards were then annotated in matrix through MZmine (301 and 139 in positive and negative modes, respectively) from in-house reference spectra that had previously been recorded in pure solvent at similar acquisition parameters. Spectral similarities were then compared to those of the in silico in regards to unweighted cosine scores, explained intensity, and the number of matched fragments shown in Figs. 1, 2, and 3.Fig. 1. Unweighted cosine similarity scores between predicted spectra (y-axes) and reference spectra (x-axes) for 344 analytical standards (301 in positive mode, 139 in negative mode) spiked in matrix and recorded in positive and negative electrospray ionization modes, respectivelyFig. 2Explained intensity between predicted spectra (y-axes) and reference spectra (x-axes) for 344 analytical standards (301 in positive mode, 139 in negative mode) spiked in matrix and recorded in positive and negative electrospray ionization modes, respectivelyFig. 3Number of matched fragments between predicted spectra (y-axes) and reference spectra (x-axes) for 344 analytical standards (301 in positive mode, 139 in negative mode) spiked in matrix and recorded in positive and negative electrospray ionization modes, respectively
Comparing the experimentally measured spectra of the 344 compounds with those recorded in pure solvent (Fig. 1), the 10th percentile (i.e., 90% of data values were above this value) of cosine similarity scores were 0.903 and 0.929 for positive and negative modes, respectively. In contrast to this, the 10th percentile scores were only 0.222 and 0.03, respectively, when compared to the in silico generated spectra. Of the 344 validation compounds, 107 were part of the original training data for the CFM-ID prediction model (see SI-2). The spectral similarity score is thus significantly lower for the predicted spectra—and especially for spectra predicted for negative mode—than when comparing towards experimentally recorded reference spectra. This means that it can be difficult to define a specific similarity score threshold for CFM-ID predicted spectra, which impacts the number of false/true positive annotations obtained in a classic non-targeted data pipeline. To obtain a better understanding of the relationship between similarity score and experimental and predicted spectra, looking deeper into the similarity scores for the experimental reference spectra reveals that less than 7% of the recorded spectra had spectral similarity scores below 0.8 and only around 4% less than 0.7. Thus, more than 95% of similarity scores based on experimental reference spectra were above 0.7 (the minimum required value that, according to the community consensus, is required for an appropriate compound annotation [19, 78].) Still, even under identical acquisition parameters, a small number of compounds (12 and 5 in positive and negative modes, respectively) would be rejected based solely on their similarity scores being below the threshold of 0.7. Applying the same threshold to filter through similarity scores of predicted spectra would reject nearly 40% of the true positive annotations (126 and 54, respectively), clearly indicating a need for adjustment in traditional scoring thresholds when implementing predicted spectra.
Looking at the other scoring metrics, specifically the explained intensity scores (Fig. 2), only 3 experimental entries had scores between 0.7 and 0.8, with the remaining 341 entries having an explained intensity score above 0.8—and more than 90% of those having a cosine score above 0.9. There is therefore a better correlation between true positive annotations and the explained intensity score—and a very high correlation when accounting for both cosine and explained intensity scores. Compared to the scores for the predicted spectra, the values are again significantly worse than for the experimental reference spectra. More than 30% of explained intensities were below 0.7 for both positive and negative modes. In positive mode, 58% of predicted spectra had cosine scores > 0.7, with 74% > 0.5. Of those above 0.5, 90% had an explained intensity value above 0.5 as well. As such, reducing the required thresholds for both cosine similarity and explained intensity to, for example, 0.2 and 0.7, respectively, should account for the reduced values when using predicted spectra. With a higher threshold of explained intensity, the likelihood of false positives is reduced. Also worth noting is the amount of matched fragments (Fig. 3). A minimum value is in some software (e.g., MZmine) required before performing spectral search and is important in order to reduce the number of false positives. If not chosen carefully however, this value can easily filter out true positive candidates if set too high. From Fig. 3, it is seen that the 10th percentile was 4 and 2 for positive and negative modes for reference matches, but 2 and 1 for the in silico libraries. In fact, 48% of the predicted spectra in negative mode had only 1 matching fragment. Thus, when performing spectral scoring, it is important to consider the number of fragments to include. Allowing for a lower number of matched fragments (2 or 3) increases the amount of true positives, while the risk of false positives can be reduced by accounting for both the explained intensity, cosine similarity, and spectral purity. As such, it is recommended to keep predicted and experimental reference spectra in separate spectral repositories for better (and more correct) annotation rate and to adjust the threshold settings accordingly.
As less than 5% of cosine scores between the experimental and reference spectra of confirmed compounds were below 0.7, a threshold of this value seems ideal in regards to data filtration. When comparing experimental spectra with external experimental MS2 reference spectral libraries, a reduction in similarity scores is to be expected. This is in part due to possible impurities in the experimental spectra originating from matrix effects and isobaric and/or chimeric interference, and deviations between the analyzed and compared spectra with respect to mass accuracy, instrumentation/analyzer type, acquisition parameters, and sub-optimal fragmentation settings [82]. For predicted spectra, any discrepancy between measured and predicted fragment intensities can be assigned to the uncertainty of the specific prediction model.
If experimental information indicates a reduction in the quality and/or purity of either the experimental or reference spectrum, the likelihood of a low cosine similarity score increases. Some knowledge of spectral quality is thus recommended when evaluating the annotations as reliance on a single mathematical value is often insufficient to fully determine whether or not a compound annotation is true or false. Following this, it is acceptable to annotate compounds with cosine scores less than 0.7 if sufficient evidence can back up the claimed identity. This can be, for example, the explained intensity, knowledge of retention time indices [54] and the isotopic pattern at the MS1 level. Especially the explained intensity is important. This is because explained intensity is less affected by spectral impurities and, as such, better differentiates between low cosine scores caused by either non-similarity or matrix and/or chimeric induced experimental impurities. Thus, a better measure of spectral similarity is an evaluation based on both cosine score and explained intensity, where thresholds for these values could be set to 0.7 and 0.9, respectively, for improved rejection of false positives. And as long as strict thresholds of the explained intensity were maintained, it would even be possible to reduce cosine score thresholds to as low as 0.4, increasing the annotatable space at the cost of an increase in the number of false positives.
Comparing in silico and experimental spectral libraries
The generated in silico libraries were evaluated by comparison with open-access experimental reference libraries on a groundwater dataset previously described and analyzed [73]. In negative mode, 3116 MS2-containing features were detected. Using the generated in silico libraries, 549 spectral matches were obtained at a cosine score \documentclass[12pt]{minimal} \usepackage{amsmath} \usepackage{wasysym} \usepackage{amsfonts} \usepackage{amssymb} \usepackage{amsbsy} \usepackage{mathrsfs} \usepackage{upgreek} \setlength{\oddsidemargin}{-69pt} \begin{document}$$\ge $$\end{document} 0.7, with an additional 586 matches between 0.1 and 0.7 and 1981 substances with scores < 0.1. In contrast, using experimental reference libraries, 261 annotations were obtained at a cosine \documentclass[12pt]{minimal} \usepackage{amsmath} \usepackage{wasysym} \usepackage{amsfonts} \usepackage{amssymb} \usepackage{amsbsy} \usepackage{mathrsfs} \usepackage{upgreek} \setlength{\oddsidemargin}{-69pt} \begin{document}$$\ge $$\end{document} 0.7, 461 matches between 0.1 and 0.7, and 2394 matches with scores < 0.1. In positive mode, 11,682 MS2-containing features were detected. A total of 1561 spectral matches were obtained from the in silico library at a cosine score \documentclass[12pt]{minimal} \usepackage{amsmath} \usepackage{wasysym} \usepackage{amsfonts} \usepackage{amssymb} \usepackage{amsbsy} \usepackage{mathrsfs} \usepackage{upgreek} \setlength{\oddsidemargin}{-69pt} \begin{document}$$\ge $$\end{document} 0.7, with 1846 matches between 0.1 and 0.7 and 8275 features remaining unannotated. Using experimental reference libraries, 755 annotations were found at cosine score \documentclass[12pt]{minimal} \usepackage{amsmath} \usepackage{wasysym} \usepackage{amsfonts} \usepackage{amssymb} \usepackage{amsbsy} \usepackage{mathrsfs} \usepackage{upgreek} \setlength{\oddsidemargin}{-69pt} \begin{document}$$\ge $$\end{document} 0.7, 1551 between 0.1 and 0.7, and 9376 at < 0.1. Thus, roughly twice as many annotations can be obtained in groundwater samples by using the generated in silico libraries compared to using only reference spectra. Following this, a significant amount of the hits (with a score above 0.7) could be attributed solely to the in silico libraries.
With a total annotated coverage of 606 out of 3116 (19%) in negative mode and 1764 out of 11,682 (15%) in positive mode, only around 10% of this can be uniquely attributed to the use of reference libraries (57 and 203 unique hits, respectively). The remaining 90% are either uniquely attributed to in silico libraries or are in common between the two library types (cf. SI-4). Thus, the annotatable space is greatly improved through the use of in silico-based fragmentation libraries. It should be stated that overlapping hits between reference and in silico hits in this context do not necessarily correspond to identical annotations but simply if a detected feature was assigned an annotation during both the library searches. Considering that many in silico entries are not found in reference libraries, the overlapping annotations likely differ. Still, using in silico libraries to assist with compound annotation more than doubled the number of annotations obtained compared to using only experimental reference libraries.Table 1. Overview of tentatively identified and confirmed compounds found in the groundwater samples using the in silico generated libraryCompoundTypeModecos \documentclass[12pt]{minimal} \usepackage{amsmath} \usepackage{wasysym} \usepackage{amsfonts} \usepackage{amssymb} \usepackage{amsbsy} \usepackage{mathrsfs} \usepackage{upgreek} \setlength{\oddsidemargin}{-69pt} \begin{document}$$\theta ^a$$\end{document} cos \documentclass[12pt]{minimal} \usepackage{amsmath} \usepackage{wasysym} \usepackage{amsfonts} \usepackage{amssymb} \usepackage{amsbsy} \usepackage{mathrsfs} \usepackage{upgreek} \setlength{\oddsidemargin}{-69pt} \begin{document}$$\theta ^b$$\end{document} LevelHexafluoropropane-2,2-diol* AKVXSYUWYXOLMY-UHFFFAOYSA-NPFAS-0.2470.9841Propiconazole TP SYN 547889 NUAGPTNJVDKMOR-UHFFFAOYSA-NFungicide TP-0.3270.9951Triallate TP TCPSA GLDBPELSAPUAFU-UHFFFAOYSA-NHerbicide TP-0.3810.9971Isodrin TP1 BMZDODNMJBZLAB-UHFFFAOYSA-NInsecticide TP-0.6243Para-hydroxy triphenyl phospate NOPNBQOZUKISRP-UHFFFAOYSA-NFlame retardant TP-0.84732,4-Dichlorophenylacetic acid GXMWLJKTGBZMBH-UHFFFAOYSA-NHerbicide TP-0.9923Fluazifop-butyl TP CGA142110 BYRJSCNPUHYZQE-UHFFFAOYSA-NHerbicide TP+ (-)0.9920.9991Hexazinone TP A ASCFMHBRJVKECO-UHFFFAOYSA-NHerbicide TP+0.7293Hexazinone TP B YCIQIUHJVFRTTB-UHFFFAOYSA-NHerbicide TP+0.7113Hexazinone TP C YLNFKJPRYUIXTG-UHFFFAOYSA-NHerbicide TP+0.8133Triflusulfuron-methyl TP IN-M7222 HJZAYYJWOHOQSM-UHFFFAOYSA-NHerbicide TP+0.9460.98415-Chloroisatoic anhydride MYQFJMYJVJRSGP-UHFFFAOYSA-NIndustrial+0.9923 \documentclass[12pt]{minimal} \usepackage{amsmath} \usepackage{wasysym} \usepackage{amsfonts} \usepackage{amssymb} \usepackage{amsbsy} \usepackage{mathrsfs} \usepackage{upgreek} \setlength{\oddsidemargin}{-69pt} \begin{document}$$^{a,b}$$\end{document} Similarity score for in silico and recorded reference spectrum, respectively. *Identified as hexafluoropropane-2,2-diol and confirmed by aqueous solution of hexafluoroacetone hydrate
As the applied mass threshold of the spectral library search was 3 ppm, this could exclude potential candidates present in the reference databases where lower MS1 resolution (compared to 240,000) was used. Despite being correct annotations, these entries might have mass deviations greater than 3 ppm compared to the recorded data. As such, the number of annotations achieved from the reference spectra might be lower than the highest possible amount and could have been increased with increasing mass tolerance.
Identification of compounds not present in reference libraries
Using the generated in silico libraries, several new pesticides transformation products (TP) were discovered in the groundwater samples (Table 1). Despite having cosine scores between 0.2 and 0.4, some were confirmed at level 1 using reference standards: triallate TP TCPSA (NS00008158), propiconazole TP SYN 547889 (NS00114332) (previously identified in Danish surface waters [83]), fluazifop-butyl TP CGA142110 (NS00067405), and triflusulfuron-methyl TP IN-M7222 (NS00067847). The reason for the low similarity scores could be due to none of the identified compounds being captured well by the CFM-ID predictions model, as they were not part of the original training set of the model. A PFAS previously unreported, but recently discovered in drinking water [84], was also detected and confirmed at level 1: The compound hexafluoropropane-2,2-diol (NS00042803) was detected at m/z 182.9887 and confirmed by a reference standard of hexafluoroacetone (HFA) hydrate (Fig. 4). When dissolved in aqueous environment, this substance readily reacts with the water to create the geminal diol compound ( \documentclass[12pt]{minimal} \usepackage{amsmath} \usepackage{wasysym} \usepackage{amsfonts} \usepackage{amssymb} \usepackage{amsbsy} \usepackage{mathrsfs} \usepackage{upgreek} \setlength{\oddsidemargin}{-69pt} \begin{document}$$K_\text {eq} = 1.2\cdot 10^6 M^{-1}$$\end{document} ) that can be detected in the samples [85, 86]. Another HFA adduct was detected at m/z 228.9941 corresponding to the [M+CH \documentclass[12pt]{minimal} \usepackage{amsmath} \usepackage{wasysym} \usepackage{amsfonts} \usepackage{amssymb} \usepackage{amsbsy} \usepackage{mathrsfs} \usepackage{upgreek} \setlength{\oddsidemargin}{-69pt} \begin{document}$$_2$$\end{document} O \documentclass[12pt]{minimal} \usepackage{amsmath} \usepackage{wasysym} \usepackage{amsfonts} \usepackage{amssymb} \usepackage{amsbsy} \usepackage{mathrsfs} \usepackage{upgreek} \setlength{\oddsidemargin}{-69pt} \begin{document}$$_2$$\end{document} -H] \documentclass[12pt]{minimal} \usepackage{amsmath} \usepackage{wasysym} \usepackage{amsfonts} \usepackage{amssymb} \usepackage{amsbsy} \usepackage{mathrsfs} \usepackage{upgreek} \setlength{\oddsidemargin}{-69pt} \begin{document}$$^-$$\end{document} ion. Characteristic fragments of m/z 68.9958 (CF \documentclass[12pt]{minimal} \usepackage{amsmath} \usepackage{wasysym} \usepackage{amsfonts} \usepackage{amssymb} \usepackage{amsbsy} \usepackage{mathrsfs} \usepackage{upgreek} \setlength{\oddsidemargin}{-69pt} \begin{document}$$_3^-$$\end{document} ) and 112.9856 (CF \documentclass[12pt]{minimal} \usepackage{amsmath} \usepackage{wasysym} \usepackage{amsfonts} \usepackage{amssymb} \usepackage{amsbsy} \usepackage{mathrsfs} \usepackage{upgreek} \setlength{\oddsidemargin}{-69pt} \begin{document}$$_3$$\end{document} COO \documentclass[12pt]{minimal} \usepackage{amsmath} \usepackage{wasysym} \usepackage{amsfonts} \usepackage{amssymb} \usepackage{amsbsy} \usepackage{mathrsfs} \usepackage{upgreek} \setlength{\oddsidemargin}{-69pt} \begin{document}$$^-$$\end{document} ) were seen present in both spectra. It was not possible to obtain a reference standard for hexafluoropropane-2,2-diol, and as such, it had to be confirmed indirectly through HFA. As a consequence, it is currently not possible to determine whether the detected PFAS is indeed hexafluoropropane-2,2-diol or a transformation product of HFA.
From these observations, it is clear that true positive predicted spectra can be found for even very low cosine scores. The evaluation of cosine similarity scores is entirely data-driven and can yield widely different results based on the chosen similarity algorithm and weights [87]. This is significant to consider, as results from this study show that CFM-ID predictions can provide true positive annotations on an Orbitrap system at thresholds as low as 0.25. Given that this threshold is generally not feasible for untargeted screening studies, as a majority of matches would be expected as false positives, it does however highlight the necessity of critically assessing the quality of spectral data in both reference and experimental libraries. The spectral similarity threshold should be defined based on empirical evidence of the instrumental settings, sample complexity, and library quality and can, in some scenarios, be lowered to allow for more annotations. Irregardless of the threshold chosen, the resulting data requires some type of curation step to prevent false positives. Following this, it is then up to the scientist(s) to decide whether an increase in the identifiable space is worth the time spent on data curation. To reduce the subjectivity related to manual curation, the identification point (IP) system was proposed as an objective way to report annotation confidence based on various spectral metrics [88].
In two samples, the herbicide hexazinone was identified at level 1 using a reference standard. In the same two samples, three other hexazinone transformation products (hexazinone TP A, hexazinone TP B, and hexazinone TP C) were annotated (at level 3) from the generated in silico libraries (Fig. 5). Hexazinone and its metabolites have previously been detected in groundwater [89] and are as such not an unexpected find. However, none of these three metabolites are present in the used reference spectral libraries and thus have likely been overlooked from traditional NTA workflows.Fig. 4. Spectral comparison of experimental, predicted, and reference fragmentation spectra for feature m/z 182.9887 (identified as hexafluoroacetone) recorded in negative mode. A (Top) Experimental fragmentation spectrum for m/z 182.9887. (Bottom) predicted in silico spectrum for hexafluoropropane-2,2-diol (NS00042803) with 2 matching fragments and a cosine similarity score of 0.247. B (Top) Comparison of the same experimental spectrum for m/z 182.9887 matched with (bottom) a reference standard of hexafluoroacetone hydrate with a cosine score of 0.984. Insert shows the presumed reaction between hexafluoroacetone and water producing hexafluoropropane-2,2-diolFig. 5Spectral matches for hexazinone and three transformation products. A (Top) Comparison of an experimental spectrum at m/z 253.1659 in positive mode with (bottom) a reference standard match of hexazinone with a cosine score similarity of 0.996 and matching retention time at 20.06 min. B (Top) Experimental spectrum at m/z 269.1605 and (bottom) predicted spectrum for hexazinone metabolite A with a cosine score of 0.729. C (Top) Experimental spectrum at m/z 239.1501 and (bottom) predicted spectrum for hexazinone metabolite B with a cosine score of 0.711. D (Top) Experimental spectrum at m/z 255.1450 and (bottom) predicted spectrum for hexazinone metabolite C with a cosine score of 0.813
Several other compounds of interest were also detected when using the in silico libraries (Table 1), e.g., isodrin TP1 (NS00102650), para-hydroxy triphenyl phosphate (NS00115818), 2,4-dichlorophenylacetic acid (NS00008251), and 5-chloroisatoic anhydride (NS00031689). Notably, none of these compounds were present in the training set for the CFM-ID model. A full list of annotations and training compounds for the CFM-ID model can be found in the Supporting Information (SI-2).
From these findings, the strength of forward (C2MS) in silico fragmentation is showcased. Other studies saw an improvement in screening and annotation accuracy [90, 91] when using lists of cleaned SMILES, neutralized and de-salted molecules, and calculation of proper precursor masses based on the molecular charge. A similar clean-up step was performed on every entry in this study in order to improve the prediction quality, expanding on the more than 70,000 already present entries in the NORMAN SusDat containing MS-ready (i.e., neutralized) SMILES with corresponding formulas and monoisotopic masses. Despite this, some limitations are still found in the presented forward in silico approach. For one, only a limited amount of adducts—namely (de-)protonation and natively charged—are supported by the current CFM-ID algorithm. Therefore, compounds that ionize without (de)protonation, such as for Na \documentclass[12pt]{minimal} \usepackage{amsmath} \usepackage{wasysym} \usepackage{amsfonts} \usepackage{amssymb} \usepackage{amsbsy} \usepackage{mathrsfs} \usepackage{upgreek} \setlength{\oddsidemargin}{-69pt} \begin{document}$$^+$$\end{document} or NH \documentclass[12pt]{minimal} \usepackage{amsmath} \usepackage{wasysym} \usepackage{amsfonts} \usepackage{amssymb} \usepackage{amsbsy} \usepackage{mathrsfs} \usepackage{upgreek} \setlength{\oddsidemargin}{-69pt} \begin{document}$$_{4}^+$$\end{document} adducts, or dimer or double charged species, such as for mycotoxins [92], some pesticides and pesticide transformation products [93], and peptides [94], would remain unidentified. Since CFM-ID predicts QTOF spectra at 10, 20, and 40 eV [40], a need for translation onto other systems (or collision energies) is recommended in order to reduce false-positive matches. In the case of this study, the predicted spectra at 20 eV seemed most compatible with the recorded data.
As a concluding remark, around 18% and 13% of detected features with associated MS2 spectra could be annotated by the generated in silico libraries with a cosine score >0.7 in negative and positive modes, respectively. Compared to the usage of experimental libraries (>1.5 M spectra), where 8% and 6% were annotated, the generated in silico libraries show great promise in the expansion of the identifiable space—as well as the confident discovery of new contaminants—in NTA workflows. Compound identification rate increased by more than a factor of two with the implementation of in silico-based reference libraries. Together with suspect lists, forward in silico allows for easier prioritization and identification of relevant pollutants and can improve the candidate selection process when performing annotation verification through the purchase of reference standards. It further has the potential to support metabolite prediction tools such as BioTransformer [95, 96] or enviPath [97, 98] by the addition of spectral information to predicted structures. As with any NTA workflow, it is important to assess retention times of the annotated species to filter between structural candidates and to reduce false-positive annotations caused by in-source fragmentation [99, 100]. When retention times are known, they can be used as a strict threshold during feature annotation, filtering all unlikely structural candidates based on their elution profile. When retention times are unknown, prediction tools can be used to estimate retention times of features based on either proposed structures [54, 56, 58, 101] or directly from their MS2 profile [55, 57]. Annotation threshold settings can then be defined based on the prediction confidence of the model, e.g., \documentclass[12pt]{minimal} \usepackage{amsmath} \usepackage{wasysym} \usepackage{amsfonts} \usepackage{amssymb} \usepackage{amsbsy} \usepackage{mathrsfs} \usepackage{upgreek} \setlength{\oddsidemargin}{-69pt} \begin{document}$$2\sigma \!$$\end{document} , assisting in the removal of false-positive candidates. More than 90,000 retention time indices have already been predicted and are available for the NORMAN SusDat List, readily translatable to system specific retention times through the use of overlapping compounds/calibrants with known experimental retention times [102].
As such, forward in silico library generation can prove to be a useful tool in the annotation of unknown structures where insufficient experimental data exists, allowing scientists to faster evaluate a larger identifiable space.
Supplementary Information
Below is the link to the electronic supplementary material.Supplementary file 1 (xlsx 16567 KB)
The reference list from the paper itself. Each links out to its DOI / PubMed record.
- 1Hao Z, et al. In: Chapter 13 - suspect and nontarget screening technologies for emerging contaminants (eds Liang, B., Gao, S.-H., Wang, H.-C. & Wang, A.-J.) water security: big data-driven risk identification, assessment and control of emerging contaminants 205–227 (Elsevier, 2024). https://www.sciencedirect.com/science/article/pii/B 9780443141706000251.
- 2Guy C, Duporte G, Luquot L, Gomez E. Non-target screening to track contaminant removal and release during nature-based water treatment. Frontiers in Environmental Science. 2024;12:1385806. https://hal.science/hal-04555006.
- 3Zhu L, et al. Suspect and non-target screening of chemicals of emerging arctic concern in biota, air and human serum. Environmental Pollution. 2024;360:124605. https://www.sciencedirect.com/science/article/pii/ S 0269749124013198.10.1016/j.envpol.2024.12460539053798 · doi ↗ · pubmed ↗
- 4Aggerbeck MR, et al. Non-target analysis of Danish wastewater treatment plant effluent: statistical analysis of chemical fingerprinting as a step toward a future monitoring tool. Environmental Research. 2024;257:119242. https://www.sciencedirect.com/science/article/pii/S 0013935124011472.10.1016/j.envres.2024.11924238821457 · doi ↗ · pubmed ↗
- 5Diera T, et al. A non-target screening study of high-density polyethylene pipes revealed rubber compounds as main contaminant in a drinking water distribution system. Water Res. 2023;229:119480.10.1016/j.watres.2022.11948036528929 · doi ↗ · pubmed ↗
- 6Vázquez Loureiro P, et al. Identification and quantification of per- and polyfluorinated alkyl substances (PFAS)migrating from food contact materials (FCM). Chemosphere. 2024;360: 142360. https://www.sciencedirect.com/science/article/pii/S 0045653524012530.10.1016/j.chemosphere.2024.14236038761829 · doi ↗ · pubmed ↗
- 7Yang C, et al. Non-target screening analysis of hazardous noxious substances using gas chromatography-quadrupole time-of-flight mass spectrometry. Environmental Advances. 2024;18:100597. https://www.sciencedirect.com/science/article/pii/S 2666765724001157.
- 8Wang F, et al. CFM-ID 4.0: more accurate ESI-MS/MS spectral prediction and compound identification. Analytical Chemistry. 2021.10.1021/acs.analchem.1c 01465 PMC 906419334403256 · doi ↗ · pubmed ↗