ICU predictive factors of fibrotic changes following COVID-19 related ARDS: a RECOVIDS substudy
Matthieu Demeyere, Isabelle Fournel, Amadou-Khalilou Sow, Stéphanie Gélinotte, Martine Nyunga, Anissa Berraies, Marie Labruyère, Alexandre Ampere, Bertrand Sauneuf, Cédric Daubin, Agathe Delbove, Julio Badie, Pierre Bulpa, David Delacour, Clotilde Lefevre, Saad Nseir

TL;DR
This study identifies factors that predict lung scarring in patients who survived severe COVID-19, helping improve their long-term care.
Contribution
A predictive nomogram for fibrotic changes in post-COVID-19 ARDS survivors is developed using a large multicenter cohort.
Findings
36.8% of ARDS survivors showed fibrotic changes six months after ICU discharge.
Older age, lower BMI, and invasive ventilation were key predictors of fibrotic changes.
Late organizing pneumonia was the most common radiological pattern observed.
Abstract
Pulmonary fibrotic changes (FC) following COVID-19-related ARDS represent a significant concern due to the potential respiratory complications. The identification of early predictive factors for FC and the development of predictive tools are needed to optimize patient management and outcomes. This observational prospective multicentre study is a substudy of the RECOVIDS study and included 32 centres in France and Belgium. COVID-19 ARDS survivors were included if they met the Berlin ARDS criteria or if they received high flow oxygen therapy (flow ≥ 50 L/min and FiO2 ≥ 50%). Exclusion criteria were non-attendance at follow-up 6 ± 1 months after ICU discharge, lack of baseline or follow-up chest CT, and history of interstitial lung disease. The primary endpoint was presence of FC at follow-up CT. The secondary outcome was to identify predominant radiological patterns. Among 555 patients…
Genes, proteins, chemicals, diseases, species, mutations and cell lines named across the full text — each resolved to its canonical identifier and authoritative record.
Click any figure to enlarge with its caption.
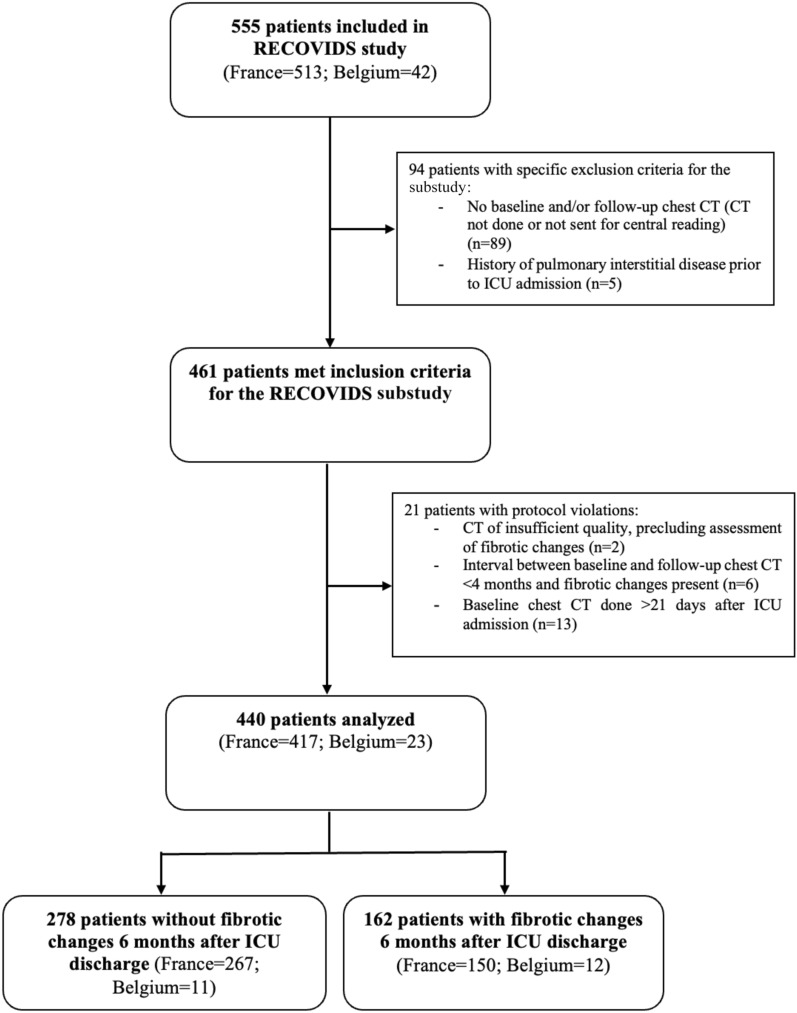 Figure 1
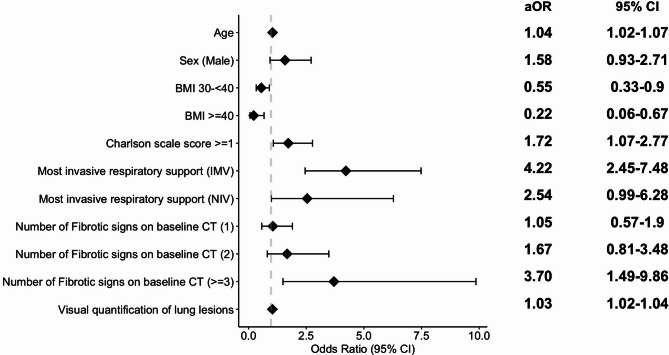 Figure 2
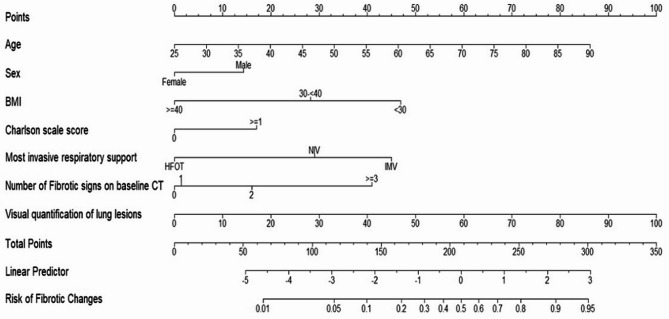 Figure 3
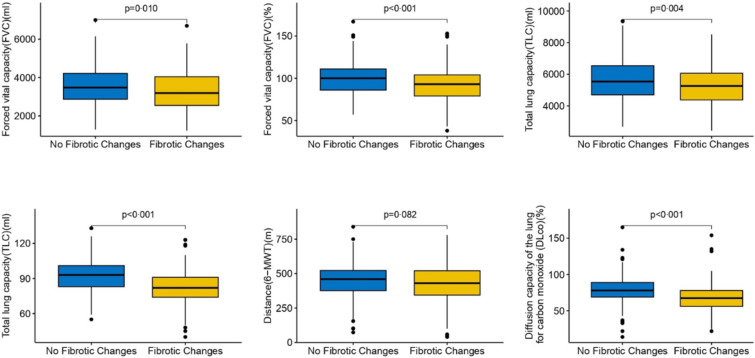 Figure 4
Peer Reviews
No public reviews on file for this paper yet. If you reviewed it on a platform where reviews are public (OpenReview, ICLR, NeurIPS, ICML), you can paste yours below so the community can read it here.
Videos
No videos yet. Explain this paper in a talk, walkthrough, or lecture? Add one.
Taxonomy
TopicsLong-Term Effects of COVID-19 · COVID-19 Clinical Research Studies · Respiratory Support and Mechanisms
Introduction
The SARS-CoV-2 pandemic, necessitate the exploration and management of late consequences of acute infection, particularly respiratory sequelae. Among the most concerning is pulmonary fibrosis, which can develop following viral infection [1], and carries a risk of clinical impact, including respiratory disability and impaired quality of life (QoL), somewhat similar to idiopathic pulmonary fibrosis (IPF) [2], The possibility of fibrosing lung injury post-COVID-19 has been documented [3], yet the course of such injury remains unclear. Its occurrence appears to be associated with age and the severity of the initial respiratory insult, especially in case of acute respiratory distress syndrome (ARDS) [4]. The pulmonary and systemic inflammatory response following SARS-CoV-2 aggression is more pronounced in patients who develop ARDS potentially sustaining an inflammatory and/or autoimmune process that could lead to interstitial lung lesions [5]. Additionally, ARDS fibrotic sequelae were described long before COVID-19 era [6]. Acute COVID-19 infection and IPF share common cellular and molecular features, raising concerns about a similar progressive potential in some patients [7]. Early identification in the intensive care unit (ICU) of patients at highest risk of fibrotic changes (FC) could help optimize their management and follow-up. We therefore aimed to identify predictors of post-COVID-19 pulmonary fibrosis, based on data from the initial chest computed tomography (CT) and ICU stay in a cohort of COVID-19 ARDS survivors.
Methods
Study design
This prospective observational multicentre study is a substudy of the RECOVIDS study, performed in 30 centres in France and 2 in Belgium. The protocol and results of the main study have previously been published [8, 9]. The RECOVIDS study was approved by the ethics committee “Comité de Protection des Personnes Sud Méditerranée II” on 10/07/2020 under the number 2020-A02014-35 for France, and by the ethics committee of Namur on 11/12/2020 under the number B0392020000073 for Belgium. Oral informed consent was obtained from all patients.
All adult patients admitted to ICU due to SARS-CoV-2 infection confirmed by polymerase chain reaction, in any of the participating centres, were eligible. To be included, patients had to have undergone baseline CT at the initial phase of management; have ARDS diagnosed according to the Berlin 2012 definition [10] or have received high flow nasal oxygen (HFOT) with a flow of at least 50L/minute with FiO_2_ > 50% and a PaO_2_/FiO_2_ ratio ≤ 200. The non-inclusion criteria of the main study [9] are presented in the additional file (eMethods 1).
Specific exclusion criteria for this substudy were: failure to attend follow-up CT, or a history of interstitial lung disease (ILD). Additionally, patients in whom baseline CT was performed more than 21 days after ICU admission, or in whom the follow-up CT showed FC but was done less than 4 months after baseline CT, or patients with CT scan of insufficient quality to assess the primary outcome were excluded from the statistical analysis as protocol violations.
Procedures
Patients were screened at ICU discharge and during hospitalization in post-ICU units. The follow-up, including a follow-up CT, was scheduled at 6 ± 1 months after ICU discharge as previously described [9].
Following anonymization, radiological data were transferred to the coordinating centre on a secure server for central interpretation.
Outcomes and chest CT analysis
The primary outcome was presence of FC, defined as interstitial lesions with volume loss and/or architectural distortion and/or traction bronchiectasis, and/or honeycombing at follow-up CT. FC at baseline, termed later in the text “early fibrotic signs” and follow-up, termed “FC”, were independently assessed by two thoracic radiologists, both actively involved in ILD multidisciplinary meetings. Discrepancies were collaboratively resolved during a concurrent third review session. For the purposes of the present study, radiological features on baseline CT at the acute phase were described using the same terminology applied in fibrotic ILD and follow-up CT evaluation, allowing systematic tracking of changes. However, the authors acknowledge that the use of fibrotic descriptors—particularly traction bronchiectasis—in the acute setting should be avoided as such features may be reversible and not indicative of established fibrosis. Moreover seemingly pre-existing subpleural fibrotic interstitial lung abnormalities on baseline CT were not considered as FC on baseline [11], or at follow-up, unless fibrotic progression was observed after reviewing both CTs. Quality was rated as follows: 1-no artefact; 2-mild artefact; 3-moderate artefact (< 10%), 4-severe artefact (> 10%), 5-any artefact precluding a conclusion as to the presence of FC. CT scans rated 5 were excluded from the statistical analysis.
The main secondary outcomes of radiological signs rated at baseline and follow-up CT are listed in additional file (eMethods 2). The extent of lesions was quantified using a visual method through an average score (0–100%) and an automated method using the CT Pneumonia Analysis application on Syngo.Via (Siemens Healthineers, Erlangen, Germany), see additional file (eMethods 3).
The main pattern on follow-up CT was categorized as one of the following: complete resolution (confirmed using minimal intensity projection), minimal lesions < 5% of any area (isolated reticulation, pleural bands), residual ground glass opacities (GGO), late organizing pneumonia (OP) with or without distortion, anterior fibrosis, and any other types of fibrotic pattern [12].
The non-radiological secondary outcomes were the clinical and functional respiratory function, assessed using the modified Medical Research Council dyspnea scale (mMRC) [13], pulmonary function tests (PFT) and the 6-min walk test (6MWT) [14]. Quality of life (QoL) was evaluated using the Visual Simplified Respiratory Questionnaire (VRSQ) [15] and Short Form Health Survey modified 36 (SF-36) [16].
Statistical analysis
All analyses were performed using R (version 4.3.0; R Core Team, 2023). After assessing normality using the Shapiro–Wilk test, continuous variables were summarized as means with standard deviation (SD) or as medians with interquartile ranges (IQR) for normally and non-normally distribution respectively. Group differences for continuous variables were tested using Student’s t-test for normally distributed data and the Wilcoxon test for non-normally distributed data. Categorical variables are presented as counts and proportions, and were compared using the Fisher exact or Chi-square test, as appropriate. Lung involvement was presented as mean percentage of the total lung or pulmonary region, considered as continuous variables and expressed as median (IQR). Missing data were reported in the tables, by reporting subjects with available data as [N0] but excluded from statistical analyses.
Variables associated with FC at follow-up were identified using the strategy below. Initially, candidate variables (additional file, Table S1) with a p-value < 0.15 by univariable analysis were included in a multivariable logistic regression model, excluding those with few events or redundancy (full model). A comparison of area under the curve (AUC) was performed to evaluate the diagnostic performance of automated versus visual quantification of lung involvement on baseline CT. The best variable was chosen for inclusion as the lung extent parameter in the multivariable model (eFigure 1).
Collinearity between adjustment variables was verified by calculating the variance inflation factor (VIF); all values were < 5, indicating absence of multicollinearity. Backward stepwise selection was applied to obtain final model, with model improvements assessed by the Akaike Information Criterion (AIC).
The Box-Tidwell test was used to check the non-linearity of continuous variables. Model calibration was assessed with a visual calibration plot and the Hosmer–Lemeshow test. Results are presented as odds ratios (ORs) and 95% confidence intervals (CIs).
Internal validation of the model was performed using cross-validation: the population was randomly split into a 80% training set and a 20% test set [17]. Model performance was evaluated using the area under the curve (AUC) metric, ranging from 50% (no discrimination) to 100% (perfect discrimination).
A nomogram based on the final model was constructed using the entire dataset [18]. Internal validation of the nomogram's predictive accuracy was conducted using 1000 bootstrap replications [18].
Results
Study population
The RECOVIDS study included a total of 555 adult patients between September 2020 and June 2021 (513 in France, 42 in Belgium). Among these, 94 had specific exclusion criteria for the present substudy. An additional 21 patients had protocol violations, leaving a total of 440 patients for the present analysis (Fig. 1).Fig. 1. Flow chart of the study population
Of these 440 patients, 162 (36.8%) had FC at follow-up. These patients were significantly older, more often men, less often obese, more frequently with Charlson score ≥ 1, and had higher median Simplified Acute Physiology Score II (SAPS II), compared to patients without FC (Table 1). Patients with FC at follow-up more often had early fibrotic signs at baseline (46% vs 29%; p < 0.001), as well as more extensive lung involvement, as assessed by visual analysis (51.8% [38.9–69.8] vs 37.5% [23.7–52.9]); p < 0.001) or with CT Pneumonia analysis (57.3% [41.7–69.8] vs 44.3 [28.8, 61.1]); p < 0.001) (Table 2). Detailed lung involvement by pulmonary region, or according to the interval between the initial CT scan and ICU admission in the FC group is described in the additional file (Table S2 and Fig. S2 respectively).Table 1. Patient characteristics and management at admission and during ICU stay according to fibrotic changesAll patients, N = 440No fibrotic changesN = 278 (63.2)Fibrotic changesN = 162 (36.8)P-valueAge, mean (SD)63.2 (11)61.2 (11.8)66.7 (8.6) < 0.001Sexe, female134 (30.5%)97 (34.9%)37 (22.8%) < 0.008COVID-19 epidemic wave0.362First wave148 (33.6%)87 (31.3%)61 (37.7%)Second wave239 (54.3%)155 (55.8%)84 (51.9%)Third wave53 (12.1%)36 (12.9%)17 (10.5%)Pre‐existing conditionsAlcohol0.653Never or former178/399 (44.6%)111/242 (45.9%)67/157 (42.7%)Up to one drink per day172/399 (43.1%)104/242 (43%)68/157 (43.3%)At least two drinks per day49/399 (12.3%)27/242 (11.1%)22/157 (14%)Tobacco0.778Never206/419 (49.2%)132/261 (50.6%)74/158 (46.8%)Current8/419 (1.9%)5/261 (1.9%)3/158 (1.9%)Former205/419 (48.9%)124/261 (47.5%)81/158 (51.3%)Body Mass Index, kg/m^2^ < 0.001 < 30248/436 (56.9%)139/275 (50.5%)109/161 (67.7%)30- < 40157/436 (36%)110/275 (40%)47/161 (29.2%) ≥ 4031/436 (7.1%)26/275 (9.5%)5/161 (3.1%)Hypertension218 (49.5%)129 (46.4%)89 (54.9%)0.084Chronic Obstructive Pulmonary Disease15 (3.4%)10 (3.6%)5 (3.1%)0.776Asthma26 (5.9%)17 (6.1%)9 (5.6%)0.810Diabetes mellitus116 (26.4%)68 (24.5%)48 (29.6%)0.235Mild to severe chronic renal failure ≥ 265 µmol/L7/438 (1.6%)5/277 (1.8%)2/161 (1.2%)0.999Congestive heart failure13 (3%)8 (2.9%)5 (3.1%)0.999Solid tumor with or without metastases within 5 years24 (5.5%)14 (5%)10 (6.2%)0.613Hematological malignancy14 (3.2%)7 (2.5%)7 (4.3%)0.299Charlson comorbidity index ≥ 1193/438 (44.1%)108 (38.8%)85/160 (53.1%)0.004Simplified Acute Physiology Score II34.5(28, 43) [438]32 (26, 42) [276]36.5 (30, 45.7) [162] < 0.001Sequential Organ Failure Assessment score4 (2.75, 6)4 (3, 5.75)4 (2.2, 7)0.068C-reactive Protein maximum blood level, mg/L152.2 (99,218.2) [306]148 (94.2, 213.5) [201]162.9 (109, 225) [105]0.111Most invasive respiratory support < 0.001IMV261 (59.3%)135 (48.6%)126 (77.8%)NIV38 (8.6%)28 (10%)10 (6.2%)HFOT141 (32.1%)115 (41.4%)26 (16%)Most severe P/F ratio0.079[200; 300[17/433 (3.9%)10/272 (3.7%)7/161 (4.3%)[100; 200[178/433 (41.1%)123/272 (45.2%)55/161 (34.2%) < 100238/433 (55%)139/272 (51.1%)99/161 (61.3%)Patients receiving IMVDuration, days17 (9, 26) [251]13.3 (8,19) [133]21 (13.3, 33) [118] < 0.001Minimum of Static Compliance of the Respiratory System, ml per cm of water26.5 (16.3, 33.7) [150]26 (14, 35) [77]27 (20, 33) [73]0.891PEEP max, cm of water14 (12, 15) [244]14 (11.7, 15) [124]14 (12, 16) [120]0.460Maximum of Plateau Pressure, cm of water29 (25, 32) [216]28 (25, 32) [109]30 (26, 33) [107]0.064Prone Positioning175/261 (67%)86/135 (63.7%)89/126 (70.6%)0.234Neuromuscular blockade231/261 (88.5%)115/135 (85.2%)116/126 (92.1%)0.082Inhaled nitric oxide36/259 (13.9%)12/133 (9%)24/126 (19%)0.020VV ECMO15/260 (5.8%)7/134 (5.2%)8/126 (6.3%)0.697VV ECMO duration, mean (SD), days11.3 (7.6) [15]11.6 (9.6) [7]11.1 (6.2) [8]0.999IMV weaningTracheal re-intubation after weaning failure42/249 (16.9%)19/130 (14.6%)23/119 (19.3%)0.321Tracheotomy47/261 (18%)13/135 (9.6%)34/126 (27%) < 0.001Tracheotomy duration, days16.5 (10, 31.2) [44]14 (10, 16) [12]19 (11.5, 35) [32]0.097NIV as most invasive respiratory supportPEEP max, cm of water8 (6.5, 10) [31]8 (6,10) [23]9 (8, 10) [8]0.200FiO_2_ max, %70 (60, 84) [36]70 (60, 88) [26]75 (60, 81.5) [10]0.693NIV duration, days4.5 (2.5, 6.7) [34]4 (2, 6) [26]5.5(4, 7) [88]0.335HFOT as most invasive respiratory supportFlow max, L/min50 (50, 60) [131]50 (50, 60) [109]50 (50, 60) [22]0.553FiO_2_ max, %70 (60, 88.7) [134]70 (60, 88.3) [110]70 (60, 86.3) [24]0.384HFOT duration, days6 (4, 8) [135]6 (4, 8) [110]7 (5, 11) [25]0.028Other organ supportVasopressors199 (45.2%)97 (34.9%)102 (63%) < 0.001Vasopressor duration, days5 (3,11) [195]4 (2,7) [94]8 (3,15) [101] < 0.001Inotropic agent14 (3.2%)5 (1.8%)9 (5.6%)0.030Renal replacement therapy25/439 (5.7%)10 (3.6%)15/161 (9.3%)0.013Specific treatments for COVID-19Antiviral therapies94 (21.4%)51 (18.3%)43 (26.5%)0.043Immunomodulatory therapies25 (5.7%)10 (3.6%)15 (9.3%)0.013Corticosteroids260 (59.1%)163 (58.6%)97 (59.9%)0.798Time from ICU admission to hospital discharge, days23 (14, 45)19 (13, 31)41 (20, 60.7) < 0.001Length of ICU stay, days12 (7, 28)9.5 (6, 18)24 (12, 40.7) < 0.001Data are expressed as n (%), [N0: Number of patients with available data in case of missing data], n/N0, or median (IQR), unless stated otherwiseFiO_2_ max, maximum of fraction of inspired oxygen; HFOT, high flow oxygen therapy; ICU, intensive care unit; IMV, invasive mechanical ventilation; NIV, non-invasive mechanical ventilation; P/F ratio, partial pressure of arterial oxygen divided by fraction of inspired oxygen; PEEP max, maximum of positive end-expiratory pressure; VV ECMO, veno-venous extracorporeal membrane oxygenationTable 2Description of baseline CT according to the presence or absence of fibrotic changesAll patients, N = 440No fibrotic changes, N = 278Fibrotic changes, N = 162P-valueTime between ICU admission and Baseline CT, days0 (-2,0)0 (-2,0)0 (-1,0)0.004Timing of Baseline CT, in intervals (0 = ICU admission), days0.093[-15;-5[18 (4.1%)11 (4%)7 (4.3%)[-5;5[374 (85%)243 (87.3%)131 (80.9%)[5;10[21 (4.8%)13 (4.7%)8 (4.9%)[10;21]27 (6.1%)11 (4%)16 (9.9%)Number of early fibrotic signs < 0.0010284 (64.5%)197 (70.9%)87 (53.7%)179 (18.8%)48 (17.3%)31 (19.1%)249 (11.1%)24 (8.6%)25 (15.4%) ≥ 328 (6.4%)9 (3.2%)19 (11.7%)Type of lesionTraction bronchiectasis (fibrotic sign)80 (18.2%)30 (10.8%)50 (30.9%) < 0.001Loss of lung volume (fibrotic sign)62 (14.1%)29 (10.4%)33 (20.4%)0.004Lung architectural distortion (fibrotic sign)118 (26.8%)64 (23%)54 (33.3%)0.019Honeycombing (fibrotic sign)2 (0.5%)0 (0%)2 (1.2%)0.135Ground-glass opacity438 (99.5%)277 (99.6%)161 (99.44%)0.999Consolidation378 (85.9%)237 (85.3%)141 (87%)0.604Crazy Paving115 (26.1%)61 (21.9%)54 (33.3%)0.009Bronchial distortion within COVID-19 opacities183 (41.6%)93 (33.5%)90 (55.6%) < 0.001Traction bronchiectasis outside COVID-19 opacities21 (4.8%)4 (1.4%)17 (10.5%) < 0.001Reticulation269 (61.1%)157 (56.5%)112 (69.1%)0.009Parenchymal band219 (49.8%)143 (51.4%)76 (46.9%)0.360Translobular line242 (55%)157 (56.5%)85 (52.2%)0.415Posterior irregular or thickened pleural interface280 (63.6%)170 (61.2%)110 (67.9%)0.156Pleural effusion155 (35.2%)97 (34.9%)58 (35.8%)0.847Reversed halo18 (4.1%)10 (3.6%)8 (4.9%)0.493Halo10 (2.3%)5 (1.8%)5 (3.1%)0.509Indicators of bacterial superinfection49 (11.1%)32 (11.5%)17 (10.5%)0.744Tree-in-bud nodules9 (2%)4 (1.4%)5 (3.1%)0.299Lobar or segmental single consolidation27 (6.1%)19 (6.8%)8 (4.9%)0.424Endobronchial secretion22 (5%)15 (5.4%)7 (4.3%)0.618Iodinated contrast agent injection0.515No160 (36.4%)96 (34.5%)64 (39.5%)Yes260 (59.1%)168 (60.4%)92 (56.8%)Both pre-contrast and post-contrast images20 (4.5%)14 (5%)6 (3.7%)Pulmonary embolism42/247 (17%)25/164 (15.2%)17/83 (20.5%)0.301Endotracheal tube63 (14.3%)27 (9.7%)36 (22.2%) < 0.001Evidence of Barotrauma14/438 (3.2%)6/277 (2.2%)8/161 (5.2%)0.108Lung involvementVisual evaluation, %44.7 (28.1, 60.6)37.5 (23.7, 52.9)51.8 (38.9, 69.8) < 0.001Visual lung involvement, %, in categories < 0.001 < 10%18 (4.1%)15 (5.4%)3 (1.9%)10–25%72 (16.4%)59 (21.2%)13 (8%)25–50%172 (39.1%)119 (42.8%)53 (32.7%)50–75%128 (29.1%)68 (24.5%)60 (37%) > 75%50 (11.4%)17 (6.1%)33 (20.4%)CT pneumonia analysis % of opacities, %49.5 (33.8, 64.4) [432]44.3 (28.8, 61.1) [273]57.3 (41.7, 69.8) [159] < 0.001Opacity score (0–20)12 (9,15) [432]11 (9,14) [273]14 (11,17) [159] < 0.001Data are expressed as n (%), [N0: Number of patients with available data in case of missing data], n/N0, or median (IQR), unless stated otherwise. CT: Chest computed tomography; ICU: Intensive Care Unit
Primary outcome
By multivariate analysis, the odds of FC at follow-up were significantly higher in older patients, those with a body mass index (BMI) below 30 kg/m^2^, a Charlson comorbidity score of one or higher at ICU admission, those who required invasive mechanical ventilation (IMV) during the ICU stay, and those who exhibited at least 2 early fibrotic signs and greater lung involvement at baseline CT (Fig. 2) and additional file (Table S3).Fig. 2. Primary analysis: multivariate analysis for predictive factors of fibrotic changes 6 months after ICU discharge. Each additional year of age and each additional percent of lung involvement on baseline CT was associated with an increase of 4% and 3% of developing fibrotic changes at 6 months, respectively. aOR; adjusted odds ratio, BMI, Body mass Index; CT, Computed tomography; IMV, Invasive Mechanical Ventilation; NIV, Non-invasive ventilation
The nomogram incorporating these factors (Fig. 3) yielded a robust prediction of FC at six months post-ICU discharge, with an AUC of 80.6% (95% CI: 76.4–84.8) for the entire cohort. Specifically, the AUC was 81.2 and 79.8 for the training and the test set respectively (additional file, Fig. S3 and Table S4).Fig. 3. Nomogram for predicting fibrotic changes 6 month after ICU discharge. For example, a 60-year-old [46 points] male patient [14 points] with a BMI < 30 [47 points], a Charlson comorbidity score of 1 [17 points], requiring invasive mechanical ventilation in the ICU [45 points], and a baseline CT showing two signs of fibrosis [16 points] and lung involvement of 55% [55 points], has an estimated risk of developing fibrotic changes within 6 months of 74% [240 points]. BMI, Body Mass index; CT, Computed tomography
Secondary outcomes
Regarding follow-up CT evaluation (Table 3), the median interval from baseline CT was 6.5 months (6.1–7.2), the most frequent radiological pattern was late OP with or without distortion, observed in 206 patients (47.2%). In the FC group, visual lung involvement was higher (13.7% [8.1–24.1] vs. 2.5% [1.1–6.3]; p < 0.001). The visual quantification of lung lesions decreased with increasing time elapsed since ICU discharge (p = 0.004), whereas the prevalence of FC did not vary significantly (additional file, Figs. S4 and S5, respectively). Patients in the FC group at 6 months post-ICU discharge more frequently presented shortness of breath according to the mMRC and had significantly lower SpO_2_ at rest and after exertion (additional file, Tables S5 and S6). They also had significantly more impaired forced vital capacity (FVC), total lung capacity (TLC), diffusion capacity of the lung for carbon monoxide (DL_CO_), and carbon monoxide transfer coefficient (K_CO_) (Fig. 4). Regarding QoL, only the physical domain of the SF-36 was significantly more impaired for patients with FC (additional file, Fig. S6), with no differences observed in the physical or mental summary scores (additional file, Fig. S7) or in the VSRQ (additional file, Table S5).Table 3. Description of follow-up CT according to fibrotic changes after ICU dischargeAll patients, N = 440No Fibrotic Changes, N = 278Fibrotic Changes, N = 162P-valueTime between ICU discharge and follow-up CT, months6.5 (6.1, 7.2)6.4 (5.9, 6.9)6.7 (6.2, 7.5)0.003Intervals between ICU discharge and follow-up CT, months0.017[2;4[10 (2.3%)10 (3.6%)0 (0%)[4;6[93 (21.1%)63 (22.7%)30 (18.5%)[6;8[289 (65.7%)180 (64.7%)109 (67.3%) ≥ 848 (10.9%)25 (9%)23 (14.2%)Type of lesionTraction bronchiectasis149 (33.9%)0 (0%)149 (92%)** < 0.001Loss of lung volume79 (18)0 (0%)79 (48.8%) < 0.001Lung architectural distortion107 (24.3%)0 (0%)107 (66%) < 0.001Honeycombing10 (2.3%)0 (0%)10 (6.2%) < 0.001Number of fibrotic signs < 0.0010278 (63%)278 (100%)0 (0%)158 (13%)0 (0%)58 (36%)235 (8%)0 (0%)35 (22%) ≥ 369 (16%)0 (0%)69 (43%)Combined traction bronchiectasis and architectural distortion95 (22%)0 (0%)95 (58.6%) < 0,001Predominant lesional pattern < 0.001Anterior Fibrosis30/437 (6.9%)0/275 (0%)30 (18.5%)Other Fibrosis20/437 (4.9%)0/275 (0%)20 (12.3%)Minimal Lesions26/437 (5.9%)26/275 (9.5%)0 (0%)Late Organizing Pneumonia with distortion103/437 (23.6%)11/275 (4%)92 (56.8%)Late Organizing Pneumonia without distortion103/437 (23.6%)90/275 (32.7%)13 (8%)Complete resolution53/437 (12.1%)53/275 (19.3%)0 (0%)Ground-glass102/437 (23.3%)95/275 (34.5%)7 (4.3%)Type of ground-glass opacities0.489Mosaic attenuation14/102 (13.7%)12/95 (12.6%)2/7 (28.6%)Melting sugar appearance83/102 (81.4%)78/95 (82.1%)5/7 (71.4%)Non specific5/102 (4.9%)5/95 (5.3%)0/7 (0%)Lung involvementVisual Evaluation, %5.6 (1.8, 13.7) [428]2.5 (1.1, 6.3) [268]13.7 (8.1, 24.1) [160] < 0.001Percentage visual lung involvement, in categories < 0.001**[0–10[278/428 (65.5%)225/268 (84%)53/160 (33.1%)[10–25[100/428 (23.4%)33/268 (12.3%)67/160 (41.9%)[25; 50[36/428 (8.4%)9/268 (3.4%)27/160 (16.9%)[50–75[13/428 (3.3%)1/268 (0.4%)12/160 (7.5%)[75–100]1/428 (0.2%)0/268 (0%)1/160 (0.6%)Presence of Emphysema131/434 (30.2%)72/274(26.3)59/160 (36.9%)0.020Median extent of Emphysema (% of Low Attenuation Area over total lung volume)1.0 (0.3, 2.8) [118]1.4 (0.3,2.9) [65]0.7 (0.3, 2.5) [53]0.406Data are expressed as n (%), [N0: Number of patients with available data in case of missing data], n/N0, or median (IQR), unless stated otherwise. CT: Chest computed tomography; ICU: Intensive Care UnitFig. 4Main respiratory outcomes according to lung fibrotic changes 6 months after ICU discharge
Discussion
To our knowledge, this study presents the largest cohort of COVID-19 ARDS survivors undergoing chest CT evaluation at a median interval of 6.5 months post-ICU discharge. In our population, FC were observed in 36.8% of the 440 survivors, a prevalence that is hard to compare with existing literature due to variations in the definitions of fibrosis and the timing of follow-up CT [4, 19, 20]. Despite a restrictive definition, our cohort exhibited a high frequency of FC, somewhat comparable to the rate of 39% observed at 4 months in the ARDS subgroup of the COMEBAC cohort [21]. The elementary lesions used, conforming to Fleischner Society’s glossary from 2008 (which was in use at the time of the image interpretation) and consistent with the 2024 updated version [22], are theoretically non-regressive when identified in a chronic setting [12]. This may account for the stable prevalence of FC observed between the earliest and latest follow-up CTs in our study, despite a reduction in the overall burden of lesions. Additionally, studies have confirmed that FC identified at 6 months remained up to 24 months post-ARDS-COVID [21, 22].
Anterior fibrosis emerged as the predominant pattern in 30 (19%) of the 160 evaluable patients with FC. IMV carries a risk of inducing or perpetuating lung injury, corresponding to the term "Ventilator-Induced Lung Injury (VILI)," whose effects may be limited by applying protective ventilation [25]. During ARDS, the anterior zones of the lungs are most accessible to IMV due to consolidation of posterior dependent lung regions. This increases the risk of regional lung overdistension in the nondependent anterior areas, potentially leading to lung injuries. This anterior localization of fibrotic damage could thus correspond to the sequelae of VILI among COVID-19-ARDS survivors who likely suffered the most in terms of ventilation, akin to survivors of ARDS of other origins who underwent prolonged IMV [26]. In our study, the duration of IMV and the proportion of tracheotomy for IMV weaning were significantly higher in the FC group. The measurement of airway plateau pressure, used to evaluate end-inspiratory intra-alveolar pressure, was higher in the FC group, albeit not statistically significant (p = 0.064), with a median of 30 cmH2O (IQR 26–33), a threshold beyond which the risk of VILI is significant [25]. Prone positioning enhances the aeration of the dependent regions, promoting uniform ventilation and reducing the risk of overdistension [25], however we observed no protective effect against FC in our cohort.
Late OP with or without distortion was the most commonly encountered CT pattern, possibly corresponding to the specific residual impact of COVID-19 as demonstrated in histologic specimen from COVID-19 survivors demonstrating radiological sequelae [25, 26]. Indeed, GGO and consolidations tend to regress by one year [19].
The association between OP and FC could stem from the severity of alveolar damage inflicted by the viral infection, influenced by the patient's inflammatory or immune response, and may be further compounded by impaired or delayed repair mechanisms, which are exacerbated by specific risk factors [3]. We suppose that the association of FC with a Charlson comorbidity score may be attributed to the increased likelihood that more frail patients will require IMV and experience delayed or incomplete repair. Some of the risk factors for FC identified here have also been identified in other cohorts with non-severe or mixed severity COVID-19. Increasing age appears to significantly elevate the risk of FC, with a threshold identified at 50 years in one study [4]. The increased risk related to the type of ventilatory support initially used (non-invasive ventilation or IMV) has also been reported [20, 27]. Interestingly, 26 of 162 patients with FC (16%) had HFOT as maximal respiratory support. The higher prevalence of emphysema observed in the FC group—despite comparable rates of tobacco use and somewhat similar extent—may be explained by the greater use of IMV, as well as more severe acute disease in this group, as previously suggested in the literature [20]. In this study, the baseline CT played a crucial role in identifying patients at risk of FC. The association between the extent of initial lesions and FC has already been demonstrated, whether through a semi-quantitative analysis by the severity score [4, 29] or automated quantification [30]. However, the relevance of identifying early signs of potential fibrosis had not yet been reported, with an adjusted OR of 3.7 (95%CI 1.5–10) for predicting FC. We noted that early fibrosis was absent in over half of the patients who later developed FC. Conversely, these signs regressed in under a third of the patients without FC at follow-up, underscoring both the potential for repair and the risk of developing FC later during the ICU stay.
Interestingly, obesity (BMI > 30 kg/m^2^) appeared to protect against FC, despite its association with an increased risk of COVID-19 ARDS [31]. The protective effect of obesity on non-COVID-19 ARDS mortality, previously termed “the obesity paradox” [32], remains uncertain in ARDS-COVID-19, since one meta-analysis found no significant impact on the survival of obese patients [31]. In obese patients ventilated invasively, hypoxemia is often the consequence of atelectasis and mismatch between ventilation and perfusion [33]. This may lead to an overestimation of ARDS severity related to collapsed but unharmed lung areas that exhibit no scarring once the atelectasis is resolved. Furthermore, inflammatory and metabolic factors linked to obesity could account for lesser lung involvement and ultimately fewer sequelae [30, 31].
Our study suggests a significant clinical impact of FC, since patients with FC had increased dyspnea, lower post-exertion SpO_2_, and covered 29 m less on the 6MWT, although this difference borders statistical significance, it remains clinically relevant, particularly given that the observed effect was not explained by the higher prevalence of emphysema in the FC group [34]. These clinical characteristics could be linked to FC and possible exertional hypoxemia. However, it is likely that the consequences of intensive care on the functional state, notably neuromuscular, had a significant impact, since patients in the FC group more frequently required IMV, and had a hospital stay more than twice as long as patients without FC. Nevertheless, direct impairment from FC should not be ruled out, as PFT revealed a restrictive respiratory profile, along with lower DLco and no elevation of Kco, further advocating for a functional reality linked with the FC on follow-up CT [35]. In our study, the residual lesions in the FC group affected a median of 14% (8–24) of the lungs, surpassing the 10% threshold proposed by Mehta et al. to deem lesions symptomatically significant [1]. The impact on QoL across the cohort was more significant in physical than in mental terms, comparable to what is usually described in the post-ARDS recovery period [36]. However, the QoL related to the physical state (physical role) was more markedly diminished in the FC group.
The potential impact of FC on clinical outcomes highlights the possible benefit of antifibrotic treatments and the need for early identification of high-risk patients [37]. A nomogram derived from our cohort can evaluate the risk of FC, enabling tailored assessment of patients based on initial data, including CT. Visual lesion extent on baseline CT in patients with FC varied with the time from admission to ICU, indicating that scans performed more than five days before ICU admission may underestimate lesion burden. Maximal lesion quantification occurred between five and ten days, suggesting this as the most suitable interval for future assessment, at a time where all the selected risk factors are readily accessible.
Our study has several limitations. Firstly, we cannot rule out that FC on CT preceded ARDS and COVID-19. However, the exclusion of patients with advanced respiratory histories and seemingly pre-existing interstitial abnormalities limited this possibility. Secondly, our evaluation at 6 months after ICU discharge may overestimate FC, as some residual non-fibrotic lesions may still improve over time. Current data suggest that FC would remain stable. Thirdly, it is difficult to distinguish between symptoms arising from FC and those related to post intensive care syndrome in these patients. A further evaluation more distant from ICU discharge could yield a better understanding of this issue. Finally, the model for predicting FC may not be generalizable to ARDS of other aetiologies due to the specificities of COVID-19 ARDS even if these ones are still debate [38] 39. However, the identified risk factors should be taken into consideration in future studies.
Conclusion
Post COVID-19 ARDS FC were frequently observed at 6 months post-ICU discharge. Two major lesion patterns were identified, namely anterior fibrosis, suggesting sequelae from IMV, and more commonly, a pattern of late OP with varying degrees of distortion, which may correspond to viral sequelae. Furthermore, our study highlighted clinical and radiological factors which could enable the early identification of patients who may benefit from targeted follow-up and specific management.
Supplementary Information
Additional file1 (DOCX 1084 kb)
The reference list from the paper itself. Each links out to its DOI / PubMed record.
- 1ARDS Definition Task Force, Ranieri VM, Rubenfeld GD, Thompson BT, Ferguson ND, Caldwell E, et al. Acute respiratory distress syndrome: the Berlin Definition. JAMA. 2012;307:2526–33.10.1001/jama.2012.566922797452 · doi ↗ · pubmed ↗
- 2Writing Committee for the COMEBAC Study Group, Morin L, Savale L, Pham T, Colle R, Figueiredo S, et al. Four-Month Clinical Status of a Cohort of Patients After Hospitalization for COVID-19. JAMA. 2021;325:1525–34.10.1001/jama.2021.3331 PMC 797038633729425 · doi ↗ · pubmed ↗