Immunohistochemical Expression of p16, p53, BCL2, and Cyclin D1 in Gastrointestinal Stromal Tumors: Correlation With Clinicopathological Parameters
Marwa M Zaki, Eman T Enan, Heba Hany

TL;DR
This study examines the expression of p16, p53, BCL2, and Cyclin D1 in gastrointestinal stromal tumors and their links to tumor behavior and patient outcomes.
Contribution
The study identifies p16 and p53 as potential independent prognostic markers for recurrence and metastasis in GISTs.
Findings
p16 and p53 expression were significantly associated with aggressive tumor behavior and poor survival outcomes.
p16 was an independent predictor of local recurrence and distant metastasis in GISTs.
BCL2 and Cyclin D1 showed mixed or uncertain prognostic value despite some associations with tumor aggressiveness.
Abstract
Introduction Gastrointestinal stromal tumors (GISTs) represent the predominant mesenchymal neoplasms within the gastrointestinal tract. Although some clinicopathological features can help estimate the risk of tumor progression, there is still a need for more reliable immunohistochemical markers to predict the tumor’s behavior. The current study aims to evaluate the immunohistochemical expression of p16, p53, BCL2, and Cyclin D1 in GISTs and to analyze their correlations with the clinicopathological characteristics and survival outcomes of the studied cases. Methods This retrospective cohort study included 65 cases of GISTs, retrieved from the archive of the Pathology Laboratory at the Gastroenterology Center, Mansoura University, between 2014 and 2018. Patients’ clinical and pathological data were revised. Three tissue microarray blocks were constructed. Immunohistochemical staining…
Genes, proteins, chemicals, diseases, species, mutations and cell lines named across the full text — each resolved to its canonical identifier and authoritative record.
Click any figure to enlarge with its caption.
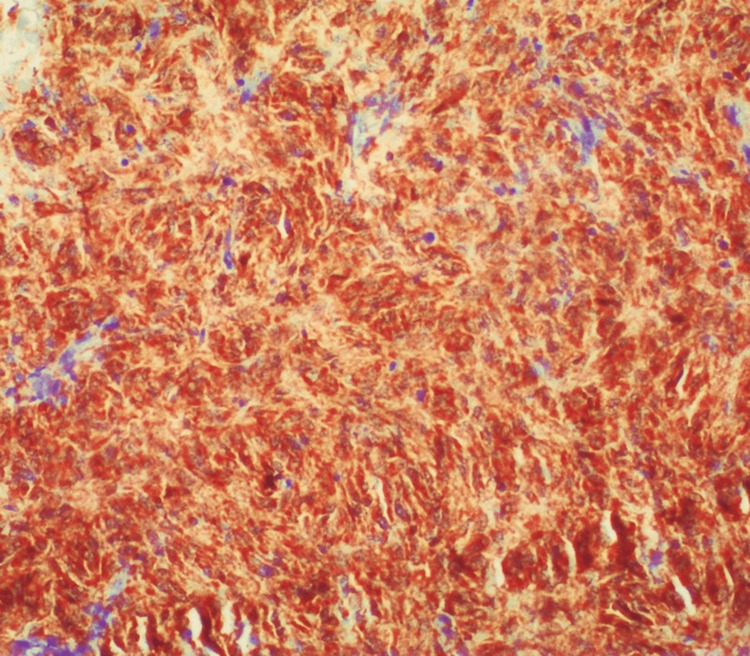 Figure 1
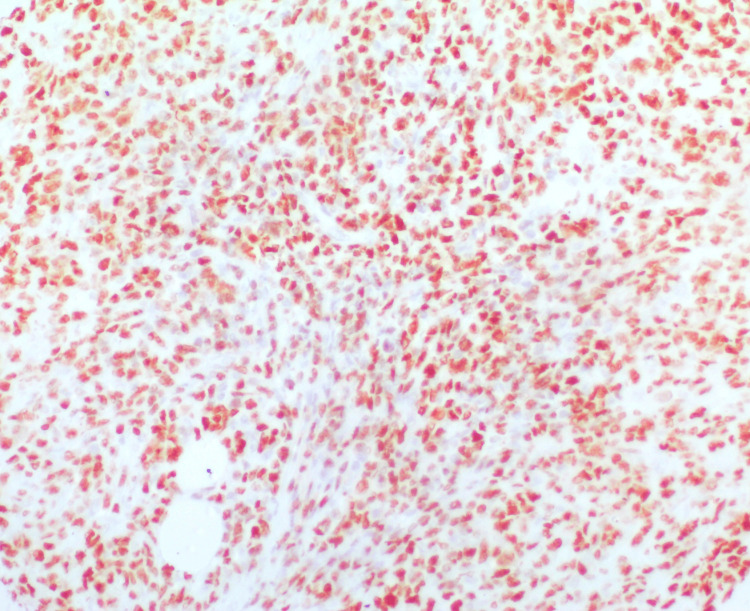 Figure 2
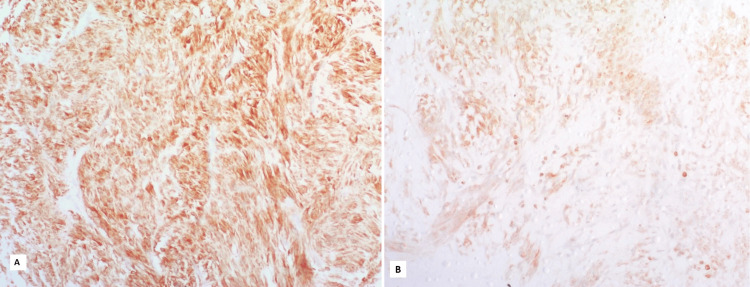 Figure 3
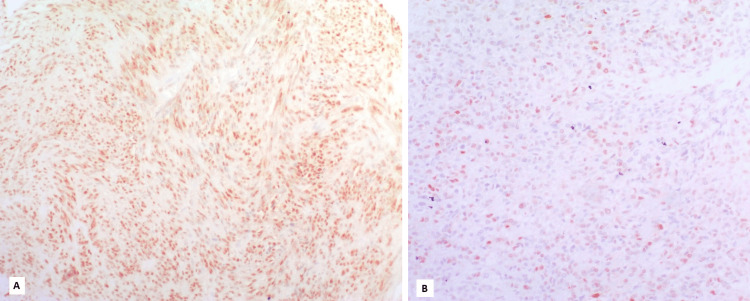 Figure 4
| Clinicopathological features | Study group | |
| (N = 65) | ||
| Age (years) | Mean age | 60.72 ± 12.68 |
| Age range | (23-83) | |
| Tumor size (cm) | Mean size | 8 |
| Size range | (1-35) | |
| Tumor site | Stomach | 40 (61.5%) |
| Small intestine | 12 (18.5%) | |
| Rectum | 9 (13.8%) | |
| Pelvi-abdominal | 1 (1.5%) | |
| Pancreas | 1 (1.5%) | |
| Mesentery | 2 (3.1%) | |
| Mitotic index | ≤ 5 per 5 mm2 | 38 (58.5%) |
| > 5 per 5 mm2 | 27 (41.5%) | |
| Risk stratification | Very low/low | 30 (46.2%) |
| Intermediate | 7 (10.8%) | |
| High | 28 (43.1%) | |
| Surgical cut margins | Free | 60 (92.3%) |
| Infiltrative | 5 (7.7%) | |
| Local recurrence | Absent | 54 (83.1%) |
| Present | 11 (16.9%) | |
| Metastasis | Absent | 49 (75.4%) |
| Present | 16 (24.6%) | |
| Lymph nodes status | Negative | 58 (89.2%) |
| Positive | 7 (10.8%) | |
| CD117 expression | Negative | 21 (32.3%) |
| Positive | 44 (67.7%) | |
| DOG1 expression | Negative | 31 (47.7%) |
| Positive | 34 (52.3%) | |
| CD34 expression | Negative | 40 (61.5%) |
| Positive | 25 (38.5%) | |
| SMA expression | Negative | 50 (76.9%) |
| Positive | 15 (23.1%) | |
| S100 expression | Negative | 55 (84.6%) |
| Positive | 10 (15.4%) | |
| IHC marker | Number of cases | ||
| N = 65 | |||
| p16 expression | Negative | 50 (76.9%) | |
| Positive | 15 (23.1%) | ||
| p53 expression | Negative | 44 (67.7%) | |
| Positive | 21 (32.3%) | ||
| BCL2 expression | Negative | 13 (20%) | |
| Positive | Low | 22 (33.8%) | |
| High | 30 (46.2%) | ||
| Cyclin D1 expression | Negative | 8 (12.3%) | |
| Positive | Low | 42 (64.6%) | |
| High | 15 (23.1%) | ||
| Clinicopathological parameters | p16 | Test of significance | ||||
| Negative (<10%) | Positive (≥10%) | |||||
| N = 50 | N = 15 | |||||
| Age (years) | Mean age | 61.36 ± 12.88 | 58.60 ± 12.19 | t = 0.736 | P = 0.464 | |
| Tumor size (cm) | Mean size | 9.62 ± 8.01 | 13.77 ± 6.25 | Z = 1.84 | P = 0.071 | |
| Tumor site | Stomach | 35 (70.0) | 5 (33.3) | ꭓ2 = 16.57 | P = 0.005* | |
| Small intestine | 4 (8.0) | 8 (53.3) | ||||
| Rectum | 7 (14.0) | 2 (13.3) | ||||
| Pelvi-abdominal | 1 (2.0) | 0 | ||||
| Pancreas | 1 (2.0) | 0 | ||||
| Mesentery | 2 (4.0) | 0 | ||||
| Mitotic index | ≤ 5 per 5 mm2 | 36 (72.0) | 2 (13.3) | ꭓ2 = 16.35 | P < 0.001* | |
| > 5 per 5 mm2 | 14 (28.0) | 13 (86.7) | ||||
| Risk stratification | Very low/low | 30 (60.0) | 0 | ꭓ2 = 20.74 | P < 0.001* | |
| Intermediate | 6 (12.0) | 1 (6.7) | ||||
| High | 14 (28.0) | 14 (93.3) | ||||
| Surgical cut margins | Free | 47 (94.0) | 13 (86.7) | ꭓ2 = 0.874 | P = 0.325 | |
| Infiltrative | 3 (6.0) | 2 (13.3) | ||||
| Local recurrence | Negative | 46 (92.0) | 8 (53.3) | ꭓ2 = 12.27 | P = 0.001* | |
| Positive | 4 (8.0) | 7 (46.7) | ||||
| Metastasis | Negative | 46 (92.0) | 3 (20.0) | ꭓ2 = 32.24 | P = 0.001* | |
| Positive | 4 (8.0) | 12 (80.0) | ||||
| Lymph nodes status | Negative | 47 (94.0) | 11 (73.3) | ꭓ2 = 5.13 | P = 0.024* | |
| Positive | 3 (6.0) | 4 (26.7) | ||||
| CD117 expression | Negative | 20 (40.0) | 1 (6.7) | ꭓ2 = 5.86 | P = 0.015* | |
| Positive | 30 (60.0) | 14 (93.3) | ||||
| DOG1 expression | Negative | 26 (52.0) | 5 (33.3) | ꭓ2 = 1.61 | P = 0.204 | |
| Positive | 24 (48.0) | 10 (66.7) | ||||
| CD34 expression | Negative | 34 (68.0) | 6 (40.0) | ꭓ2 = 3.82 | P = 0.051 | |
| Positive | 16 (32.0) | 9 (60.0) | ||||
| SMA expression | Negative | 39 (78.0) | 11 (73.3) | ꭓ2 = 0.142 | P = 0.707 | |
| Positive | 11 (22.0) | 4 (26.7) | ||||
| S100 expression | Negative | 42 (84.0) | 13 (86.7) | ꭓ2 = 0.063 | P = 0.802 | |
| Positive | 8 (16.0) | 2 (13.3) | ||||
| p53 expression | Negative | 41 (82.0) | 3 (20.0) | ꭓ2 = 20.28 | P = 0.001* | |
| Positive | 9 (18.0) | 12 (80.0) | ||||
| BCL2 expression | Negative | 11 (22.0) | 2 (13.3) | ꭓ2 = 5.98 | P = 0.05* | |
| Positive | Low | 20 (40.0) | 2 (13.3) | |||
| High | 19 (38.0) | 11 (73.3) | ||||
| Cyclin D1 expression | Negative | 3 (6.0) | 5 (33.3) | ꭓ2 = 8.06 | P = 0.018* | |
| Positive | Low | 35 (70.0) | 7 (46.7) | |||
| High | 12 (24.0) | 3 (20.0) | ||||
| Clinicopathological parameters | p53 | Test of significance | ||||
| Negative (<10%) | Positive (≥10%) | |||||
| N = 44 | N = 21 | |||||
| Age (years) | Mean age | 60.79 ± 13.53 | 60.57 ± 11.0 | t = 0.07 | P = 0.948 | |
| Tumor size (cm) | Mean size | 60.57 ± 11.02 | 15.36 ± 8.57 | Z = 3.75 | P = 0.001* | |
| Tumor site | Stomach | 31 (70.5) | 9 (42.9) | ꭓ2 = 23.2 | P = 0.001* | |
| Small intestine | 2 (4.5) | 10 (47.6) | ||||
| Rectum | 9 (20.5) | 0 | ||||
| Pelvi-abdominal | 0 | 1 (4.8) | ||||
| Pancreas | 1 (2.3) | 0 | ||||
| Mesenteric | 1 (2.3) | 1 (4.8) | ||||
| Mitotic index | ≤ 5 per 5 mm2 | 33 (75.0) | 5 (23.8) | ꭓ2 = 15.34 | P < 0.001* | |
| > 5 per 5 mm2 | 11 (25.0) | 16 (76.2) | ||||
| Risk stratification | Very low/low | 27 (61.4) | 3 (14.3) | ꭓ2 = 12.97 | P = 0.002* | |
| Intermediate | 4 (9.1) | 3 (14.3) | ||||
| High | 13 (29.5) | 15 (71.4) | ||||
| Surgical cut margins | Free | 41 (93.2) | 19 (90.5) | ꭓ2 = 0.147 | P = 0.702 | |
| Infiltrative | 3 (6.8) | 2 (9.5) | ||||
| Local recurrence | Negative | 40 (90.9) | 14 (66.7) | ꭓ2 = 5.94 | P = 0.015* | |
| Positive | 4 (9.1) | 7 (33.3) | ||||
| Metastasis | Negative | 40 (90.9) | 9 (42.9) | ꭓ2 = 17.69 | P = 0.001* | |
| Positive | 4 (9.1) | 12 (57.1) | ||||
| Lymph nodes status | Negative | 40 (90.9) | 18 (85.7) | ꭓ2 = 0.399 | P = 0.527 | |
| Positive | 4 (9.1) | 3 (14.3) | ||||
| CD117 expression | Negative | 17 (38.6) | 4 (19.0) | ꭓ2 = 2.49 | P = 0.114 | |
| Positive | 27 (61.4) | 17 (81.0) | ||||
| DOG1 expression | Negative | 24 (54.5) | 7 (33.3) | ꭓ2 = 2.56 | P = 0.109 | |
| Positive | 20 (45.5) | 14 (66.7) | ||||
| CD34 expression | Negative | 30 (68.2) | 10 (47.6) | ꭓ2 = 2.54 | P = 0.111 | |
| Positive | 14 (31.8) | 11 (52.4) | ||||
| SMA expression | Negative | 32 (72.7) | 18 (85.7) | ꭓ2 = 1.35 | P = 0.245 | |
| Positive | 12 (27.3) | 3 (14.3) | ||||
| S100 expression | Negative | 36 (81.8) | 19 (90.5) | ꭓ2 = 0.819 | P = 0.366 | |
| Positive | 8 (18.2) | 2 (9.5) | ||||
| p16 expression | Negative | 41 (93.2) | 9 (42.9) | ꭓ2 = 20.28 | P = 0.001* | |
| Positive | 3 (6.8) | 12 (57.1) | ||||
| BCL2 expression | Negative | 12 (27.3) | 1 (4.8) | ꭓ2 = 11.67 | P = 0.003* | |
| Positive | Low | 18 (40.90) | 4 (19.0) | |||
| High | 14 (31.8) | 16 (76.2) | ||||
| Cyclin D1 expression | Negative | 2 (4.5) | 6 (28.6) | ꭓ2 = 14.39 | P = 0.001* | |
| Positive | Low | 35 (79.5) | 7 (33.3) | |||
| High | 7 (15.9) | 8 (38.1) | ||||
| Clinicopathological parameters | BCL 2 | Test of significance | |||||
| Negative | Positive | ||||||
| N = 13 | N = 52 | ||||||
| Low | High | ||||||
| Age (years) | Mean age | 64.46 ± 12.18 | 61.09 ± 13.53 | 58.83 ± 12.29 | KW = 0.904 | P = 0.410 | |
| Tumor size (cm) | Mean size | 7.12 ± 4.30 | 10.12 ± 7.27 | 12.42 ± 8.89 | KW = 2.24 | P = 0.115 | |
| Tumor site | Stomach | 11 (84.6) | 16(72.7) | 13(43.3) | ꭓ2 = 14.12 | P = 0.168 | |
| Small intestine | 1 (7.7) | 1(4.5) | 10(33.3) | ||||
| Rectum | 1 (7.7) | 3(13.6) | 5(16.7) | ||||
| Pelvi-abdominal | 0 | 0 | 1(3.3) | ||||
| Pancreas | 0 | 1(4.5) | 0 | ||||
| Mesentery | 0 | 1(4.5) | 1(3.3) | ||||
| Mitotic index | ≤ 5 per 5 mm2 | 9 (69.2) | 15(68.2) | 14(46.7) | ꭓ2 = 3.19 | P = 0.202 | |
| > 5 per 5 mm2 | 4 (30.8) | 7(31.8) | 16(53.3) | ||||
| Risk stratification | Very low/low | 8 (61.5) | 11(50.0) | 11(36.7) | ꭓ2 = 5.42 | P = 0.247 | |
| Intermediate | 1 (7.7) | 4(18.2) | 2(6.7) | ||||
| High | 4 (30.8) | 7(31.8) | 17(56.7) | ||||
| Surgical cut margins | Free | 12 (92.3) | 20(90.9) | 28(93.3) | ꭓ2 = 0.105 | P = 0.949 | |
| Infiltrative | 1 (7.7) | 2(9.1) | 2(6.7) | ||||
| Local recurrence | Negative | 11 (84.6) | 20(90.9) | 23(76.7) | ꭓ2 = 1.86 | P = 0.395 | |
| Positive | 2 (15.4) | 2(9.1) | 7(23.3) | ||||
| Metastasis | Negative | 12 (92.3) | 20(90.9) | 17(56.7) | ꭓ2 = 10.53 | P = 0.005* | |
| Positive | 1 (7.7) | 2(9.1) | 13(43.3) | ||||
| Lymph nodes status | Negative | 13 (100) | 20(90.9) | 25(83.3) | ꭓ2 = 2.72 | P = 0.257 | |
| Positive | 0 | 2(9.1) | 5(16.7) | ||||
| CD117 expression | Negative | 5 (38.5) | 7(31.8) | 9(30.0) | ꭓ2 = 0.301 | P = 0.860 | |
| Positive | 8 (61.5) | 15 (68.2) | 21 (70.0) | ||||
| DOG1 expression | Negative | 7 (53.8) | 10 (45.5) | 14 (46.7) | ꭓ2 = 0.254 | P = 0.881 | |
| Positive | 6 (46.2) | 12 (54.5) | 16 (53.3) | ||||
| CD34 expression | Negative | 11 (84.6) | 11 (50.0) | 18 (60.0) | ꭓ2 = 4.19 | P = 0.123 | |
| Positive | 2 (15.4) | 11 (50.0) | 12 (40.0) | ||||
| SMA expression | Negative | 9 (69.2) | 16 (72.7) | 25 (83.3) | ꭓ2 = 1.35 | P = 0.510 | |
| Positive | 4 (30.8) | 6 (27.3) | 5 (16.7) | ||||
| S100 expression | Negative | 10 (76.9) | 17 (77.3) | 28 (93.3) | ꭓ2 = 3.25 | P = 0.197 | |
| Positive | 3 (23.1) | 5 (22.7) | 2 (6.7) | ||||
| p16 expression | Negative | 11 (84.6) | 20 (90.9) | 19 (63.3) | ꭓ2 = 5.98 | P = 0.050* | |
| Positive | 2 (15.4) | 2 (9.1) | 11 (36.7) | ||||
| p53 expression | Negative | 12 (92.3) | 18 (81.8) | 14 (46.7) | ꭓ2 = 11.67 | P = 0.003* | |
| Positive | 1 (7.7) | 4 (18.2) | 16 (53.3) | ||||
| Cyclin D1 expression | Negative | 1 (7.7) | 0 | 7 (23.3) | ꭓ2 = 9.58 | P = 0.048* | |
| Positive | Low | 11 (84.6) | 16 (72.7) | 15 (50.0) | |||
| High | 1 (7.7) | 6 (27.3) | 8 (26.7) | ||||
| Clinicopathological parameters | Cyclin D1 | Test of significance | |||||
| Negative | Positive | ||||||
| N = 8 | N = 57 | ||||||
| Low | High | ||||||
| Age (years) | Mean age | 55.63 ± 10.42 | 62.78 ± 12.88 | 57.67 ± 12.57 | F = 1.67 | P = 0.196 | |
| Tumor size (cm) | Mean size | 12.50 ± 8.60 | 10.45 ± 7.37 | 9.93 ± 8.89 | KW = 0.294 | P = 0.746 | |
| Tumor site | Stomach | 2 (25.0) | 26 (61.9) | 12 (80.0) | ꭓ2 = 23.42 | P = 0.009* | |
| Small intestine | 5 (62.5) | 5 (11.9) | 2 (13.3) | ||||
| Rectum | 0 | 8 (19.0) | 1 (6.7) | ||||
| Pelvi-abdominal | 1 (12.5) | 0 | 0 | ||||
| Pancreas | 0 | 1 (2.4) | 0 | ||||
| Mesenteric | 0 | 2 (4.8) | 0 | ||||
| Mitotic index | ≤ 5 per 5 mm2 | 3 (37.5) | 28 (66.7) | 7 (46.7) | ꭓ2 = 3.47 | P = 0.176 | |
| > 5 per 5 mm2 | 5 (62.5) | 14 (33.3) | 8 (53.3) | ||||
| Risk stratification | Very low/low | 2 (25.0) | 23 (54.8) | 5 (33.3) | ꭓ2 = 9.05 | P = 0.06 | |
| Intermediate | 0 | 3 (7.1) | 4 (26.7) | ||||
| High | 6 (75.0) | 16 (38.1) | 6 (40.0) | ||||
| Surgical cut Margins | Free | 7 (87.5) | 39 (92.9) | 14 (93.3) | ꭓ2 = 0.300 | P = 0.860 | |
| Infiltrative | 1 (12.5) | 3 (7.1) | 1 (6.7) | ||||
| Local recurrence | Negative | 4 (50.0) | 38 (90.5) | 12 (80.0) | ꭓ2 = 7.96 | P = 0.019* | |
| Positive | 4 (50.0) | 4 (9.5) | 3 (20.0) | ||||
| Metastasis | Negative | 3 (37.5) | 33 (78.6) | 13 (86.7) | ꭓ2 = 7.45 | P = 0.024* | |
| Positive | 5 (62.5) | 9 (21.4) | 2 (13.3) | ||||
| Lymph nodes status | Negative | 5 (62.5) | 40 (95.2) | 13 (86.7) | ꭓ2 = 7.63 | P = 0.02* | |
| Positive | 3 (37.5) | 2 (4.8) | 2 (13.3) | ||||
| CD117 expression | Negative | 2 (25.0) | 16 (38.1) | 3 (20.0) | ꭓ2 = 1.88 | P = 0.391 | |
| Positive | 6 (75.0) | 26 (61.9) | 12 (80.0) | ||||
| DOG1 expression | Negative | 2 (25.0) | 23 (54.8) | 6 (40.0) | ꭓ2 = 2.85 | P = 0.241 | |
| Positive | 6 (75.0) | 19 (45.2) | 9 (60.0) | ||||
| CD34 expression | Negative | 6 (75.0) | 26 (61.9) | 8 (53.3) | ꭓ2 = 1.04 | P = 0.594 | |
| Positive | 2 (25.0) | 16 (38.1) | 7 (46.7) | ||||
| SMA expression | Negative | 7 (87.5) | 31 (73.8) | 12 (80.0) | ꭓ2 = 0.814 | P = 0.666 | |
| Positive | 1 (12.5) | 11 (26.2) | 3 (20.0) | ||||
| S100 expression | Negative | 7 (87.5) | 35 (83.3) | 13 (86.7) | ꭓ2 = 0.153 | P = 0.927 | |
| Positive | 1 (12.5) | 7 (16.7) | 2 (13.3) | ||||
| p16 expression | Negative | 3 (37.5) | 35 (83.3) | 12 (80.0) | ꭓ2 = 8.06 | P = 0.018* | |
| Positive | 5 (62.5) | 7 (16.7) | 3 (20.0) | ||||
| p53 expression | Negative | 2 (25.0) | 35 (83.3) | 7 (46.7) | ꭓ2 = 14.39 | P = 0.001* | |
| Positive | 6 (75.0) | 7 (16.7) | 8 (53.3) | ||||
| BCL2 expression | Negative | 1 (12.5) | 11 (26.2) | 1 (6.7) | ꭓ2 = 9.58 | P = 0.048* | |
| Positive | Low | 0 | 16 (38.1) | 6 (40.0) | |||
| High | 7 (87.5) | 15 (35.7) | 8 (53.3) | ||||
| Immunohistochemical marker | β | P-value | Odds ratio | 95% CI for odds ratio | |||
| Lower | Upper | ||||||
| p16 (positive) | 2.790 | 0.024* | 16.284 | 1.432 | 185.207 | ||
| p53 (positive) | -0.396 | 0.717 | 0.673 | 0.079 | 5.729 | ||
| BCL2 | Negative | - | 0.926 | R | - | - | |
| Positive | Low | -0.589 | 0.696 | 0.555 | 0.029 | 10.637 | |
| High | -0.412 | 0.768 | 0.662 | 0.043 | 10.265 | ||
| Cyclin D1 | Negative | - | 0.254 | R | - | - | |
| Positive | Low | -1.818 | 0.179 | 0.162 | 0.011 | 2.296 | |
| High | -0.276 | 0.849 | 0.759 | 0.044 | 13.029 | ||
| Constant | -2.039 | 0.313 | 0.130 | - | - | ||
| Immunohistochemical marker | β | P-value | Odds ratio | 95% CI for odds ratio | |||
| Lower | Upper | ||||||
| p16 (positive) | 3.273 | 0.012* | 26.401 | 2.083 | 334.550 | ||
| p53 (positive) | 1.282 | 0.264 | 3.604 | 0.380 | 34.169 | ||
| BCL2 | Negative | - | 0.157 | R | - | - | |
| Positive | Low | 0.591 | 0.757 | 1.805 | 0.043 | 76.44 | |
| High | 2.749 | 0.139 | 15.629 | 0.410 | 595.07 | ||
| Cyclin D1 | Negative | - | 0.279 | R | - | - | |
| Positive | Low | 0.005 | 0.998 | 1.005 | 0.024 | 41.994 | |
| High | -1.889 | 0.331 | 0.151 | 0.003 | 6.846 | ||
| Constant | -5.590 | 0.065 | 0.004 | - | - | ||
| Immunohistochemical marker | Median DFS (95%CI) | Log rank ꭓ2 | P-value | Median OS (95%CI) | Log rank ꭓ2 | P-value | |
| p16 | Negative | 119.52 (109.81-129.23) | ꭓ2 = 36.01 | P = 0.001* | 123.07 (115.86-130.27) | ꭓ2 = 31.25 | P = 0.001* |
| Positive | 57.27 (39.41-75.12) | 77.6 (61.33-93.88) | |||||
| p53 | Negative | 117.82 (106.88-128.75) | ꭓ2 = 15.96 | P = 0.001* | 123.77 (117.18-130.37) | ꭓ2 = 16.11 | P = 0.001* |
| Positive | 74.05 (57.07-91.02) | 84 (69.05-98.94) | |||||
| BCL2 | Negative | 115.38 (94.05-136.72) | ꭓ2 = 5.32 | P = 0.07 | 121.85 (108.34-135.35) | ꭓ2 = 7.16 | P = 0.028* |
| Low | 116.72 (101.75-131.71) | 123.19 (112.76-133.61) | |||||
| High | 92.23 (75.31-109.16) | 100.8 (87.15-114.45) | |||||
| Cyclin D1 | Negative | 79.5 (57.52-101.48) | ꭓ2 = 4.02 | P = 0.134 | 91.(75.98-107.02) | ꭓ2 = 5.11 | P = 0.08 |
| Low | 107.02 (93.22-120.83) | 113.14 (102.31-123.98) | |||||
| High | 111.20 (91.94-130.46) | 119.80 (106.78-132.82) | |||||
Peer Reviews
No public reviews on file for this paper yet. If you reviewed it on a platform where reviews are public (OpenReview, ICLR, NeurIPS, ICML), you can paste yours below so the community can read it here.
Videos
No videos yet. Explain this paper in a talk, walkthrough, or lecture? Add one.
Taxonomy
TopicsGastrointestinal Tumor Research and Treatment · Gastrointestinal disorders and treatments · Gastric Cancer Management and Outcomes
Introduction
Gastrointestinal stromal tumors (GISTs) represent the predominant mesenchymal neoplasms within the gastrointestinal tract. Their precursors are the interstitial cells of Cajal, which are located between the circular and longitudinal layers of the muscularis propria. GISTs are uncommon tumors, making up only about 1% to 2% of all malignant neoplasms in the gastrointestinal system [1,2]. Most tumors affect the stomach and small intestine. GISTs mainly affect adults aged 60 to 70 years, with no gender predominance [3,4].
The behavior of GISTs varies from incidental small tumors to those with widespread metastasis. The primary treatment for GISTs is total surgical excision. Post-surgery adjuvant therapy, especially with imatinib or other tyrosine kinase inhibitors (TKIs), relies on GIST risk classifications, which remain inadequate and debatable [4].
The 2018 Version 2 National Comprehensive Cancer Network (NCCN) guidelines, the most recent European Society for Medical Oncology (ESMO)/European Reference Network on Rare Adult Solid Cancers (EURACAN) guidelines, and the French Intergroup Clinical Practice guidelines identified key risk factors: mitotic rate, tumor size, and tumor site. Moreover, tumor rupture, cellular atypia, and necrosis were acknowledged as independent risk factors. Meanwhile, other prognostic indicators, such as different gene mutations, have also been linked to patient outcomes [3,5].
Mutations in the KIT proto-oncogene, which encodes the receptor tyrosine kinase c-KIT, along with subsequent discoveries of platelet-derived growth factor receptor alpha (PDGFRA) mutations, led to the development of small-molecule targeted therapies using TKIs in the treatment of GISTs. Nevertheless, these mutations alone are insufficient to drive the progression of GISTs from low to high risk. Further chromosomal alterations and resulting disruptions in cell cycle regulation are crucial for advancing tumor development [2].
The tumor suppressor protein cyclin-dependent kinase inhibitor 2A, p16INK4a (p16), inhibits the cell cycle by arresting cells in G1 before S phase entry. Loss of p16 protein has been identified as a predictor of a poor clinical outcome in a variety of human tumors and has also been reported with high-risk GISTs [5,6].
The tumor protein p53 (TP53) gene encodes the tumor suppressor protein p53, often referred to as the guardian of the genome, and is mutated in most human malignancies, albeit with varying frequencies across different tumor types. TP53 mutations are generally infrequent (<5%) in GIST cohorts but have been linked to high-risk disease [2].
B-cell lymphoma 2 (BCL2) is an essential membrane protein mainly present on the outer mitochondrial membrane. The overexpression of BCL2 may provide a selective survival advantage to neoplastic cells through its anti-apoptotic effects. The overexpression of BCL2 in GISTs may result from the intrinsic activation of KIT. Furthermore, its recurrent overexpression may be targeted for adjuvant or alternative treatment [7].
Cyclin D1 is activated during the G1 phase of the cell cycle, subsequently activating cyclin-dependent kinase 4 (CDK4) and cyclin/CDK complexes, facilitating the progression to the S phase of the cell cycle [8]. Cyclin D1 was shown to be overexpressed in KIT-independent GISTs, indicating its function in tumor proliferation and resistance when KIT signaling is lost [9]. Therefore, the inhibition of Cyclin D1 may induce anti-proliferative effects and promote apoptosis [10].
The current study aims to evaluate the immunohistochemical expression of p16, p53, BCL2, and Cyclin D1 in GISTs and to analyze their correlations with the clinicopathological characteristics and survival outcomes of the studied cases.
Materials and methods
Study design
This retrospective cohort study included 65 cases of GISTs retrieved from the archive of the Surgical Pathology Laboratory at Mansoura University's Gastroenterology Center between 2014 and 2018. The inclusion criteria were the availability of comprehensive clinical data, medical reports, and paraffin blocks. Cases lacking comprehensive clinical data or available paraffin tissue blocks were excluded from the study.
Clinical characteristics and histopathological assessment
The pathology reports of the included cases, along with hematoxylin and eosin (H&E) and immunohistochemical stained slides for cluster of differentiation 117 (CD117), discovered on GIST-1 (DOG1), smooth muscle actin (SMA), cluster of differentiation 34 (CD34), and S100 protein (S100), were examined and revised to validate the diagnosis and evaluate the clinicopathological characteristics, including age, gender, tumor location and size, surgical margins, lymph node involvement, local recurrence, and distant metastasis. Both disease-free survival (DFS) and overall survival (OS) were calculated for all patients and subsequently analyzed to assess their prognostic implications.
All cases were re-evaluated, and risk stratification was conducted in accordance with the latest criteria recommended by the NCCN guidelines and the WHO Classification of Digestive System Tumors (fifth edition, 2019). Mitotic count was assessed by counting mitoses in the region with the highest mitotic activity and reported as the number of mitotic figures per 5 mm², following the updated guidelines, which replaced the previous method based on 50 high-power fields, to ensure standardization and reproducibility [11].
Tissue microarray (TMA) construction
After examination of H&E-stained slides, a representative cellular-qualified area of the tumor was marked for each case. The corresponding paraffin block was retrieved from our pathology archive. Six 0.6 mm thick cores were extracted from each case and placed into the recipient blocks. Three TMA blocks were constructed using a Beecher manual micro-arrayer, following a specific design map for each block.
Immunohistochemical staining procedure
Four-micrometer-thick tissue sections were obtained from previously constructed TMA blocks. Sections underwent deparaffinization, rehydration, and antigen retrieval using the BT-Link system (Dako, Glostrup, Denmark), following the manufacturer’s instructions. Immunostaining was performed using the automated Dako autostainer Link 48 platform. The following primary antibodies were used: Rabbit monoclonal anti-human p16 antibody (clone QR019; Quartett, Berlin, Germany), ready-to-use, Mouse monoclonal anti-human p53 protein (clone DO-7; Dako, Glostrup, Denmark), ready-to-use, Mouse monoclonal anti-human BCL2 oncoprotein (clone 124; Dako, Glostrup, Denmark), ready-to-use, Rabbit monoclonal anti-human Cyclin D1 (clone EP12; Dako, Glostrup, Denmark), ready-to-use.
Detection was performed using the Dako EnVision FLEX system with High pH buffer, according to the manufacturer’s protocol. 3,3′-Diaminobenzidine (DAB) was utilized as the chromogen, while hematoxylin was used for counterstaining.
Appropriate positive controls were included for each marker. Negative controls were conducted concurrently by omitting the primary antibody to verify staining specificity.
Immunohistochemical analysis
p16 expression was evaluated based on the percentage of immunoreactive tumor cells, defined by strong cytoplasmic staining with or without concurrent nuclear staining. A threshold of 10% was applied as the cutoff point, with cases categorized as negative (0%-9%) or positive (≥10%). Similarly, p53 expression was considered positive when ≥10% of tumor cells exhibited strong nuclear staining.
BCL2 and Cyclin D1 expression were assessed using a semi-quantitative scoring system that accounted for both staining intensity and the percentage of positively stained cells. For Cyclin D1, only nuclear staining was evaluated, whereas cytoplasmic staining was considered for BCL2. Staining intensity was graded on a scale from 0 (no staining) to 3 (strong staining), and the proportion of positive cells was scored as follows: 0 (no staining), 1 (1-10%), 2 (11-50%), 3 (51-80%), and 4 (>80%). The final score was calculated by multiplying the intensity and percentage scores, yielding a composite score ranging from 0 to 12. Tumors were subsequently categorized into three groups based on this score: negative (0), low expression (1-5), and high expression (6-12).
Statistical analysis
The data were analyzed using SPSS software (IBM SPSS Statistics for Windows, IBM Corp., Version 25, Armonk, NY). Qualitative data were expressed numerically and as percentages. Quantitative data were presented as mean ± standard deviation. The significance of the acquired results was determined at the 0.05 level. Chi-square and Monte Carlo tests were used to compare qualitative data across groups as needed. Non-normally distributed data were compared using the Kruskal-Wallis test and the Mann-Whitney U test. The Student's t-test was used to compare two independent groups with non-normally distributed data. A one-way ANOVA test was used to examine numerous independent groups, using a post hoc Tukey test for pairwise comparisons. Spearman's rank-order correlation measures the strength and direction of a linear link between two non-normally distributed continuous or ordinal variables. Using the enter approach, binary logistic regression is used to analyze the influence of multiple independent predictors on a binary outcome. Survival analysis was performed using the Kaplan-Meier method, with differences between groups assessed by the log-rank test. Median survival times were estimated along with their corresponding 95% confidence intervals (CIs).
Results
The clinicopathological characteristics of the studied cohort are summarized in Table 1. The patients’ mean age was 60.7 years, while the mean tumor size was 8 cm. The stomach was the predominant primary site (40 cases, 61.5%), followed by the small intestine (12 cases, 18.5%). Regarding risk stratification, 30 cases (46.2%) were classified as very low/low risk, seven cases (10.8%) as intermediate risk, and 28 cases (43.1%) as high risk. Most tumors had free surgical margins (60 cases, 92.3%). Local recurrence was observed in 11 cases (16.9%), distant metastasis in 16 cases (24.6%), and lymph node involvement in seven cases (10.8%). Immunohistochemically, CD117 was expressed in 44 cases (67.7%), and DOG1 in 34 cases (52.3%). In contrast, CD34, SMA, and S100 showed lower expression rates.
Regarding the immunohistochemical expression of p16, p53, BCL2, and Cyclin D1. We reported that 15 cases (23.1%) were positive for p16, 21 cases (32.3%) were positive for p53, 52 cases (80%) were positive for BCL2, and 57 cases (87.7%) were positive for Cyclin D1 (Table 2, Figures 1-4).
Strong cytoplasmic p16 expression in a gastrointestinal stromal tumor (GIST) from small intestine with high-risk stratification (p16, ×200).
Strong nuclear p53 expression in a gastric gastrointestinal stromal tumor (GIST) with high risk stratification (p53, ×200).
High cytoplasmic BCL2 expression in a gastrointestinal stromal tumor (GIST) from the small intestine with high-risk stratification. B: Low cytoplasmic BCL2 expression in a GIST from the small intestine with high risk stratification (BCL2, ×200).
High nuclear Cyclin D1 expression in a gastric gastrointestinal stromal tumor (GIST) with intermediate risk stratification. B: Low nuclear Cyclin D1 expression in a gastric GIST with high risk stratification.
p16 immunohistochemical evaluation
Regarding p16 expression in relation to clinicopathological parameters of the studied cases, there were statistically significant associations between p16 expression and tumor site (P = 0.005), risk stratification (P < 0.001), mitotic index (P < 0.001), local recurrence (P = 0.001), distant metastasis (P = 0.001), lymph nodes involvement (P = 0.024), and CD117 expression (P = 0.015). Also, there were statistically significant associations between P16 expression and expression of BCL2 (P = 0.05), p53 (P = 0.001), and Cyclin D1 (P = 0.018) (Table 3).
p53 immunohistochemical evaluation
Regarding p53 expression in the studied cases, we found statistically significant associations between p53 expression and tumor size (P = 0.001), tumor site (P = 0.001), risk stratification (P = 0.002), mitotic index (P < 0.001), local recurrence (P = 0.015), and distant metastasis (P = 0.001). p53 expression also showed statistically significant associations with p16 (P = 0.001), BCL2 (P = 0.003), and Cyclin D1 (P = 0.001) expressions (Table 4).
BCL2 immunohistochemical evaluation
There were statistically insignificant relations between BCL2 expression and all studied clinicopathological parameters except for distant metastasis (P = 0.005). In contrast, we found statistically significant relations between BCL2 expression and expressions of p16 (P = 0.05), p53 (P = 0.003), and Cyclin D1 (P = 0.048) (Table 5).
Cyclin D1 immunohistochemical evaluation
Concerning Cyclin D1 expression in relation to clinicopathological parameters, there were statistically significant correlations between Cyclin D1 expression and tumor site (P = 0.009), local recurrence (P = 0.019), distant metastasis (P = 0.024), and lymph nodes involvement (P = 0.02). Also, there were statistically significant relations between Cyclin D1 expression and expressions of p16 (P = 0.018), p53 (P = 0.001), and BCL2 (P = 0.048) (Table 6).
Binary logistic regression for predictors of recurrence and metastasis
To further explore potential prognostic predictors, the relationship between the expression of the investigated immunohistochemical markers and the development of local recurrence or distant metastasis was analyzed. Binary logistic regression revealed that positive p16 expression is an independent predictor of both local recurrence (P = 0.024) and distant metastasis (P = 0.012) (Tables 7-8).
Survival analysis
Table 9 presents the analysis of DFS and OS, demonstrating variable prognostic implications of the investigated markers. p16 expression showed a strong association with adverse outcomes, as patients with positive expression had significantly shorter DFS (P = 0.001) and OS (P = 0.001), underscoring its value as a robust marker of poor prognosis in GISTs. Similarly, p53 positivity was correlated with unfavorable clinical behavior, with markedly reduced DFS (P = 0.001) and OS (P = 0.001), highlighting its role in identifying high-risk disease.
For BCL2, patients were stratified into negative, low, and high expression groups. While DFS did not differ significantly across groups (P = 0.07), OS was significantly shorter in the high-expression group compared with the negative and low-expression groups (P = 0.028), suggesting a potential adverse prognostic impact of strong BCL2 expression.
In contrast, Cyclin D1 expression exhibited a different pattern. A stepwise increase in both DFS and OS was observed with higher expression levels. Although these differences did not achieve statistical significance for DFS or OS (P = 0.134 and P = 0.08, respectively), the pattern indicates a favorable trend associated with elevated Cyclin D1 expression.
Discussion
GISTs constitute the most common mesenchymal neoplasms within the digestive tract. These tumors exhibit a wide range of biological behaviors. However, there are only a few histological features that help predict tumor progression. The most recent classification of GISTs considers the mitotic rate, tumor size, and tumor location, with only the mitotic rate being based on microscopic appearance. Immunohistochemistry is a helpful tool in routine pathological evaluation, facilitating more accurate diagnosis and guiding appropriate therapeutic strategies [12].
In the current study, p16 positivity was defined as strong cytoplasmic staining in ≥10% of tumor cells. We observed statistically significant associations between p16 expression and clinicopathological parameters, including tumor site, mitotic index, risk stratification, lymph node involvement, and distant metastasis. Furthermore, our findings support the role of p16 as an independent prognostic marker for local recurrence and distant metastasis in GISTs. In addition, p16 expression was significantly associated with shorter DFS and OS, highlighting its prognostic relevance.
Our findings are consistent with Schmieder et al. [13], who applied a 20% positivity threshold. They demonstrated that, in high-risk GIST patients, p16 expression was significantly linked to poor prognosis, including higher recurrence or metastasis rates and reduced OS. Moreover, p16 positivity was strongly predictive of reduced DFS in this group.
Haller et al. [14] revealed that strong cytoplasmic p16 expression was significantly associated with shorter DFS, independent of tumor location, size, and mitotic counts. Moreover, our results align with those of Jung et al. [15], who stated that p16 expression in GISTs was associated with poorer outcomes, as p16-positive tumors showed significantly higher recurrence and/or metastatic rates at both 10% and 50% cutoff values.
In another study, Jang et al. [5] defined p16 positivity as nuclear staining in more than 20% of tumor cells, with or without concurrent cytoplasmic staining. They reported p16 expression in 92 out of 217 cases (42.4%), which was strongly correlated with higher mitotic activity, necrosis, recurrence or metastasis, and a high-risk categorization. Additionally, p16-positive GISTs were associated with significantly reduced OS and DFS compared with p16-negative tumors. Nevertheless, p16 was not identified as an independent prognostic marker.
Moreover, Yakovtsova et al. [12] defined p16 positivity as cytoplasmic staining in ≥10% of tumor cells and highlighted its significant association with aggressive behavior in GISTs. Additionally, a recent review by O’Sullivan et al. [6] reaffirmed the significance of p16 as a pivotal regulator of cell cycle progression and senescence, which biologically correlates with its prognostic importance in tumors exhibiting aggressive characteristics. This indicates that p16 overexpression signifies impaired cell cycle regulatory mechanisms, which contribute to tumor aggressiveness.
In contrast to our findings, Schneider-Stock et al. [16] reported that patients with p16-negative tumors experienced significantly worse outcomes than those with p16-positive tumors, exhibiting a 2.3-fold elevated risk of disease-related mortality. Likewise, Sabah et al. [17] established that the absence of p16 expression was frequently related to the aggressive behavior of GISTs and regarded as a negative prognostic factor. Ihle et al. [18] assessed p16 expression using an overall score derived from the mean of percentage and intensity values, with scores >2 indicating high expression. Their findings showed that p16 expression was inconsistent and did not significantly correlate with clinicopathological features or patient outcomes, suggesting the limited value of this marker in predicting aggressive behavior in GIST.
This discrepancy may be attributed to methodological variations, differences in interpretation and scoring systems, as well as heterogeneity in patient cohorts and therapeutic interventions.
In the current study, p53 positivity was defined as strong nuclear staining in ≥10% of tumor cells. A significant association was observed between p53 expression and larger tumor size, specific tumor location, higher mitotic count, local recurrence, distant metastasis, and an increased risk of disease progression. In addition, p53 expression was significantly correlated with shorter DFS and OS, emphasizing its role as a potential adverse prognostic marker in GISTs.
Our findings are consistent with those of Feakins [19], who defined p53 positivity as nuclear staining in ≥10% of tumor cells with at least moderate intensity. They demonstrated that p53 expression was more commonly detected in higher-risk GISTs, particularly those of large tumor size and increased mitotic rate. Likewise, Sabah et al. [17] found that p53 overexpression occurred more frequently in high-risk GISTs, indicating its role in tumor progression via cell cycle deregulation. Furthermore, Pauser et al. [20] considered p53 expression positive when any proportion of tumor cells exhibited strong nuclear staining. Their findings identified a notable correlation between p53 positivity and aggressive histological characteristics, such as increased tumor size, nuclear atypia, increased mitotic count, and metastatic potential.
The meta-analysis conducted by Chang et al. [21] confirmed that p53 expression was more prevalent in malignant GIST and associated with high-risk classification, thereby reinforcing its prospective role in malignancy risk stratification. Moreover, our findings align with those of Wu et al. [2], who reported in their review that p53 overexpression is significantly associated with high mitotic activity, malignancy risk, and recurrence in localized GIST.
In the study by Ihle et al. [18], p53 expression was graded using a composite score of staining extent and intensity, with values above 2 interpreted as high expression. They observed increased p53 expression with patient age and high mitotic index. Furthermore, elevated p53 expression was significantly correlated with shorter DFS. They also found that p53 overexpression was not consistently linked to TP53 mutations. In their multivariate survival analysis, no independent prognostic significance was found for any of the cell cycle regulators, including p53, could be determined.
On the other hand, Chang et al. [21] observed no significant correlation between p53 expression and tumor size or mitotic activity, indicating that p53 immunohistochemical positivity may not consistently signify malignancy across all contexts.
Nevertheless, the accumulating evidence, particularly from recent studies, supports that p53 overexpression is frequently associated with aggressive tumor behavior and may serve as a useful prognostic biomarker in GIST.
In the current study, BCL2 expression was evaluated by combining staining intensity and percentage, and tumors were categorized as negative, low, or high expression. Our results did not show statistically significant associations with the studied clinicopathological parameters, except for distant metastasis. However, there was a significant correlation between BCL2 expression and the expressions of p16, p53, and Cyclin D1.
Pauser et al. [20] regarded any distinct cytoplasmic staining as positive but found no correlation between BCL2 expression and prognostic indicators, thereby suggesting its limited prognostic value. In contrast, Romeo et al. [7] assessed BCL2 expression using a composite score that integrated staining intensity and the percentage of positive cells across duplicate cores, defining scores >3 as high expression. Their analysis demonstrated a significant association between elevated BCL2 expression and tumor site. In addition, Chang et al. [21] found a statistical significance between BCL2 expression and the malignancy of the GIST. Furthermore, Aoyagi et al. [22] found no significant association between BCL2 and p53 expression, indicating that these markers may operate through distinct biological mechanisms.
Regarding disease outcomes, in the current study, patients with high BCL2 expression had significantly shorter OS compared with those with negative or low expression, suggesting a possible adverse prognostic impact of strong BCL2 expression. In contrast, Kontogianni et al. [23], who evaluated 102 patients using a 10% cutoff value, reported that BCL2 expression was a favorable prognostic indicator. Similarly, Steinert et al. [24] defined BCL2 positivity as any detectable cytoplasmic staining and demonstrated that BCL2 positivity was associated with longer DFS in patients with advanced GIST treated with imatinib. These discrepancies may be attributed to differences in cutoff values, patient cohorts, and treatment modalities across studies.
In the present study, Cyclin D1 expression was evaluated using a composite score based on nuclear staining intensity and the percentage of positive cells, with tumors classified as negative, low, or high expression. Significant correlations were observed between Cyclin D1 expression and tumor site, local recurrence, distant metastasis, and lymph node involvement.
These findings are consistent with those of Kim et al. [25], who reported that Cyclin D1 overexpression defines a notably aggressive subgroup of GISTs and is substantially associated with reduced OS, even in high-grade lesions. Similarly, Sabah et al. [17] found Cyclin D1 positivity in 30.4% of malignant and recurrent GISTs, with significant correlations among other cell-cycle regulators. Draper et al. [26] further demonstrated that Cyclin D1 expression was significantly correlated with retinoblastoma protein (Rb), supporting the role of Cyclin D1/Rb pathway alterations in driving uncontrolled proliferation. Likewise, Ihle et al. [18] identified a significant correlation between higher Cyclin D1 expression and both tumor location and mitotic activity.
Beyond its clinicopathological associations, the biological and therapeutic relevance of Cyclin D1 has been highlighted in KIT-independent GISTs. Ou et al. [9] showed that high Cyclin D1 expression is indicative of imatinib resistance, while its inhibition exerts anti-proliferative effects, suggesting a potential therapeutic vulnerability. In a similar context, Chen et al. [10] demonstrated that Cyclin D1 inhibition, combined with activation of p53 and p21, reduced tumor cell proliferation, reinforcing the concept of Cyclin D1 as a possible therapeutic target in this subtype.
ِAlthough our results demonstrated significant associations between Cyclin D1 expression and adverse pathological features, patients with higher Cyclin D1 expression tended to have longer DFS and OS, albeit not statistically significant. This apparent discrepancy may be explained by the influence of therapy. Cyclin D1 overexpression may enhance tumor proliferation but, at the same time, render tumor cells more susceptible to cell cycle-targeted agents such as TKIs, thereby improving treatment responsiveness and survival outcomes. This highlights the complex and context-dependent biological role of Cyclin D1 in GISTs and emphasizes the need for further studies to clarify its dual prognostic and predictive implications.
Interestingly, in line with our survival results, Wong et al. [27] reported that Cyclin D1 overexpression might unexpectedly be associated with a more favorable prognosis, whereas Pauser et al. [20] found no significant relationship between Cyclin D1 expression and major prognostic factors such as tumor size, mitotic activity, nuclear atypia, or proliferative index.
Although many studies have explored p16, p53, BCL2, and Cyclin D1 in GISTs, consistent conclusions regarding their prognostic value remain elusive. These discrepancies may be attributed to several factors, including heterogeneity in patient populations, variations in sample size, tumor site, and risk stratification, differences in immunohistochemical protocols and scoring systems, as well as follow-up duration and treatment modalities.
Moreover, molecular and genetic differences among tumor subtypes may also influence biomarker behavior. Therefore, these variations highlight the need for further multi-centric studies with standardized methodologies, integrating molecular subtyping such as KIT, PDGFRA mutations, Succinate dehydrogenase (SDH) deficiency, and cell cycle regulatory pathways, to better define the prognostic significance of these markers.
Our study, while offering valuable insights, has limitations that should be acknowledged. These include the relatively small sample size and the retrospective design. Moreover, the study was conducted at a single center, which may limit the generalizability of the results. The immunohistochemical evaluation of biomarkers relied on semi-quantitative scoring methods, without standardized cutoff values or universally accepted scoring systems, which may introduce inter-observer variability. Additionally, some biomarker assessments were based solely on immunohistochemistry without molecular validation. These factors may affect the generalizability and interpretation of the findings.
Conclusions
Our findings suggest that p16 and p53 expressions are valuable prognostic markers in GISTs, significantly associated with aggressive behavior and poor outcomes. p16 may serve as an independent indicator of recurrence and metastasis, while p53 could aid in risk stratification and inform therapeutic decisions. Although BCL2 and Cyclin D1 showed associations with tumor aggressiveness, their prognostic roles remain uncertain. Further multicenter and standardized studies are recommended to clarify the prognostic and therapeutic relevance of these biomarkers in GIST.
The reference list from the paper itself. Each links out to its DOI / PubMed record.
- 1Gastrointestinal stromal tumors: a comprehensive review J Gastrointest Oncol Parab TM De Rogatis MJ Boaz AM 1441541020193078817010.21037/jgo.2018.08.20PMC 6351301 · doi ↗ · pubmed ↗
- 2p 53 as a biomarker and potential target in gastrointestinal stromal tumors Front Oncol Wu CE Chen CP Huang WK Pan YR Aptullahoglu E Yeh CN Lunec J 8722021220223596553110.3389/fonc.2022.872202 PMC 9372431 · doi ↗ · pubmed ↗
- 3Prognostic indicators for gastrointestinal stromal tumors: a review Transl Oncol Zhang H Liu Q 1008121320203261982010.1016/j.tranon.2020.100812 PMC 7327422 · doi ↗ · pubmed ↗
- 4Gastrointestinal stromal tumors (GIST): a population-based study using the SEER database, including management and recent advances in targeted therapy Cancers (Basel) Khan J Ullah A Waheed A 914202210.3390/cancers 14153689 PMC 936757135954353 · doi ↗ · pubmed ↗
- 5Expression of p 16 predicts poor outcome for patients with gastrointestinal stromal tumors Int J Clin Exp Pathol Jang NR Choi JH Gu MJ 69126917102017 https://e-century.us/files/ijcep/10/6/ijcep 0052780.pdf
- 6The paradox of senescent-marker positive cancer cells: challenges and opportunities NPJ Aging O'Sullivan EA Wallis R Mossa F Bishop CL 411020243927762310.1038/s 41514-024-00168-y PMC 11401916 · doi ↗ · pubmed ↗
- 7Cell cycle/apoptosis molecule expression correlates with imatinib response in patients with advanced gastrointestinal stromal tumors Clin Cancer Res Romeo S Debiec-Rychter M Van Glabbeke M 419141981520091950915510.1158/1078-0432.CCR-08-3297 · doi ↗ · pubmed ↗
- 8A negative reciprocal regulatory axis between cyclin D 1 and HNF 4α modulates cell cycle progression and metabolism in the liver Proc Natl Acad Sci U S A Wu H Reizel T Wang YJ 171771718611720203263199610.1073/pnas.2002898117 PMC 7382236 · doi ↗ · pubmed ↗