Longitudinal Patterns and Predictors of Racial Disparities of HIV Retention in Care: A Statewide Cohort Analysis
Fanghui Shi, Chen Zhang, Jiajia Zhang, Bankole Olatosi, Sharon Weissman, Xiaoming Li, Xueying Yang

TL;DR
This study examines how racial disparities in HIV care retention have changed over time in South Carolina and identifies factors that may influence these disparities.
Contribution
The study introduces a novel analysis of county-level contextual factors influencing racial disparities in HIV retention in care over time.
Findings
Racial disparities in HIV retention in care remained largely unchanged in South Carolina from 2013 to 2020.
Counties with more primary care providers and higher social capital showed lower racial disparities in retention in care.
Certain socioeconomic and structural factors were associated with disparities, but no major changes were observed despite national initiatives.
Abstract
Racial disparities have historically existed regarding HIV care outcomes, including retention in care (RIC). However, data regarding the longitudinal patterns and predictors of such disparities among different racial groups and various geolocations are limited. This study aims to explore the contribution of contextual features (e.g., socioeconomic and structural environmental factors) to the changes in RIC outcome disparity at the county level. All adult people with HIV who received a HIV diagnosis in South Carolina (SC) between 2013 and 2020 were included in this study, and their de-identified CD4 counts and viral load information were derived from the SC statewide HIV registry system. All contextual factors were extracted from multiple publicly available datasets, such as the American Community Survey. To provide a comprehensive view, we used four indices to measure racial disparities…
Genes, proteins, chemicals, diseases, species, mutations and cell lines named across the full text — each resolved to its canonical identifier and authoritative record.
Click any figure to enlarge with its caption.
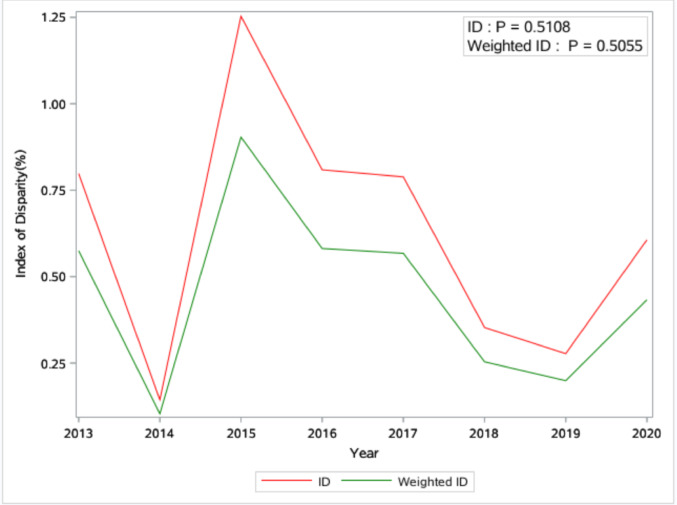 Figure 1
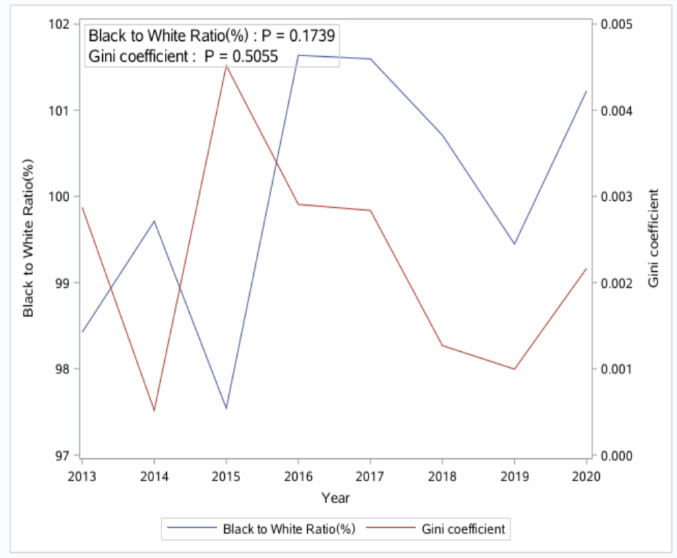 Figure 2
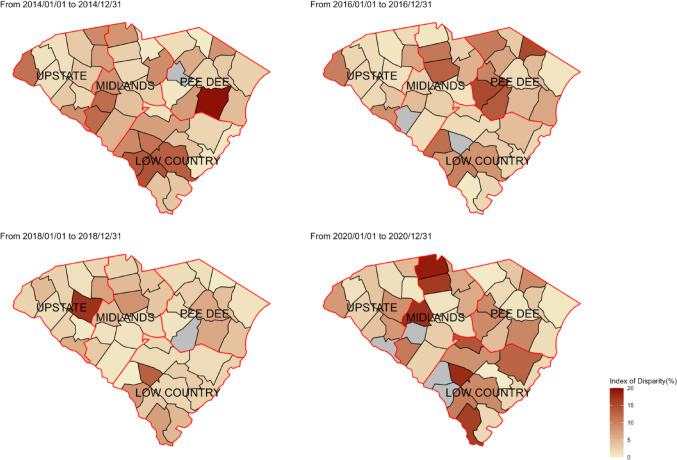 Figure 3
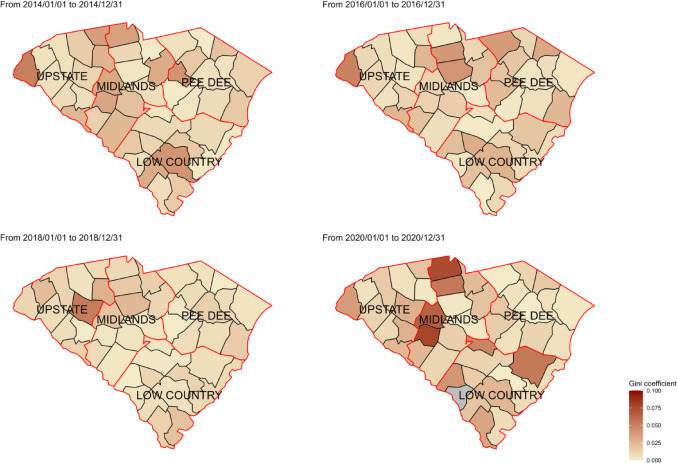 Figure 4
- —University of South Carolina
Peer Reviews
No public reviews on file for this paper yet. If you reviewed it on a platform where reviews are public (OpenReview, ICLR, NeurIPS, ICML), you can paste yours below so the community can read it here.
Videos
No videos yet. Explain this paper in a talk, walkthrough, or lecture? Add one.
Taxonomy
TopicsHIV/AIDS Research and Interventions · HIV, Drug Use, Sexual Risk · Homelessness and Social Issues
Introduction
Retention in care (RIC) is a critical step in the HIV care continuum, essential for improving health outcomes among people with HIV (PWH) and reducing HIV transmission [1]. PWH who receive consistent medical care are more likely to adhere to antiretroviral therapy, less likely to progress to AIDS, and exhibit higher survival rates compared to those without regular care [2, 3]. Furthermore, RIC can facilitate the suppression of HIV viral loads to undetectable levels, which is critical in preventing further transmission [4]. Despite these benefits, only 54% of people diagnosed with HIV in the United States (US) and alive at the end of 2022 were retained in care, with notable racial/ethnic disparities persisting [5–7]. Specifically, in 2022, the proportion of Black/African American PWH (52%) who are retained in care is lower than that among non-Hispanic White PWH (55%) [5, 7].
Racial disparities in RIC are prevalent among PWH [8]. A systematic review of disparities in RIC among adults living with HIV/AIDS summarized that non-Hispanic Blacks/African Americans exhibited increased risks of poor retention in care compared to non-Hispanic Whites, even after adjusting for individual (e.g., age, gender, and HIV transmission mode) [7] and neighborhood (e.g., transportation barrier and residential segregation) factors [8]. Additionally, the degree of racial disparities in RIC varied by geographic location, with the southern US showing more pronounced disparities than other regions [9]. Given the significant HIV burden and low RIC rate in the Southern US, there is an ongoing need for enhanced efforts to understand and address the factors contributing to racial/ethnic disparities in HIV RIC in this area, such as South Carolina (SC).
While numerous studies have examined the social and structural determinants of RIC among PWH [10, 11], limited research focuses specifically on the structural predictors of racial disparities in RIC. Understanding racial disparities in RIC needs to be framed within the context of social and structural factors, such as racial residential segregation, which shape PWH’s options and opportunities for social relationships, healthcare access, housing, and physical and mental health. Systemic barriers to RIC have been well documented in past research and include factors such as a lack of easily available housing and high-quality services, residing in geographic areas with poor socioeconomic conditions, inadequate transportation infrastructures that hinder access to care, and insufficient availability of comprehensive HIV care [12]. These barriers may disproportionately affect Black/African American PWH due to historical systemic racism, leading to increased racial disparities in HIV care outcomes [13–15]. However, it remains unclear whether these barriers contribute to a widening disparity in RIC between Black and White individuals, and which specific barriers have the greatest impact on these racial disparities.
Various measures have been used to quantify racial disparities in disease burden, such as rate ratio, index of disparity (ID), weighted ID, and Gini coefficient [16, 17]. The rate ratio compares the outcome rate of one racial group to a reference group, while the ID is an absolute summary measure that captures the average percentage difference between the outcome rates of each racial group and a reference group. Based on ID, the weighted ID incorporates the population size of each racial group to ensure that larger groups have a greater influence on the index. The Gini coefficient measures the extent to which the distribution of health outcomes among racial groups deviates from perfect equality. These disparity measures could be useful and informative in summarizing the burden of disparity at a time point, analyzing the temporal trend, and informing the target group of HIV prevention. However, there is potential for inconsistencies between different disparity measures because they differ in their data requirement, calculation method, and some other factors [16, 17]. For example, the 2011 Sexually Transmitted Disease Surveillance report from the Centers for Disease Control and Prevention presented 3 disparity measures, including ID, weighted ID, and the Gini coefficient, to illustrate racial disparities in gonorrhea rates between 2007 and 2010 [17]. In this report, an increase in disparity was indicated by ID, but a decrease in disparity was indicated by weighted ID and Gini coefficient. The selection of which disparity measures to choose requires subjective judgements by the user about what is just, fair, and socially acceptable [16, 18–21]. Experts in the field of quantifying disparities have suggested using multiple measures instead of relying on any single measure to provide a comprehensive view of racial disparities in disease burden [22]. Using multiple indices helps capture different aspects of disparities, guiding more effective and equitable public health interventions [22].
The present study sought to leverage integrated statewide electronic health records (EHRs) data and publicly available datasets to (1) use quantified measurements of racial disparities in RIC and explore their spatiotemporal variations across 46 counties in SC from 2013 to 2020 and (2) investigate social and structural factors associated with these disparities at the county level. The findings from this study can provide valuable insights to inform community- or structural-level interventions designed to reduce racial disparities in RIC across SC.
Methods
Participants and Data Sources
The current study is a statewide population-based retrospective cohort study conducted at the county level. All adult (≥ 18 years old) PWH who received a HIV diagnosis in SC across 46 counties from 2013 to 2020 were included in analyses. Their CD4/viral load test records were extracted from the SC Department of Public Health (DPH) Enhanced HIV/AIDS Reporting System (eHARS) [23], which is a statewide surveillance system developed by CDC to track population-based HIV/AIDS data. All county-level variables that measure the socio-environmental characteristics of the PWH were retrieved from publicly available survey/data sources, such as the American Community Survey (ACS), County Health Rankings & Roadmaps, and Area Health Resources File (AHRF). The Federal Information Processing Standards (FIPS) code, a numeric code unique to each county, was used to link aggregated county-level indicators through varied data sources. The University of South Carolina institutional review boards and relevant SC state agencies approved the study protocol (IRB #: Pro00121718).
Racial Disparities in County-Level RIC
Individual-level variables in the SC HIV registry system between 2013 and 2020 were used to calculate the aggregated county-level retention in care (RIC) percentage. According to the CDC definition, individual-level RIC status was identified yearly and considered “retained in care” in a calendar year if two or more CD4/viral load tests were performed at least three months apart during that year [24]. Then, individual-level RIC status was aggregated to the county level, and the county-level RIC rate was measured as the percentage of PWH who were considered “retained in care” in each county during one calendar year. To capture different disparities, we used four commonly utilized relative measurements of racial disparities in county-level RIC, including the black-to-white rate ratio (BWR), ID, weighted ID, and Gini coefficient.
We calculated the BWR as the percentage of RIC among Black PWH divided by the percentage of RIC among White PWH in each county. A BWR greater than 1 indicates the RIC rate is higher for Black individuals compared to White individuals, highlighting a specific disparity between these two groups. The ID reflects the average of the absolute differences between RIC rates in different racial groups we examined (Black PWH and White PWH) and the RIC rate for the overall population. We calculated ID as follows:
\documentclass[12pt]{minimal} \usepackage{amsmath} \usepackage{wasysym} \usepackage{amsfonts} \usepackage{amssymb} \usepackage{amsbsy} \usepackage{mathrsfs} \usepackage{upgreek} \setlength{\oddsidemargin}{-69pt} \begin{document}$$\:ID=\:100*\left(\frac{{\sum\:}_{i=1}^{2}\left|{Rate}_{i}-{Rate}_{overall}\right|}{2}\right)/{Rate}_{overall}$$\end{document}where i indicates the racial group, Rate is the RIC rate among PWH in the given group, and Rate_overall_ is the RIC rate across Black and White PWH combined. Higher values of ID indicate greater variability and overall disparity.
We calculated weighted ID in an analogous manner, except that we calculated a population-weighted average of the absolute differences in RIC rates between each group and the RIC rate for the overall population, as follows:
\documentclass[12pt]{minimal} \usepackage{amsmath} \usepackage{wasysym} \usepackage{amsfonts} \usepackage{amssymb} \usepackage{amsbsy} \usepackage{mathrsfs} \usepackage{upgreek} \setlength{\oddsidemargin}{-69pt} \begin{document}$$ \begin{gathered} \:Weighted\:ID = \hfill \\ \:100*\left( {\frac{{\sum \: _{{i = 1}}^{2} \left| {Rate_{i} - Rate_{{overall}} } \right|*Population_{i} }}{{Population_{{overall}} }}} \right)/Rate_{{overall}} \hfill \\ \end{gathered} $$\end{document}where Population_i_ is the population size for group i and Population_overall_ is the population size of combined Black and White groups. Weighted ID gives more importance to disparities affecting larger groups, and higher values indicate greater disparities.
The Gini coefficient was adapted from a statistical measure of economic inequality in a population and was applied to sexually transmitted disease prevention-related research [25]. To calculate Gini coefficient, we ranked the Black and White groups 1 and 2 according to their RIC rates (i = 1 and i = 2 denote group with lower and higher rates, respectively). We calculated the Gini coefficient as:
\documentclass[12pt]{minimal} \usepackage{amsmath} \usepackage{wasysym} \usepackage{amsfonts} \usepackage{amssymb} \usepackage{amsbsy} \usepackage{mathrsfs} \usepackage{upgreek} \setlength{\oddsidemargin}{-69pt} \begin{document}$$\:G=1-\:{\sum\:}_{i=1}^{i=2}({Y}_{i}+\:{Y}_{i-1})({X}_{i}-\:{X}_{i-1})$$\end{document}where Yi and Xi are the cumulative percentage of RIC and the cumulative percentage of the number of PWH, respectively, and X0 and Y0 are both 0. The Gini coefficient summarized overall inequality across racial groups, and higher values suggest a more unequal distribution of RIC.
The selection between the index of disparity (ID) and weighted ID depends on one’s choice of whether to treat each racial/ethnic group equally, regardless of population size. Both weighted ID and Gini coefficient account for the population size of the racial/ethnic groups, whereas the Gini coefficient reflects the overall spread of health disparities without focusing on specific groups, and weighted ID gives more weight to groups with greater population representation. Thus, the selection between weighted ID and Gini coefficients depends on whether to emphasize disparities affecting larger groups. Additionally, compared to ID, weighted ID, and Gini coefficient, the rate ratio directly measures how many times higher (or lower) one group’s rate is compared to the other, instead of reflecting the overall disparity between two groups.
County-Level Characteristics
Based on the social determinants of health conceptual framework [26], a total of 24 county-level characteristics were retrieved from publicly available datasets (e.g., American Community Survey, County Health Rankings, and U.S. Department of Health and Human Services), and they were categorized into intro five groups, including (1) racial residential segregation: spatial proximity, delta, Black/White dissimilarity index, and isolation index; (2) social capital indices: collective efficacy, institutional health, community health, and family unity; (3) social vulnerability indices (SVIs): socioeconomic status, minority status and language, household characteristics and disability, and housing type and transportation; (4) health care resources and health behavior: the number of primary care providers, Ryan Whtie HIV centers, and mental health centers, and the percentages of smoking, drinking, and disability; (5) other characteristics: male%, vacant houses%, unemployed%, Gini index for income inequality, uninsured%, and religious adherence%. The detailed definitions and calculations are listed in supplemental Table 1. Additionally, 46 counties were categorized into four public health regions defined by SC DPH, including Upstate, Midlands, Pee Dee, and Lowcountry.
Statistical Analyses
First, we used the 25th percentile, median, 75th percentile, and interquartile range (IQR) to summarize county-level characteristics in 2020. Second, we employed line plots with linear regression analyses to demonstrate the temporal trend of four racial disparities in RIC indices from 2013 to 2020. Third, we generated maps to depict the spatiotemporal variations of the ID and Gini coefficient in SC in 2014, 2016, 2018, and 2020. Finally, we applied linear mixed-effects models with forward selection to investigate the relationship between county-level characteristics and three racial disparities in RIC measurements, including ID, weighted ID, and Gini. The random effect accounted for repeated measures in the same county. The Black to White ratio was not included as an outcome in the analysis because the Black to White ratio does not reflect racial disparities in a linear manner, and linear mixed effects models could oversimplify the complex non-linear relationship between county-level characteristics and racial disparities. All analyses were conducted using R version 4.1.2, and the statistical significance level was set at a p-value less than 0.05.
Results
Spatiotemporal Variation of County-Level Disparities in RIC
From 2013 to 2020, a total of 17,591 adult PWH were included in the analyses, and most of them were male (72.2%), non-Hispanic Black (75.9%), and with the HIV transmission mode being men who have sex with men (45.2%). (Supplemental Table 2) The distribution of PWH across the 46 counties varied considerably, with a median of 100 PWH per county (range: 14 to 2,344; interquartile range: 166). There was no consistent increase or decrease in racial disparities in RIC over the years. (Figures 1 and 2).
Fig. 1. Temporal trend of Index of Disparity (ID) and Weighted version of the Index of Disparity (Weighted ID) from 2013 to 2020 in South Carolina
Additionally, the BWR fluctuated from 2013 to 2020 and was less than 1 in some years and greater than 1 in others, indicating that the RIC percentage among Black individuals was not consistently lower than that of White individuals throughout the study period. (Fig. 2) Geographically, counties in the southern and middle regions of SC exhibited consistently higher racial disparities than others when using ID to measure racial disparities in RIC (Fig. 3). However, counties in the northwest region of SC showed higher disparity when using Gini as the measurement (Fig. 4).
Fig. 2. Temporal trend of Black to White ratio and Gini Coefficient of retention in care from 2013 to 2020 in South Carolina
Fig. 3. Geographic mapping for the index of disparity in South Carolina in 2014, 2016, 2018, and 2020
Fig. 4. Geographic mapping for the Gini coefficient in South Carolina in 2014, 2016, 2018, and 2020
The Distribution of County-Level Characteristics
Table 1 presents the distribution of county-level characteristics across 46 counties in SC in 2020. The median percentage of the male population and vacant homes were 48.43% and 17.08%, respectively. The unemployment rate stood at a median of 6.33%, while 10.38% of residents were uninsured. Additionally, 53.5% of the population adhered to a religious faith. On average, each county had just 1 Ryan White HIV center, 29 primary care providers, and three mental health facilities.
Table 1. Descriptive statistics for county-level variables^a^25th percentileMedian75th percentileIQRRacial residential segregationBlack/White dissimilarity index25.0030.5038.0013.00Isolation index0.410.540.610.19Delta0.310.460.560.24Spatial proximity0.930.950.970.04Social capital indicesFamily unity-1.81-1.16-0.511.30Community health-0.79-0.55-0.310.48Institution health-0.050.250.380.43Collective efficacy122.00216.50353.00231.00Socio vulnerability indices (SVI)SVI_Socioeconomic status0.600.830.890.29SVI_Household characteristics and disability0.420.680.840.42SVI_Minority status and language0.600.710.790.19SVI_Housing type and transportation0.500.730.920.42Health Care Resources and health behaviorPrimary care providers8.0029.0074.0066.00Ryan White HIV centers1.001.003.002.00Mental health centers3.003.004.001.00Smoking (%)17.0019.0020.003.00Drinking (%)15.0016.0017.002.00Disability %13.9716.2018.314.34Other characteristicsMale (%)48.1048.4349.461.36Vacant houses (%)12.0417.0822.1810.14Unemployed (%)5.036.337.312.28Uninsured %9.7110.3811.491.78Gini index0.450.470.480.03Religious adherence (%)41.0053.5059.0018.00IQR: Interquartile range^a^25th percentile, median, 75th percentile, and IQR were only shown for county-level variables in year 2020, considering limited table space
The Relationship between County-Level Characteristics and Racial Disparities in RIC
When using ID as the outcome, counties with exacerbated racial disparities in RIC were more likely to have less social interaction among Black individuals (indicated by isolation index; β=-1.92, 95%CI: -3.31~-0.53), stronger family unity (β = 1.75, 95%CI: 0.40 ~ 3.13), less collective efficacy (β=-1.27, 95%CI: -2.04~-0.52), fewer primary care providers (β=-1.78, 95%CI:-2.75~-0.81), and fewer income inequalities (indicated by Gini index; β=-0.81, 95%CI: -1.5~-0.08). For weighted ID, no county-level contextual factors explored were significantly associated with racial disparities in RIC. Similar to ID, when using the Gini coefficient as the outcome, counties with fewer primary care providers (β=-0.004, 95%CI: -0.006~-0.001) and less social capital in collective efficacy (β=-0.002, 95%CI: -0.005 ~ 0.000) showed higher degrees of racial disparities in RIC (Table 2).
Table 2. Association of county-level characteristics with Racial disparities in retention in care across 46 counties in South Carolina from 2013 to 2020Index of DisparityWeighted Index of DisparityGini coefficientBeta (95%CI)p-valueBeta (95% CI)p-valueBeta (95% CI)p-valueRacial residential segregationBlack/White dissimilarity index0.37(-0.5, 1.23)0.4310(-0.5, 0.49)0.9970(-0.003, 0.002)0.979Isolation index-1.92(-3.31, -0.53)0.015-0.01(-0.82, 0.8)0.985-0.0001(-0.004, 0.004)0.952Delta0.17(-0.96, 1.32)0.7780.05(-0.61, 0.7)0.8990.0002(-0.003, 0.003)0.922Spatial proximity0.56(-0.14, 1.25)0.1370.12(-0.29, 0.52)0.5830.0006(-0.001, 0.003)0.546Social capital indicesFamily unity1.75(0.4, 3.13)0.0230.68(-0.09, 1.46)0.1210.0034(0, 0.007)0.115Community health0.45(-0.21, 1.09)0.215-0.18(-0.56, 0.19)0.386-0.0009(-0.003, 0.001)0.361Institution health0.92(0.19, 1.65)0.0240.21(-0.24, 0.65)0.3960.001(-0.001, 0.003)0.395Collective efficacy-1.27(-2.04, -0.52)0.004-0.46(-0.95, 0.05)0.102-0.0024(-0.005, 0)0.047Socio vulnerability indices (SVI)SVI_Socioeconomic status---0.09(-0.81, 1.07)0.867---SVI_Household characteristics and disability0.13(-0.93, 1.22)0.822-0.11(-0.71, 0.53)0.75-0.0005(-0.003, 0.003)0.775SVI_Minority status and language0.58(-0.2, 1.36)0.1750.12(-0.34, 0.55)0.6350.0006(-0.002, 0.003)0.61SVI_Housing type and transportation-0.23(-0.72, 0.27)0.386-0.26(-0.54, 0.02)0.096-0.0013(-0.003, 0)0.094Health Care Resources and health behaviorprimary care providers-1.78(-2.75, -0.81)0.002-0.7(-1.34, -0.01)0.065-0.0037(-0.006, -0.001)0.02Ryan White HIV centers0.31(-0.46, 1.1)0.465-0.03(-0.47, 0.42)0.897-0.0002(-0.002, 0.002)0.89Mental health centers0.09(-0.68, 0.86)0.836-0.33(-0.79, 0.13)0.204-0.0016(-0.004, 0.001)0.2Smoking (%)-0.13(-0.82, 0.56)0.7140.01(-0.41, 0.41)0.9720.0001(-0.002, 0.002)0.929Drinking (%)0.18(-0.59, 0.94)0.6660.06(-0.39, 0.5)0.8050.0002(-0.002, 0.002)0.83Disability %1.22(0.11, 2.32)0.0420.22(-0.44, 0.81)0.5260.0011(-0.002, 0.004)0.53Other characteristicsMale (%)0.58(-0.28, 1.43)0.2160.31(-0.17, 0.8)0.2540.0015(-0.001, 0.004)0.255Vacant houses (%)0.26(-0.44, 0.99)0.5030.08(-0.3, 0.51)0.710.0004(-0.002, 0.003)0.713Unemployed (%)-0.82(-1.79, 0.14)0.116-0.1(-0.66, 0.42)0.724-0.0005(-0.003, 0.002)0.722Uninsured %0.46(-0.45, 1.33)0.337-0.22(-0.74, 0.27)0.423-0.0011(-0.004, 0.001)0.424Gini index-0.81(-1.5, -0.08)0.033-0.1(-0.5, 0.32)0.643-0.0005(-0.002, 0.002)0.663Religious adherence (%)-0.16(-1.01, 0.67)0.727-0.06(-0.56, 0.42)0.838-0.0002(-0.003, 0.002)0.865RegionMIDLANDS-0.36(-2.14, 1.42)0.7090.67(-0.4, 1.72)0.2670.0035(-0.002, 0.009)0.221PEE DEE-0.36(-1.91, 1.18)0.671-0.41(-1.38, 0.52)0.443-0.0019(-0.006, 0.002)0.442UPSTATE2.46(-0.38, 5.31)0.1191.29(-0.42, 2.96)0.1770.0067(-0.001, 0.015)0.139Notes: --- Variables were omitted after forward selection
Discussion
The current study investigated the spatiotemporal variations of four quantified measurements of racial disparities in RIC from 2013 to 2020 in SC and identified potential predictors contributing to these variations. Results from our study revealed no significant linear increase or decrease in racial disparities in RIC from 2013 to 2020, but there was clear spatial heterogeneity across counties in SC. When using ID and Gini to measure racial disparities, counties with more primary care providers and higher social capital in collective efficacy showed lower racial disparities in RIC. Regarding racial residential segregation, higher racial disparities in RIC were observed more in counties with a lower isolation index. Efforts to address racial disparities should continue, and innovative approaches, specifically those that focus on social and structural factors, should be developed and implemented for populations that have poor HIV outcomes in the US.
Consistency and Inconsistency between the Four Measurements of Racial Disparities
Although consistent, insignificant increasing or decreasing trends were found for all four summary measurements of racial disparities in the present study. These measurements sometimes indicated different relationships between county-level characteristics and racial disparities. For example, the negative association between the number of healthcare providers and racial disparities was found for ID and the Gini coefficient, but not for the weighted ID. The relationship between racial residential segregation and racial disparities was observed for ID only, but not for the weighted ID and the Gini coefficient. The potential for inconsistencies between disparity measures due to the way they are calculated has been one of the well-known methodological issues for racial disparity measures [22]. However, experts in quantifying disparities have typically avoided promoting a single disparity measure as the “best” measure, and the use of multiple measures rather than one single measure was recommended [24, 27]. Following this guidance, our study employed four of the most commonly used summary measures of racial disparities to illustrate the relationship between county-level characteristics and racial disparities in RIC. This approach provided us with a more comprehensive understanding of the examined relationship.
Factors Associated with Lower Racial Disparities in RIC
Our findings indicate that counties with more healthcare providers and higher collective efficacy demonstrated lower racial disparities in RIC. The number of primary care providers in a county reflects one aspect of local healthcare access, while the collective efficacy index measures one aspect of social capital, such as the community’s ability to work together to achieve common goals, mutual trust, and the willingness to take collective action for the common good [28, 29]. Primary care providers are key sources of HIV information for Black/African American communities [30], and people of color who rely on their primary healthcare providers as the main source of HIV care and information were more motivated to engage in HIV treatment [31]. Thus, a dwindling HIV workforce and a lack of coordinated HIV care exacerbated the problem of poor RIC, especially for Black/African American PWH [29]. As for collective efficacy or social capital in general, PWH in counties with high social capital can access more social interactions and resources, which have been proven to affect health-seeking behaviors and retention in medical appointments positively [12, 32].
Racial Residential Segregation and Racial Disparities in RIC
Counties with a smaller isolation index, which indicates less racial residential segregation, exhibited greater racial disparities in RIC [33]. The isolation index focuses on the likelihood that a member of a particular racial group lives in a neighborhood with a high proportion of people from the same group [34]. Living in a neighborhood with a higher proportion of people from the same group can be related to stronger social networks and support systems, providing culturally appropriate health resources, enhancing health literacy, and improving health outcomes [35, 36]. Healthcare infrastructure and community support are crucial in reducing county-level racial disparities in RIC in SC [37–39]. Expanding the availability of HIV care services and promoting culturally appropriate community social support can increase treatment opportunities, ultimately helping to decrease racial disparities.
Study Limitations
Our study has some limitations. First, we could not conduct more granular spatial analyses (i.e., ZIP code level instead of county level) due to a lack of geographic identification information at the ZIP code level in eHARs, which is necessary to link publicly available ZIP code-level characteristics. However, the variations of community factors and racial disparities in RIC within each county should not be ignored. Second, due to the threat of potential modifiable areal unit problems (MAUP) [40], caution must be taken when generating the findings to other geographic levels. Third, there was little data on institutional-level practices and characteristics (e.g., average wait time, provider demographics) that may influence racial disparities in RIC. Future studies should aim to include these institutional variables to provide a more comprehensive understanding of how structural factors influence unequal outcomes and can inform targeted interventions to reduce racial disparities. Lastly, this study focused solely on racial disparities between Black and White PWH due to the limited number of individuals from other racial groups in our dataset. Future research should incorporate additional racial and ethnic groups to provide a more comprehensive understanding of disparities in RIC.
Conclusions
Despite efforts to curtail the HIV epidemic in the past decades, racial disparities in HIV care-related outcomes, such as RIC, remained in SC over the years. Interventions leveraging contextual and structural factors can be better designed to support equitable healthcare access and outcomes among PWH across racial and geographic populations. These interventions could include strengthening healthcare infrastructure in underserved areas and promoting community-level support systems. In addition, partnering with community leaders, advocacy groups, and PWH themselves will enhance the relevance and sustainability of these interventions, ultimately leading to better RIC and improved health outcomes across all racial and ethnic groups in SC.
Electronic Supplementary Material
Below is the link to the electronic supplementary material.
Supplementary Material 1
The reference list from the paper itself. Each links out to its DOI / PubMed record.
- 1The center for disease control. and prevention, Estimated HIV incidence and prevalence in the United States, 2018–2022. https://link.springer.com/journal/10461/submission-guidelines. Accessed 20 May 2024.
- 2Doshi RK, Bowleg L, Blankenship KM. Tying structural racism to human immunodeficiency virus viral suppression. Oxford University Press US; 2021. pp. e 646–8.10.1093/cid/ciaa 125232845976 · doi ↗ · pubmed ↗
- 3Centers for Disease Control and Prevention. Sexually Transmitted Disease Surveillance, 2011. Atlanta: U.S. Department of Health and Human Services; 2012. https://www.cdc.gov/std/stats/archive/Surv 2011.pdf. Accessed 15 Jun 2024.
- 4Menza TW, Hixson LK, Lipira L, Drach L. Social determinants of health and care outcomes among people with HIV in the United States. Open Forum Infectious Diseases, 2021. Vol. 8. No. 7. US: Oxford University Press.10.1093/ofid/ofab 330PMC 829769934307729 · doi ↗ · pubmed ↗
- 5Lee M. US Congress Joint Economic Committee The geography of social capital in America. 2018. https://www.lee.senate.gov/services/files/da 64fdb 7-3b 2e-40d 4-b 9e 3-07001 b 81ec 31. Accessed 15 Jun, 2024.
- 6Sherwood J, Blumenthal S, Sayas A. White Counties Stand Apart: The Primacy of Residential Segregation in COVID-19 and HIV Diagnoses.10.1089/apc.2020.0155 PMC 758561332833494 · doi ↗ · pubmed ↗
- 7Williams DR, Collins C. Racial residential segregation: a fundamental cause of racial disparities in health. Public health reports, 2016.10.1093/phr/116.5.404PMC 149735812042604 · doi ↗ · pubmed ↗